Monitor
Monitor
Once your integration has been released, the integration page will start to populate with a range of metrics.
To view these metrics, open your integration from the Integrations page.
You’ll be presented with 2 tabs–__Overview and Invocations:
Intro
The Overview tab provides outline details of your integration, including:
-
Performance metrics
-
Details of which experiences have been configured to call the integration
-
A changelog showing the released versions
Performance metrics
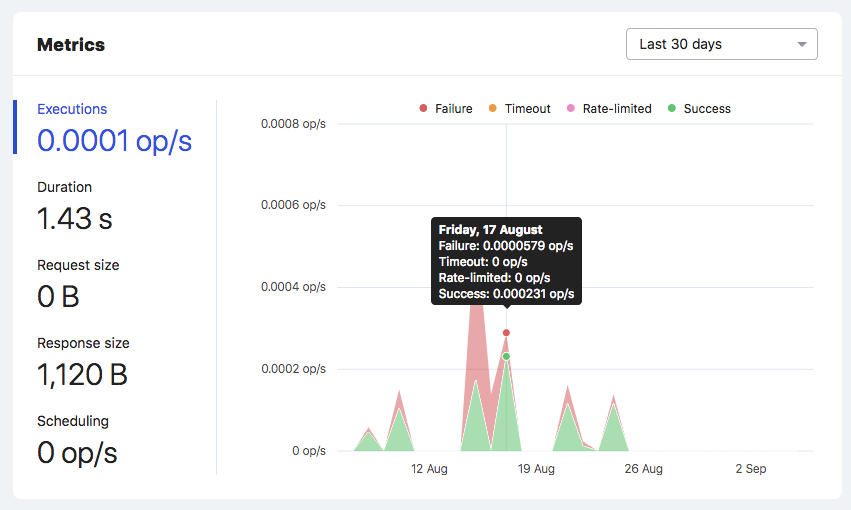
The Metrics card displays 5 key integration metrics and a visualization of each metric for the chosen reporting period:
-
Executions: The rate at which the integration was executed. Hovering over a point on the graph will provide a breakdown of successful, failed, timed-out and rate-limited executions.
-
Duration: The average duration of the executions.
-
Request size: The average size of the request payload.
-
Response size: The average size of the response payload.
-
Scheduling: The rate of scheduled executions.
|
|
Note
By default, the reported metrics are shown for the last hour. You can change this by making a selection from the select box on the top right of the card. |
Experiences
The Experiences card shows you a list of experiences that have been configured to call the integration:

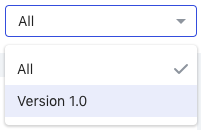
By default, the list will display the experiences that have been configured to call any version of the integration. If you’re only interested in a particular version, you can filter the list of experiences to show only those that are linked to a specific version.
To do this, make a selection from the select box in the upper-right hand corner of the page:
You can jump to any of the experiences listed by selecting the experience name.
Details
The Details card displays the integration description and also the changelog history.
As mentioned earlier, each time you make a change to an integration, a new version is created. An entry will also be inserted into the changelog. For each version, you’ll find:
-
Version number
-
Timestamp of the release
-
Changelog of updates the release contains
-
Name of the user that released the version
Invocations
The Invocations tab provides a stream of your integration’s invocations, including the execution time, duration, and status:

Invocation flow
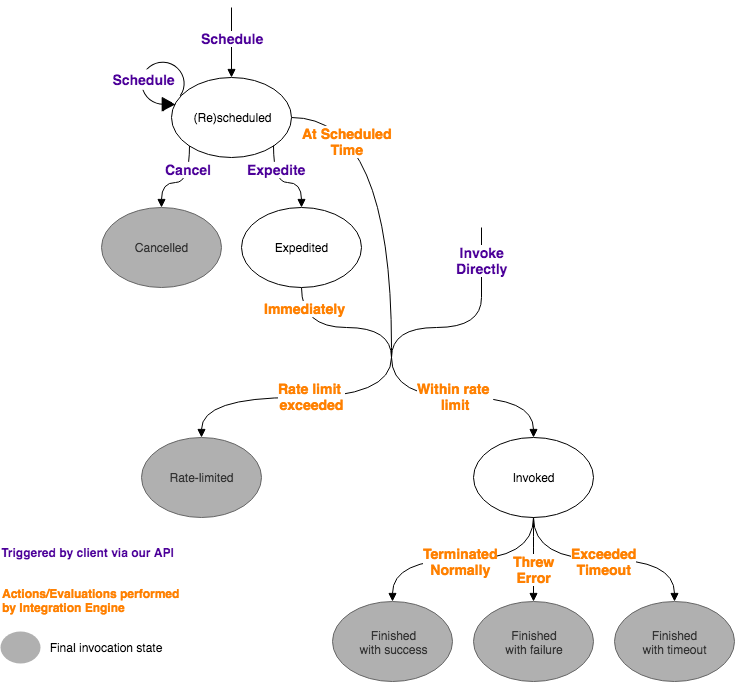
Refer to the following diagram for an overview of how an integration moves from one state to another after being scheduled or invoked:
Status
Let’s take a look at the details of each invocation status in more detail, as this is likely to be the most useful information for resolving any problems.
|
|
Note
The final execution status for each invocation determines the status reported in the Invocations table. |
Each invocation of an integration can have one of six statuses:
-
Scheduled: The integration has been scheduled to be invoked at some future point.
-
Cancelled: The integration was been scheduled to be invoked at some future point but the invocation was subsequently cancelled.
-
Rate-limited: The integration didn’t execute as the rate limit was reached. See Other settings.
-
Timed out: The integration was executed and finished but timed out. An invocation will timeout if it hits the execution timeout limit: the invocation is then terminated.
-
Failure: The integration was executed and finished but encountered an error during execution.
-
Success: The integration was executed and finished without errors.
Viewing the invocations logs
You can get more details about each invocation by selecting it from the list. In the following example, the user has selected an invocation that finished with success:
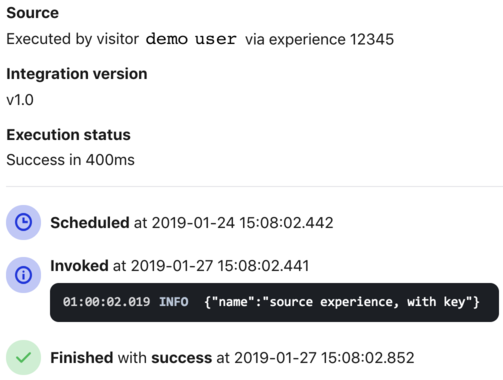
In the above example, we see that the integration was invoked by a linked experience.
|
|
Leading practice
If the integration was invoked by an experience, we will provide a link to it. |
A focus on HTTP requests
All external HTTP requests are automatically logged.
Selecting  will allow you to expand the entry and see detailed information for the request:
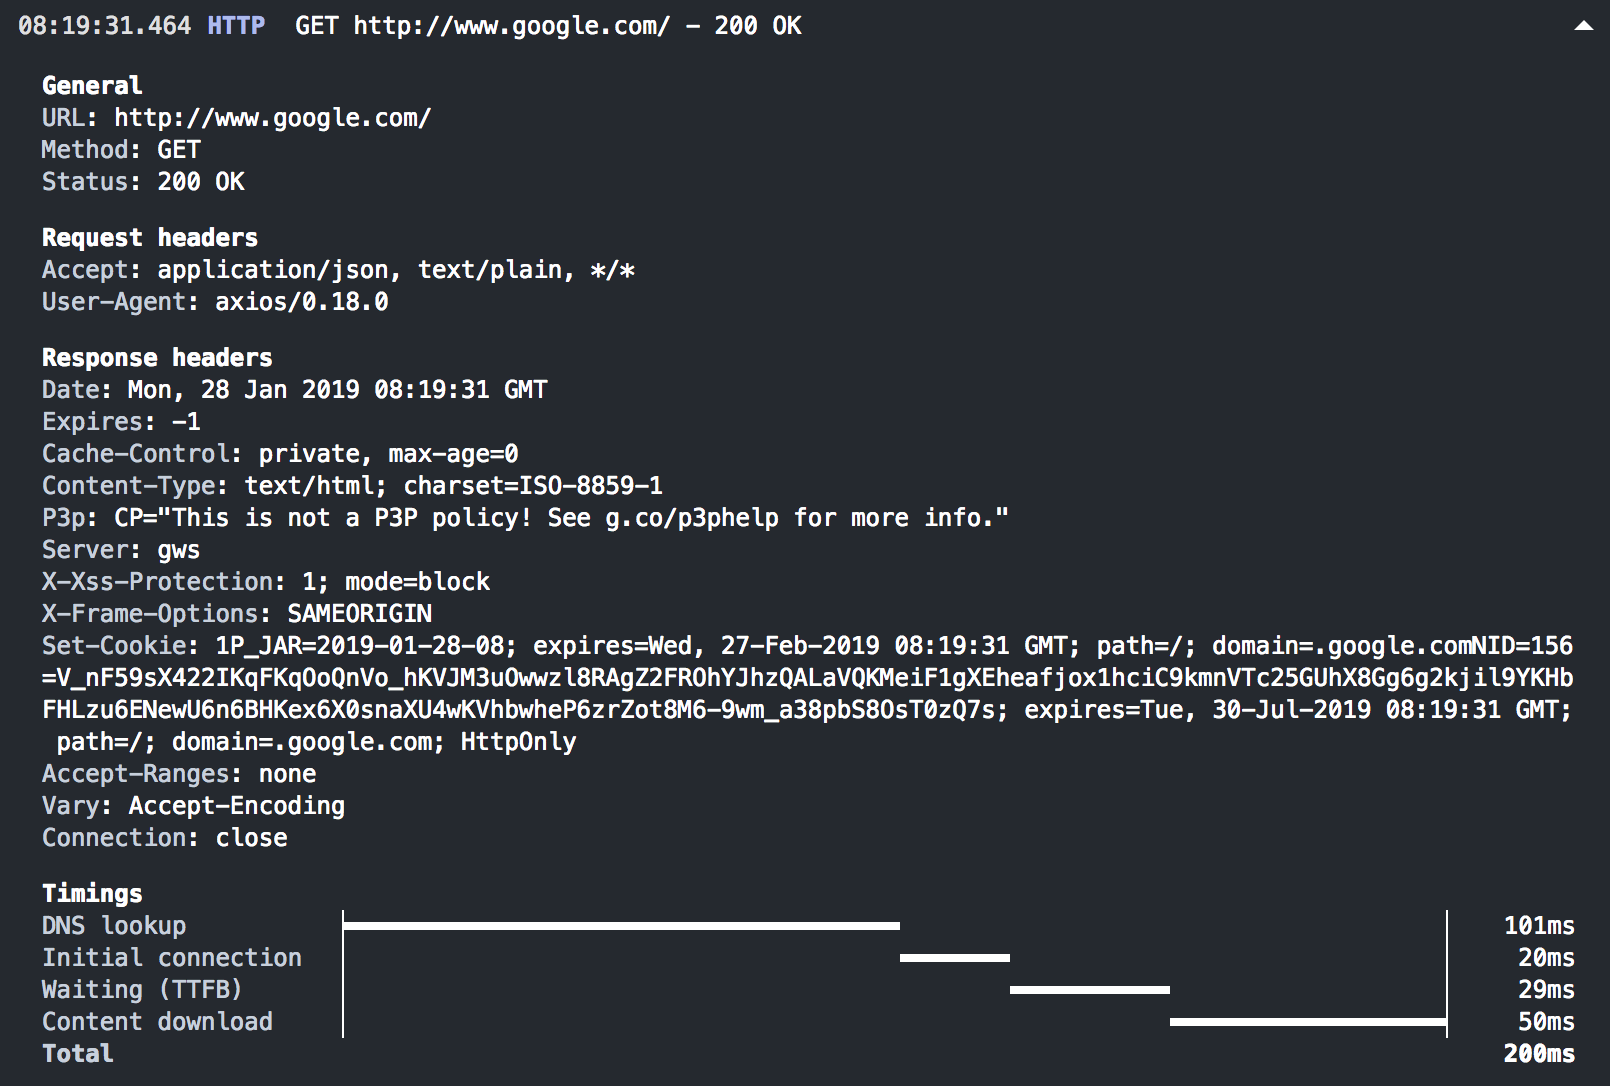
This information is useful for debugging long execution times as slow HTTP requests are generally the reason integrations time out.
Filtering the invocation table
Load newer, newest, older
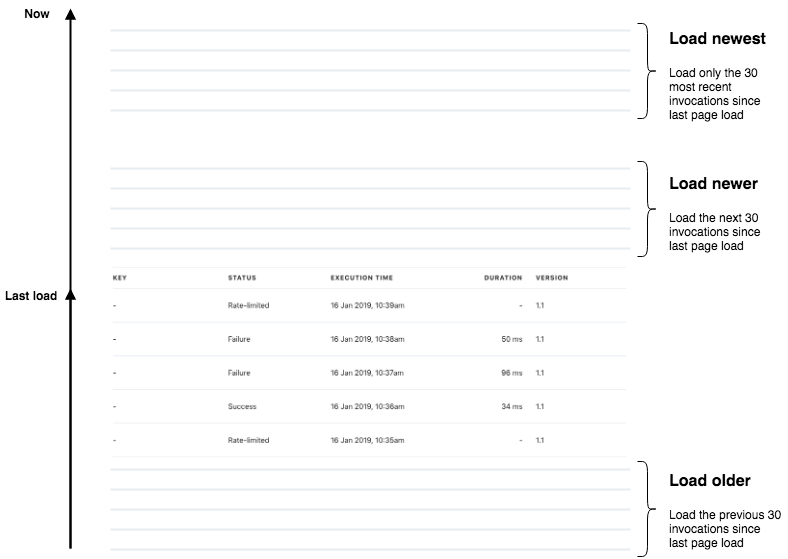
When you open the Invocations tab, we will display the most recent 30 invocations covering the last 30 days of invocations.
Clearly, whilst viewing the list of invocations, additional invocations may be occurring. You can refresh the list of invocations to display:
-
The most recent 30 invocations > Load newest (resets the table contents)
-
The next 30 invocations since the last page load > Load newer (loads additional table rows)
-
The previous 30 invocations since the last page load > Load older (loads additional table rows)
The following diagram will help explain the concept:
Applying filters
When debugging, it’s often useful to filter the table of invocations. You might filter by status, for example, or source.
To open the filters, select 
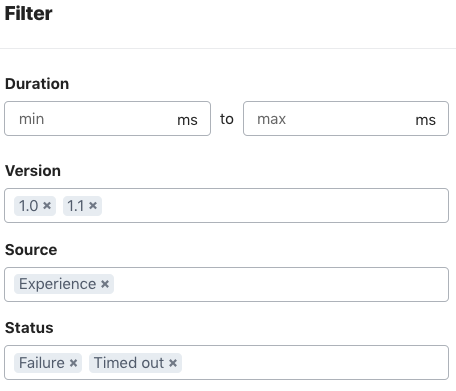
The available filters are self-explanatory but it’s important to understand that the filters are ANDed together but that the options within each filter are ORed together.
So in the following example, the filter would return invocations with:
-
A version number of 1.0 OR 1.1 AND
-
Those invoked by an experience AND
-
Those with a final status of Failure OR Timed out:
A focus on key
One filter that’s particularly useful for debugging is key.
|
|
Note
Key refers to the |
You can use this to return only those invocations that match the key-value pair.
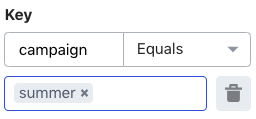
In the following example, the user has chosen to return invocations matching the key campaign and value summer:
Toggling Completed and Scheduled invocations
By default, we display only those invocations that have completed, irrespective of their status.
To view invocations for scheduled integrations, change the option in the combo box to the right of the page to Scheduled:
