Introduction to experiences
Introduction to experiences
In this article, we’ll introduce you to the basic experience flow and then show you how to find out what’s going on with your experiences, both property-wide and individually.
The basic flow
After your experience is published, it should be live on your site within a few minutes. At this point, once triggers have passed, qualifying visitors (as defined in the segments you’re targeting) will join the experience and start to interact with it. This interaction generates events.
Important among these events are qubit.experience–emitted when a visitor joins the experience, and goal events–emitted when a visitor achieves an experience goal.
We use these events and the associated data to not only notify you about the health of an experience but also to report on the value the experience is delivering and its performance against goals.
Being able to analyze the value and performance of your experiences is a critical pathway in the personalization journey and key to delivering against your personalization goals.
So how do you go about finding and understanding the metrics associated with value and performance?
Intro page
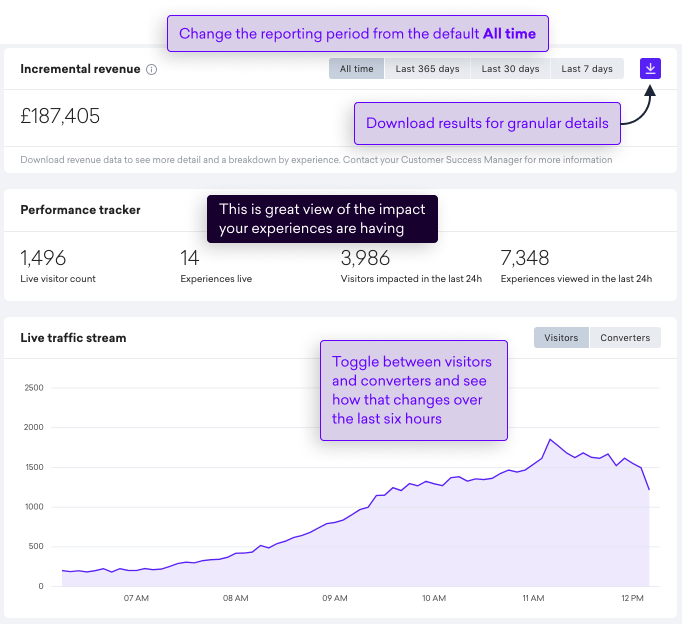
You can get a top-level view of key experience metrics across your property in your Overview page:
|
|
Note
Incremental revenue on the Overview page is site-wide and aggregates the revenue from all live, paused, and archived experiences for your property. |
Experience list page
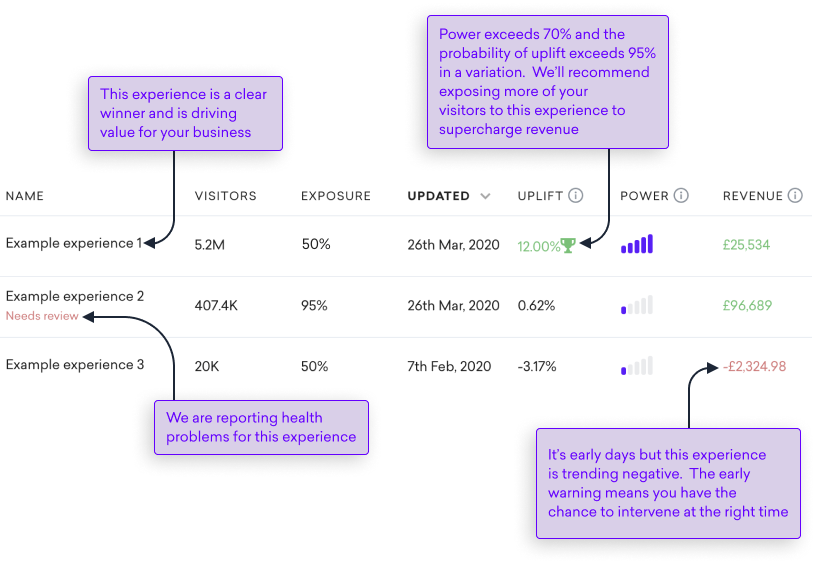
In your list of experiences, we take these metrics down to the individual experience level. Using this view allows you to get a heads up on performance and see if any experiences are having a negative impact on revenue or are showing signs of poor health:
Searching for experiences
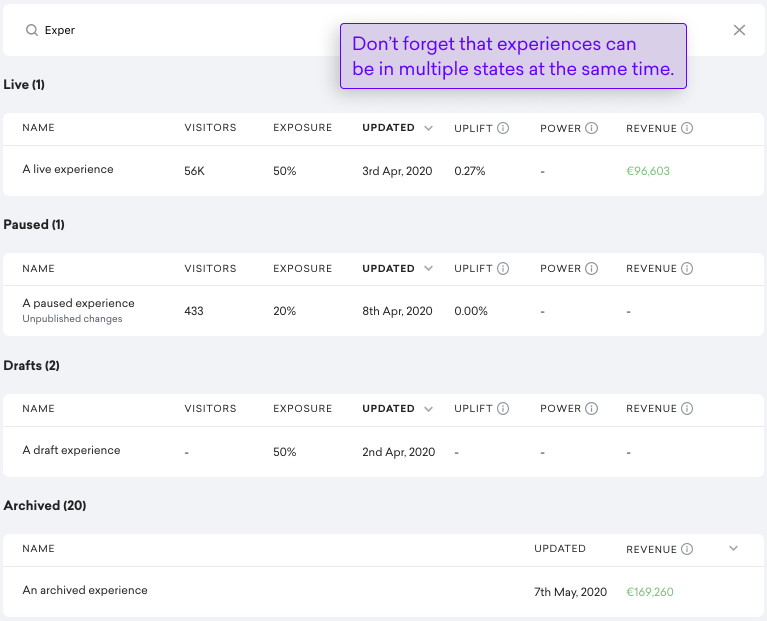
To help you find the right experience, when you perform a search, we’ll group the matching experiences according to state: Live, Scheduled, Drafts, Archived, and favorites.
In the following example, the user has searched using the string "Exper". The search has returned four matches, across four different states:
Experience details page
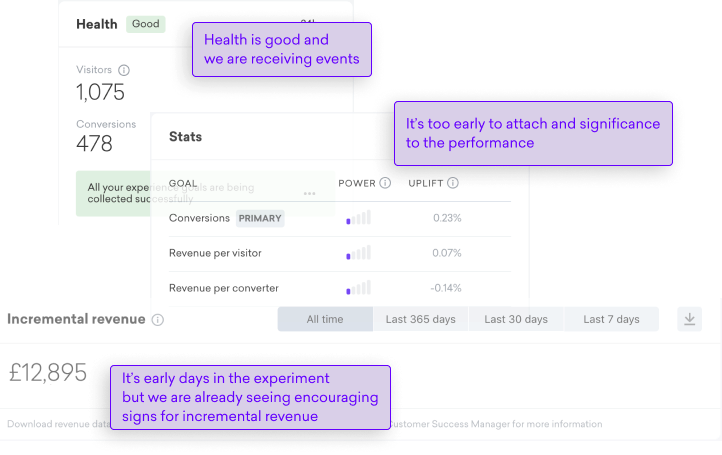
You can go even further into the metrics by opening an experience. This will give you the complete picture covering health, performance, and value:
FAQs
In the Health card, I see Visitors and Conversions. What do these metrics mean?
These metrics are an aggregation of the visitors exposed to your experience–this includes the control and any variations.
Let’s explain each of these metrics:
-
Visitors: An aggregate total of the number of visitors that saw the experience, across all iterations, over either the last 24hrs or since the experience went live
-
Conversions: An aggregate total of the number of visitors that saw the experience and then converted, across all iterations, over the last 24hrs or since the experience went live
For my experience, no metrics are being shown. What is the likely cause?
The Health card is your first port of call for diagnosing issues with your experience.
When no metrics are being displayed, the likely cause is that visitors aren’t seeing your experience. This might be because your segment conditions are too restrictive or that the trigger conditions aren’t being met.
As a first step, we recommend working with a member of your dev team to check segmentation and triggers are working as you expect.
We also recommend using the Qubit Explorer to make sure that the correct events are being emitted and that experience is being triggered as you would expect.
You can read more about the Qubit Explorer and validating your QP setup in Validating Your Setup.
What is a converter?
If your primary goal is Conversions, a converter could be a visitor who purchased on your site. However, this isn’t always the case, as it depends on how conversion has been defined for your property.
Conversion could be transaction based but equally could be based on phone calls received or form submissions. For more information, contact your CSM at Qubit.
I’ve paused an experience but I continue to see conversions, why is that?
Any conversions that occurred before the experience was paused will be counted for two weeks after the experience was paused.
What do the columns on the Experiences page mean?
On the Experience page, we display some basic information to give you a quick overview of what’s happening with your experiences:
-
Visitors: A real-time count of visitors that have been exposed to the experience. If the count is greater than 1000, we round to the nearest hundred. For example, we would round 70,895 to 70,900
-
Exposure: The traffic split for the experience. See Traffic allocation for more information
-
Updated: A timestamp for the last change that was made to the experience and the user that made that change
-
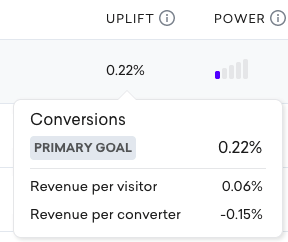
Upift: The observed change between the control and variations for the primary and any secondary goals. A 0% uplift means there’s no difference, and a negative uplift (or downlift) means that the control actually did better than a variation:
|
|
Note
At Qubit we express this change as a percentage. So if the control has a Conversion Rate of 4%, and the variation has a Conversion Rate of 5%, we would say this is a 25% percent uplift, since 5 is 125% of 4 |
-
Power: The probability that a meaningful result was achieved. See Power
-
Revenue: The estimated incremental value of the experience, factoring in power
Why is the Incremental Revenue card not shown?
Right now, the card is being activated on a per-customer basis. If you don’t see it, reach out to your CSM at Qubit.
Why is the revenue metric not displayed for an experience?
We report Incremental Revenue for experiences that meet the following criteria:
-
Less than 100% exposure: Experiences running at 100% exposure can’t be included in the revenue calculations because it’s not possible to make a comparison between the control and the variation if there’s no control group
-
RPV goal: We use Revenue Per Visitor (RPV) to compute incremental revenue.
-
Minimum of 500 converters per variation: For split traffic experiences, we have a minimum threshold of 500 converters that needs to be passed before
-
Been live for a minimum of seven days: To report revenue, with the highest level of confidence, we require an experience to have been live for at least seven days. This ensures that enough data has been collected to mitigate short-term seasonal effects that could be misleading when reporting on revenue.
What insights can I gain from other metrics while I’m waiting for an experience to report Incremental Revenue?
For guidance of performance over shorter time periods, you can take inferences from other metrics such as Conversion Rate and Revenue Per Visitor. However, bear in mind that these are not entirely indicative of the actual incremental revenue that has been generated.
What experiences will I find in the different views: Live, Scheduled, Paused, etc?
|
|
Leading-practice
It’s worth remembering that an experience can display in multiple views. For example, a live experience that was published according to a schedule, will display in both the Live view and in the Scheduled view. In addition, if there are unpublished changes for that experience, it will also display in the Drafts view. |
Live
-
Currently live on your site or mobile app
-
Contributes to the weight of Smartserve
Scheduled
-
A live experience with a future end date/time. On end, the experience is moved to Paused
-
An unpublished experience with a scheduled start date/time. On start, the experience is also shown in Live
Paused
-
Previously live on your site but has since been paused either manually or by a scheduled end date/time
-
When recently paused, contributes to the weight of Smartserve
-
After sixty days, paused experiences are moved to the Archived view
Draft
-
Being worked on and not yet published
-
Currently live with unpublished changes
-
Doesn’t contribute to the weight of Smartserve
Archived
-
Doesn’t contribute to the weight of Smartserve
-
Can be permanently deleted or unarchived
Favorites
If you have some experiences that you regularly use, you can select them as favorites. When you do this, the experience will also display in the Favorites list. We’ll provide more details on experience status and how to select an experience as a favorite later.
-
Shows any experiences that you’ve selected as a favorite
-
Provides an easy way to access those experiences you use most often
To add an experience as a favorite, select against your experience and then select Add to favorites.
You can remove it by Remove from favorites
Will visitors continue to see experiences after it has been paused?
Yes, this is possible. Qubit re-publishes the Smartserve script when an experience is paused. However, since we have no control over the browser, it’s possible that a cached version of Smartserve will continue to be used. Until the browser cache is cleared, whether manually or automatically, visitors may continue to be served an experience.