Performance of an experience
Performance of an experience
In this article, in this article, we will take a look at experience goals, the part goals play in evaluating the performance of your experiences, and how to use power to gauge success.
Intro
Understanding the value driven by an experience is an important validation for your personalization efforts but that value must also be considered alongside the performance of an experience against its goals.
Being able to analyze the performance of an experience against its goals, understand what importance to attach to goal metrics, and see what’s likely to change over time are critical to making timely decisions as you look to maximize the value from your personalization efforts.
Getting started
First view of goals
Your Experience list page is your first port of call and a great place to get a top-level view of how each of your experiences is performing against its goals. Let’s take a look at an example:

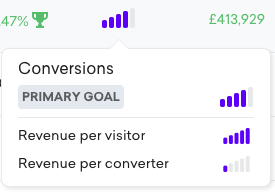
By hovering on the uplift, we can see how the experience is performing against each of the defined goals:
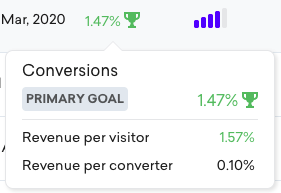
Primary and secondary goals
Each Qubit experience will have a primary goal and secondary goals. You can add a maximum of five goals for each experience.
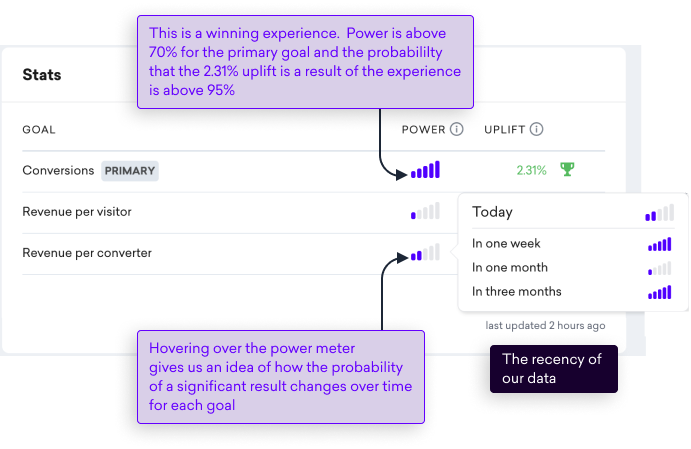
Performance against goals is also presented in your Stats card, shown when you open an experience. Let’s look at an example:
|
|
Note
When referring specifically to the metric reported for an experience, RPV and RPC refer to revenue from the moment a visitor enters the experience until the moment they leave or the experience ends. |
Custom goals
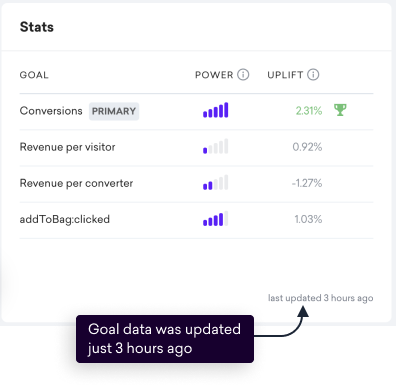
In this next example, we see that user has added a custom goal addToBag:clicked:
|
|
Note
Custom goals are a great option where you’re looking to evaluate the success of an experience in triggering a QP event or getting the user to interact with a button or a similar UI element. |
Goals and success
Performance can also be framed in terms of success and failure. Of course, what success means depends on what you’re trying to achieve and goals help us by providing the criteria we will use to evaluate whether an experience has been successful or not.
Using goals and the principles of A/B testing, we can answer focused questions such as:
-
Did visitors in my variation convert more than visitors in the control and is the difference significant? -
How does the RPV in my variation compare with the RPV in the control? -
Is the estimated RPC in my variation statistically significant? -
When can I consider my experience complete? -
Was my experiment successful?
We provide clear visual cues to help you evaluate your experience against each goal:
-
 - The power for the goal hasn’t yet reached 70%
 -
 - The power exceeds 70% and the probability of uplift exceeds 95% in one of the experiences variations
 -
 - The power exceeds 70% and the probability that the control is performing better than one of more of the variations exceeds 95%
Variations v control
For each goal, we report the results of experience variations compared to the experience control. Variations are always compared to the experience control, so, for example, A v B, A v C, A v D, etc.
|
|
We don’t perform direct comparisons between variations, B/C, C/D, etc. |
By comparing the variation to the control, you always have a solid basis to determine which variation, if any, is having the biggest impact on each of your goals, whether that be conversions, Revenue Per Visitor, or the firing of specific QP events.
Stated simply, the variation that’s most successful at achieving the primary goal is the winner.
Goals and experience completion
A goal is considered complete when it has reached statistical significance and achieved an acceptable statistical power.
|
|
Note
Remember that an experience is considered complete only when the primary goal has reached statistical significance. |
|
|
Note
Qubit declares a goal to be a winner, when the probability of uplift is greater than 95% and the power is greater than 70%. |
Declaring a winning experience
When your primary goal has reached an acceptable power, we will present the outcome of the experience.
There are a number of possible outcomes, each shown as a New finding:
-
If the probability of uplift is between 80% and 95% for the primary goal, we will report that a variation is performing better than the control.
This means we’re getting more confident about the change in uplift being attributable to the experience. However, because the result isn’t yet statistically significant (>95%), we can’t declare it a winner yet:

-
We have a winner!: In short, your experiment has been a success. You can be more than 95% sure that the observed change in uplift for the primary goal is a result of the experience and not some random factor.
In the following example, we’ve observed a 2.95% uplift in conversions for those visitors that saw the experience variation:

-
There is no measurable difference between the groups: In short, we’re not confident that there was any change in uplift worth mentioning or that those changes are attributable to the experience:

|
|
Note
95% is the default winning threshold for all Qubit experiences but you have the option of changing this. See Setting custom statistical thresholds. |
Using power forecasts to gauge success
What is power?
Power is the probability of a significant result given random sampling fluctuations around your actual data. In other words, it shows you the importance you can attach to a result. When power is low, there’s still a lot that could change in the experiment and it’s therefore too early to attach any significance to the result.
If we look at the following example, we would conclude that it’s far too early to attach any significance to either uplift or revenue–both could change significantly as more data is gathered:
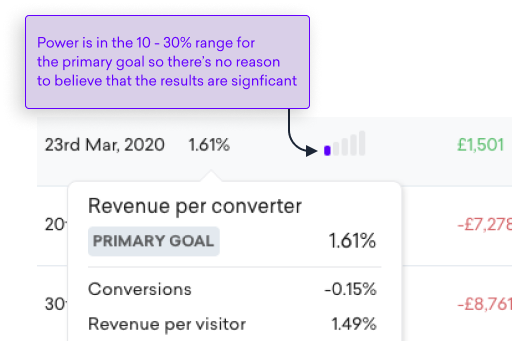
When you hover over the power meter, we’ll provide a breakdown by goal:
|
|
Note
You can alter the power by editing an experience’s winning threshold. See Setting custom statistical thresholds. |
Case studies
This section provides a couple of case studies illustrating how you can use power forecasts to gauge present and future success of an experiment.
This allows for more colorful and more justified decisions than simply terminate or keep waiting.
Case A
The experiment has collected many visitors and converters and a statistically significant probability of an uplift (~97%). The power forecast is increasing as we forecast into the next few weeks.
It’s looking good, it’s probably going to be a winner! Since the power forecast is increasing, we can decide whether to funnel more traffic into the likely winner by switching to a supervised 95/5 allocation.
Case B
The experiment has a decent amount of visitors and converters, with a not-yet significant probability of a downturn (~14%).
In this context, downturn refers to a decrease in the performance metric we’re tracking.
Today it has a low power but it’s increasing quickly as we forecast into the future.
It’s likely a loser. It might be worth ending early, but if you’re willing to wait a little bit to be sure, you can use the forecast to weigh the opportunity cost of this information alongside the raw cost of the likely-losing metric.
Case C
The experiment has a very broad audience, is relatively new, has few visitors and converters, a ~50% probability of an uplift, and a low power (both today and far into the future).
The Bayesian prior is the main contribution to the results, and the forecasts mainly reflect this prior, rather than the data. Since the prior is conservative, the power forecast is also conservative. The experiment is still new, so we should let it run some more and collect more data.
Case D
The experiment is very targeted, so it has few visitors and converters despite being very old, and a low power (both today and far into the future). The uplift is reported as (0.5±1)%, with a statistically insignificant ~70% probability of an uplift.
The experience is unlikely to drive a significant uplift, and even if it drives a minor uplift, we won’t have sufficient traffic to prove it. We should abandon rigorous testing of this experience and push the A/B test variation to 100% of the small audience’s traffic, confident that the added personalization is at least not worse than the control.
Case E
The experiment has many visitors and converters, a ~50% probability of an uplift, and a low power (both today and far into the future).
If the power is low currently and projected to be low in the future, there’s no reason to believe the experiment is making a significant impact or will do so in the future. The large amount of gathered data means, to your users, this is effectively indistinguishable from the control. It may be worth declaring the experiment futile and moving on to something else.
FAQs
What is statistical power and where has sample size gone?
We’ve replaced sample size with something called statistical power. It shows the likelihood that a significant result was achieved and accounts for both the volume of data collected and the observed results.
Why did you do this, is power better?
Power is a more effective measure than sample size. Whereas sample size uses a pre-determined effect size to determine if we’ve reached ‘sample’, based on the observed number of visitors, power takes into account the volume of data collected AND the observed results to give a more accurate representation of the current reliability of the test results.
How does it predict the future?
We were initially looking at a method of making it easier to "call" an experiment early, including faster stats, less precision, etc. Statistical power allows us to look at the volume of data collected and the currently observed results and make a prediction about whether it "`is worth waiting for more data`."
Are my previous testing results wrong?
No, sample size is still a very effective way of determining the results of an experiment but is less effective at helping us to make decisions earlier.
Power isn’t increasing over time, what does that mean?
IIf the power meter isn’t increasing over time, you won’t gain additional insights if the current results and data volume remain the same. In this scenario, you might consider "calling" the experiment early or changing the traffic allocation to 100%.
See Using power forecasts to gauge success for more information about the decisions you can take in our illustrative case studies.
Why is it no longer necessary to set an effect size for my experience?
Since the release of Statistical Power, we no longer use the default or custom effect size to determine if we’ve reached 'sample based on the observed number of visitors. Power takes into account the volume of data collected AND the observed results to give a more accurate representation of the current reliability of the test results.
I can’t see power or uplift estimates in the Test Results card. Why is that?
These metrics won’t display if you’ve selected the All traffic allocation mode.
See Traffic allocation for more information.
Why might I end a pilot mode test earlier than a test with a 50/50 split?
Experiences in pilot mode are usually “risky” experiences. They’re typically run in pilot mode to ensure they aren’t causing significant downturns, rather than to detect minor uplifts.
Power is the probability of detecting an uplift of the measured size, assuming that the measured uplift is real (not just a statistical fluctuation). The higher the power, the more certain you can be that you haven’t “missed out” on a significant effect in your data.
If a risky experience running in pilot mode is driving a massive negative effect, the power will become large quickly, and you should end the test once it reaches whichever power you’re comfortable with.
If this same experience isn’t driving a massive negative effect, and instead has a negligible or positive effect, the power will grow slowly, much slower than with a 50/50 split. Once you’ve mitigated the risks of the variation, you should republish the experiment with a 50/50 split to benefit from this optimal traffic allocation.
For both of these reasons, you’ll find yourself typically ending your “pilot” tests a little earlier than your 50/50 tests.
Why do split 50/50 tests run faster than supervised 95/5 tests?
Most tests require a large number of visitors in each variation to reach ~70% power. If a customer has only a 5% chance of being put in the control, or a 20% chance of being put in the variation, it will take a much longer time to complete that test. 50/50 is the fastest possible A/B test.
What QProtocol events are used to report conversions and revenue?
Although this can differ between clients and depends on the configuration of your property, typically the QProtocol events used to report conversions and revenue are identified in the following table:
| Vertical | Events |
|---|---|
Ecommerce |
|
eGaming |
|
Travel |
A few pointers
Goal attribution
Goals are attributed for two weeks after an experience is paused to cater for an experience influencing a visitor who purchases slightly later. We believe this is the most accurate way to handle the changes induced by iterations.
Goals and iterations
A visitor’s conversions and other goals are counted towards experience results only if achieved during the same iteration in which the visitor entered the experience.
Indeed the statistics must not carry conversions/goals across iterations because both the experience itself and the visitor’s allocation to control/variation may well have changed.
Multiple iterations can therefore delay the achievement of statistical significance.