The value driven by your experiences
The value driven by your experiences
In this article, in this article, we’ll look at Incremental Revenue and how you can use this metric to prove the value of your personalization efforts and ROI.
What is Incremental Revenue and why is it important?
Incremental Revenue reports the estimated monetary value that Qubit is driving for your business. It is both an expression of the estimated returns from your personalization efforts and an important validation point for your experiences.
Incremental revenue is a powerful metric for decision-making in digital marketing and a strong indicator of success. It is one of the best ways of proving the value your personalization efforts are driving and this makes it invaluable for digital merchandisers that need to optimize their budgets by focusing on result oriented tactics and channels.
|
|
Note
Right now, the |
Incremental Value across experiences
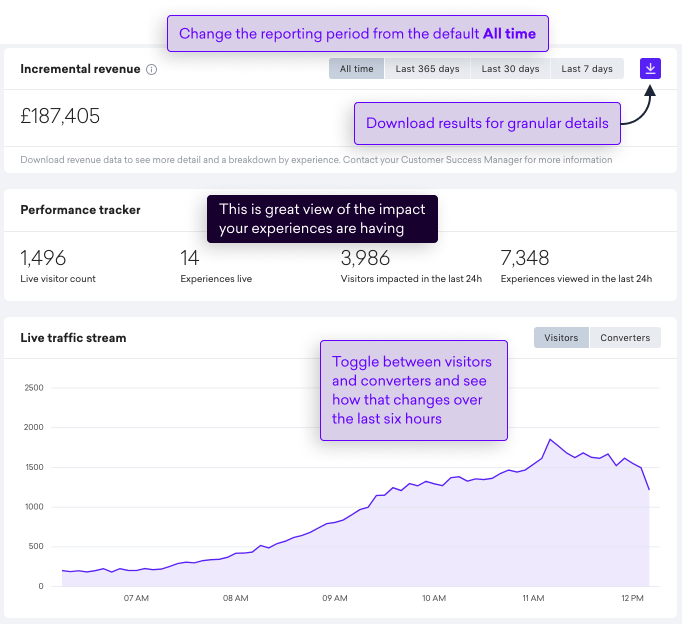
You can get a top-level view of the Incremental Revenue for you property, across all of your qualifying experiences (live, paused, and archived) in your Overview page. Let’s look at an example:

|
|
Note
All time reports Incremental Revenue from the date the experience was first launched but does not extend beyond April 2017. |
Incremental Value by experience
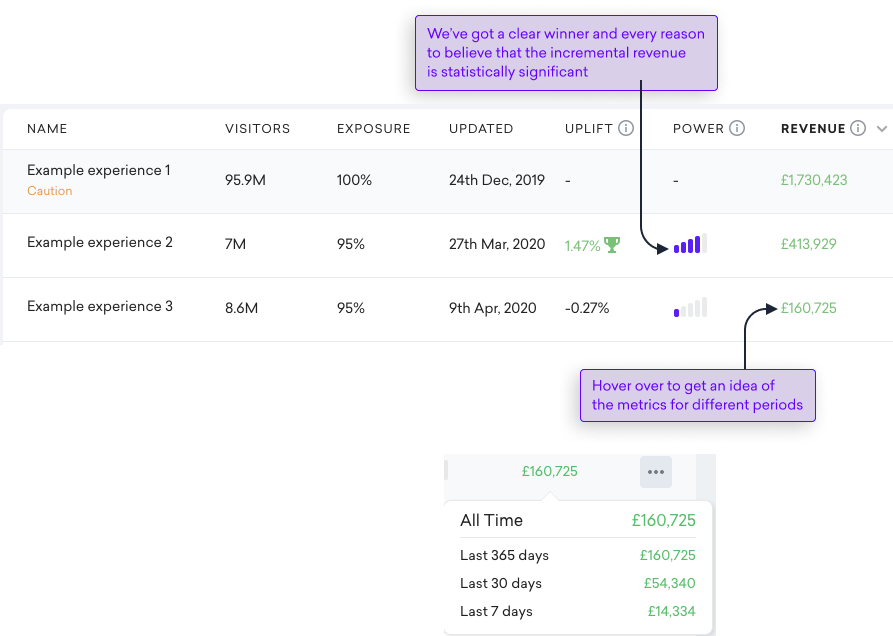
In your Experience list page, we’ll show you the Incremental Revenue for each of your experiences, so you can see how it differs from one to another. As with all the columns in this page, you can sort depending on what you are interested in. In the following example, we see that the user has sorted to show the best performing experiences by revenue:

Taking a rounded view of incremental value
For a rounded view of the value driven by your experiences, Incremental Revenue needs to be considered in tandem with other metrics.
Revenue by visitor
Looking at Incremental Revenue together with RPV is key. Suppose that an experience has about $15,000 in Incremental Revenue. If the probability of an RPV uplift is 86%, then there’s still a 14% chance that the experience is losing money; however if it does, then it is losing much less than the nominal $15,000.
Power
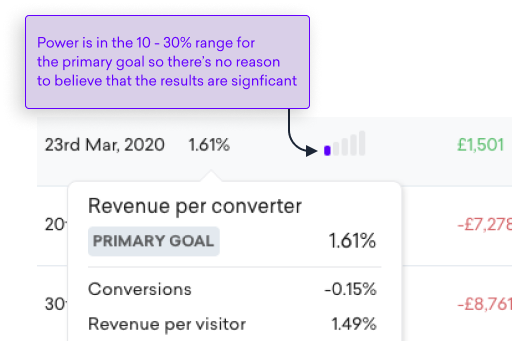
Another metric worth considering when looking at Incremental Revenue is the power associated with the RPV estimate. For example, an experience with low power today but a high power forecast in the near future is indicative of a large effect size. In this scenario, it might be worth terminating an experience immediately (to cut your losses on a likely suboptimal experience) or increasing its exposure to 95% of your traffic (to increase Incremental Revenue at the “cost” of waiting slightly longer to reach statistical significance).
If we look at the following example, we would conclude that it’s far too early to attach any significance to either uplift or revenue–both could change significantly as more data is gathered:

FAQs
How is it calculated?
Incremental revenue is calculated in the following way:
-
For each variation of each A/B/n test, compute the difference in Revenue Per Visitor (RPV) between the variation and the control
-
For each variation of each A/B/n test, multiply that difference by the number of visitors that viewed that variation—this is the Incremental Revenue of the variation
-
For each A/B/n test, sum all of the per-variation incremental revenues to obtain the per-experiment incremental revenue—this is the Incremental Revenue of the experience
-
Sum all of the per-experiment Incremental Revenues to obtain a total incremental revenue—this is the Incremental Revenue for your property
Why is RPV used to calculate Incremental Revenue?
RPV is used because it combines two variables that affect your bottom line: changes in Conversion Rate (CR) (more people buying), changes in Revenue Per Converter (RPC) (people buying more).
Consider a variation with a banner showcasing a sale. In the variation, conversions would increase but margins would decrease. The banner (and by extension, the sale) would be a success if the increase in Conversion Rate more than compensated for the decrease in RPC. RPV also encapsulates interactions between these two variables.
Consider a variation with promotional content aimed at upselling. The promotion increases conversions, and since it promotes upsell, it also increases the RPC. Each of these increases individually moves the needle on revenue in the variation. However the true effect on revenue is a little bit larger than the sum of these two parts (not only “more people buying” and “people buying more”, but also “more people buying more”).
What insights can I gain from other metrics while I’m waiting for an experience to report Incremental Revenue?
For guidance of performance over shorter time periods, you can take inferences from other metrics such as Conversion Rate and Revenue Per Visitor. However, bear in mind that these aren’t entirely indicative of the actual incremental revenue that has been generated.
What experiences are included in the count?
We report Incremental Revenue for experiences that meet the following criteria:
-
Had a control group at some point in the past: We can’t include experiences that were launched at 100% exposure in the revenue calculations because we need a control group to make a comparison with the variation
-
RPV goal: We use Revenue Per Visitor (RPV) to compute incremental revenue.
-
Minimum of 500 converters per variation: For split traffic experiences, we have a minimum threshold of 500 converters that needs to be passed before we start to show metrics
-
Been live for a minimum of seven days: To report revenue, with the highest level of confidence, we require an experience to have been live for at least seven days. This ensures that enough data has been gathered to mitigate short-term seasonal effects that could be misleading when reporting on revenue.
What happens when I change the experience from a split test to a 100% allocation?
As mentioned in the previous question, we can’t report Incremental Revenue for experiences launched at 100%. But what happens when you change the allocation from, for example, 20/80 or 50/50 to 100? In this scenario, we will freeze the measured RPV, but we keep counting the new visitors in the variation and count them towards the incremental totals.