Test and evaluate experiences
Test and evaluate experiences
A/B testing
Why is A/B testing important?
A/B testing is important to understand the true effect that a component has on a site. A/B testing uses comparison to find experience variations that are likely to perform well in the future.
As an example, suppose we want to know whether putting a welcome message on a website changes the Conversion Rate. If we simply went ahead and added the message, we might see, for example, a 2% increase in Conversion Rate.
This may seem like a great result at first glance, but how can we be sure that the change in Conversion Rate had anything to do with the welcome message. It may be related to, for example, a high profile shout-out in social media, or another page component. We have no way of making comparisons and determining whether the 2% would have happened without the new welcome message.
Because of this uncertainty, we need a controlled test method where we split visitors into two groups. One group, will see the site with the new welcome message. This is known as the variation.
The other group will see the website without the new welcome message. This is known as the control.
Of course, you can have several experience variations and each of these variations will be compared to the control. A/B, A/C, A/D, etc.
With a basis for comparison, we can compare the Conversion Rates in the two groups and isolate the impact of the welcome message.
An important consideration is how we split the two groups. It’s important that we divide the visitors to make sure both groups are representative of the population as a whole. To best way to do this, is to split them completely randomly. Then, the only difference between the two groups is the presence of the factor we’re interested in, in this instance, the welcome message, all other things being equal.
You should remember that in web testing, changes, positive or negative, are small and are very sensitive to bias. For example, if events are not being recorded on one kind of browser, this nullifies the test, because we don’t know if it had an effect.
When we have a randomized experiment with a control and a variation, this is called an A/B test.
This video gives an introduction to A/B testing.
Running meaningful/worthwhile tests
It is important to ensure we run good quality tests. For example, running too many tests increases the risk of getting false positive results. For this reason, it is better to see testing as a means rather than an end. Some useful questions to ask are:
-
Why are we testing this?
-
Will it drive value?
-
What will the impact be?
It is important to use the knowledge you already have to answer these questions so you can be sure you have a good quality hypothesis.
Another important question to consider is whether the effect being studied is measurable. Is the change in behavior significant enough to be detectable? Is there enough traffic for the test to finish in a reasonable amount of time? If not, is there something else that could be measured instead?
Running multiple A/B tests
It’s possible to run multiple A/B tests, although these tests will take longer to complete. Because visitors are assigned randomly to each test, in general, multiple A/B tests should be conducted independently.
Consider the following test:
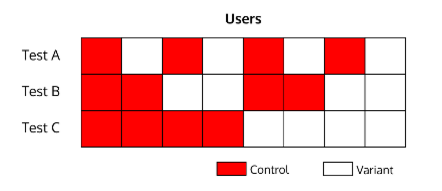
In this experiment, 50% of the control and variation groups have been exposed to tests A and B.
If test B causes a 10% uplift, the Conversion Rates in both the control and variation test C will rise by 5% because half of these users have been exposed to B. However in test C, since both the control and variation Conversion Rates rise, this does not affect the measured uplift.
Duration of tests
For normal tests covering events such as conversions or clicks, 6000 converters are required in each variation to reach a statistically significant result. If you know the average rate of these events, you can calculate the average duration of the test.
The requirement for 6000 events is the same, no matter how you split the visitor group between control and variation. If you perform a 95/5 split A/B test, each customer only has a 5% chance of being put into one of the variation, and so it will take a much longer time to get to 6000 for that variation. 50/50 is the fastest possible A/B test.
Tests for revenue are different because the distribution for revenue is much more complex than the models for the events above. For example, the revenue distribution can be seriously skewed by a handful of big spenders. As a result we need a large number of converters before we can say anything meaningful at all for revenue. Within the Coveo Experimentation Hub, results are not displayed for revenue tests until there are at least 500 converters in each variation.
Our typical tests aim for measuring a 5% uplift, with an 80% chance of being detected. To measure more granular differences, you will require more visitors in each variation. The relationship is roughly: each time you want to half the difference you can detect, the number of visitors you need is quadrupled. So, to measure a 2.5% difference, you need 6000*4 visitors.
Understanding test results
How are results generated?
The results are generated through the Experimentation Hub’s statistical model and shown in the Experiences Detail page. It takes the data from a test, such as number of converters and number of visitors in each variation and quantifies what we know about the effect of the variation.
The Experimentation Hub uses a Bayesian model. This type of model incorporates a prior belief of uplift based on many previous tests the Experimentation Hub has run. We have a state-of-the-art Bayesian stats model that takes into account many years of A/B testing knowledge as its prior. This means that its predictions are more realistic.
The alternative approach to the Bayesian approach, is the frequentist one. Frequentist stats center around the notion that if I repeated this many times, what is the proportion of times it will be true? Bayesian stats focuses more on the notion that given what I know, what is the probability that this given thing is true?
Understanding uncertainty
Whenever we measure any quantity in the real world there is some uncertainty. Even if you are doing a fairly direct measurement, such as measuring the dimensions of a table with a tape measure, the machine that made your tape measure is not perfect, and you as a human are not perfect at measuring things.
The way we measure Conversion Rate is in some ways quite indirect, we have to look at a sample of visitors, see how many of them convert and look at the ratio of these numbers.
Visualizing uncertainty
To try and illustrate how we can quantify uncertainty, let’s take a simple example. Suppose we have a coin, and we want to know how biased towards heads it is (the percentage of the time it will show heads.) How many time do we need to toss it? Well, we can never know for sure what the real bias is. If you toss a fair coin a million times, there is a chance, no matter how small, that you’ll see heads every time, which would lead you to think that the coin cannot land on tails. This bears repeating: there is no certainty in statistics.
We can however get a good idea of how big the bias is likely to be. Suppose we throw the coin 10 times and we see 6 heads and 4 tails - 60%. Of course, we don’t now know that the bias is exactly 60%. But it is possible, under some assumptions we won’t discuss, to assign a measure of belief to where we think the probability of heads lies, illustrated below.
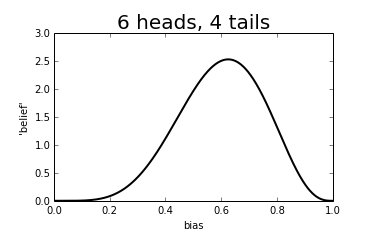
You can see that we think it is quite unlikely that the probability of heads is small (<0.2) but apart from this, we don’t really know where the bias is. But here is what happens as we increase the number of throws:
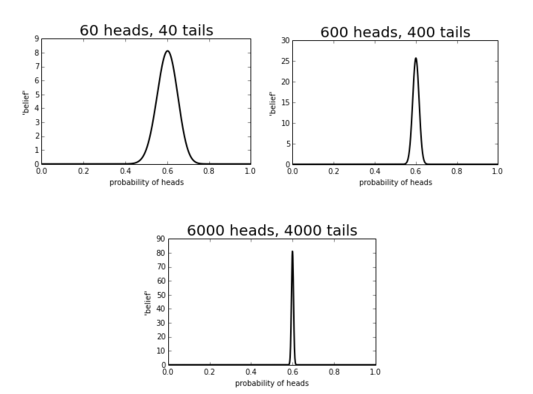
We see that our estimate about where the probability gets sharper as our sample size grows. Said another way, the uncertainty decreases the more data we have.
Uncertainty in A/B tests
Significance
When we run an A/B test, we are hoping to show that the variation has a significant chance of providing a positive effect; we are looking for a measured uplift that is very unlikely to have happened by chance. Again, we can never know for sure that a test provided an uplift as there is always room for an extremely unlikely statistical blip.
As we saw in the last section, given some data and some assumptions, we can assign belief to what we think a measurement such as Conversion Rate is.
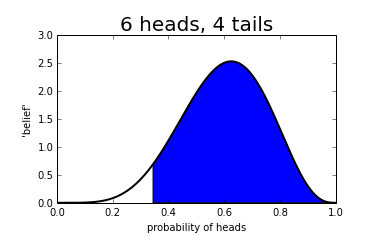
In particular, we can work out a threshold where we are at least 95% sure that the value is true.
95% is rather arbitrary, but is the standard in web-analytics.
For example in the coin toss example as above, 95% of the graph is greater than 0.34, meaning that we are 95% confident that the coin throws heads 34% of the time or more.
We call this region a credible interval.
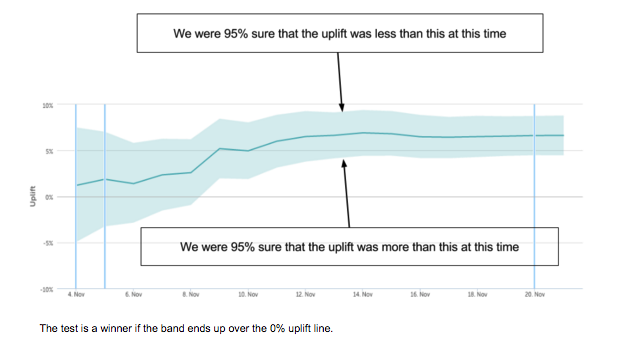
Similarly, when we run an A/B test, we can calculate the 95% lower bound for uplift. If we are 95% sure it is greater than 0, we declare the test a winner. This means that 5% of the time we will be wrong! This is known as a false positive and is defined as a test that we thought was beneficial, but wasn’t, and may well be harmful even. We call the probability of avoiding a false positive the significance of our experiment, and at Coveo we always run at 95% significance.
Power - how long does a test take before it’s meaningful?
There is another kind of mistake we can make. If we finish the test and 0 is still in the 95% range, we have to call the test inconclusive. But it could be that the uplift was in fact beneficial, there was just too much uncertainty to measure it. In this case we have a false negative. We think a sensible effect size of interest is 5% uplift. We then say the power of a test is the chance that given this effect size, we will detect it and declare it a winner. Our tests are run at 80% power; we will miss 20% of things that provide a 5% uplift.
There is a trade-off between power and the number of visitors we need in a test. The only way we can increase power is by decreasing uncertainty and, as we have seen, this requires more data. We have chosen 5% uplift and 80% power as a reasonable cutoff for most clients, though sometimes these numbers can be changed, for example if you think the effect size is likely to be a lot smaller than 5%.
To test the validity of the A/B test, follow these steps:
-
Estimate the effect you hope to achieve with the test, such as a 1% increase in conversion rate.
-
Determine the audience size, split evenly between the control and variation groups in the A/B test.
-
Use an online tool to find a sample size that will provide a reasonable level of statistical significance.
-
Input the data into the sample size tester to determine the number of visitors needed for the test.
Coveo Experimentation Hub revenue model
Dealing with revenue as part of A/B testing is complicated, because the distribution for revenue is much more complex than just the converter/non-converter model. For example, the revenue distribution can be seriously skewed by a handful of big spenders. As a result, revenue tests take longer than other tests to complete.
At Coveo, we’ve developed our own revenue model, using non-parametric Bayesian techniques to detect significant uplifts. Additionally, to prevent skewing of the data by outliers, we calculate the sample size to detect 5% uplifts 80% of the time.
Frequently Asked Questions
What is A/A testing?
A/A testing uses two identical versions of a page against each other. Instead of discovering a lift in conversion, the goal of an A/A test is to check that there is no difference between the control and variation.
A/A testing checks the effectiveness and accuracy of the A/B testing software.
It is essential to understand that finding a difference in the conversion rate between the control and variation pages is possible due to randomness. If there is no true difference between the groups, the results of the A/A test can still yield the following:
-
True negative occurs 95% of the time
-
False positive occurs 5% of the time