Revenue
Revenue
This article contains SQL queries to create Snowflake dashboard tiles to report on the following metrics:
To learn how you can create custom dashboards in Snowflake and use the queries listed in this section, see Create Snowflake dashboards.
Revenue per service
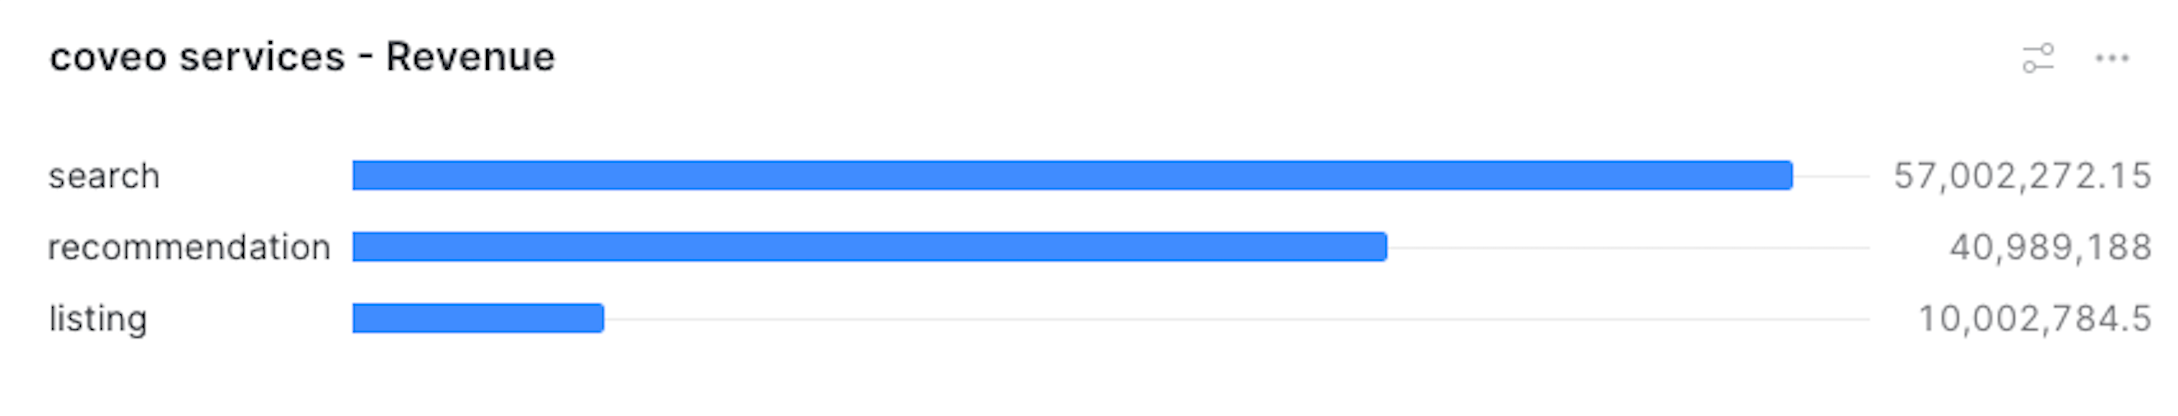
The following query creates a Snowflake dashboard tile that displays the revenue earned by each Coveo service (that is, Searches, Product listings, and Recommendations). This metric includes taxes, shipping costs, and discounts.
|
|
Updates to the computation methods for this metric have been implemented. As a result, executing this SQL query may yield slightly different results from those shown in the Advanced Reports (platform-ca | platform-eu | platform-au) page of the Coveo Administration Console. A new version of this query, which aligns with the outcomes of the reports of the Advanced Reports page, will soon be available. |
with transaction_base as (
select distinct
       date(tr.transaction_timestamp) as date,
       tr.visit_id,
       c.insight_id,
       ins.insight_type,
       tr.transaction_id,
       c.item_id,
       c.price*c.quantity as item_revenue,
       try_to_number(round(coalesce(tr.base_total, tr.total),3),38,3) as trans_total,
       sum(item_revenue) over (partition by tr.organization_id, tr.transaction_id) as total_revenue,
       round(div0(trans_total, total_revenue) * item_revenue, 3) as normalized_revenue
from COVEO_CORE_MODEL_V001.COMMERCE.TRANSACTIONS tr
join COVEO_CORE_MODEL_V001.COMMERCE.CART_ITEMS c on c.cart_id = tr.cart_id
join COVEO_CORE_MODEL_V001.COMMON.INSIGHTS ins on ins.insight_id = c.insight_id
where date = :daterange
and item_id is not null
)

select distinct
       insight_type,
       sum(normalized_revenue) as normalized_revenue
from transaction_base tb
group by insight_type
When using the default query, your dashboard should look like the following:
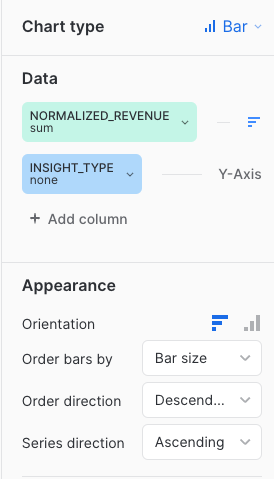
The Chart type, Data, and Appearance sections should look like the following. See Using charts for more information.
Revenue per service on a daily basis
The following query creates a Snowflake dashboard tile that displays the revenue earned by each Coveo service (that is, Searches, Product listings, and Recommendations) on a daily basis.
|
|
Updates to the computation methods for this metric have been implemented. As a result, executing this SQL query may yield slightly different results from those shown in the Advanced Reports (platform-ca | platform-eu | platform-au) page of the Coveo Administration Console. A new version of this query, which aligns with the outcomes of the reports of the Advanced Reports page, will soon be available. |
with transaction_base as (
select distinct
       date(tr.transaction_timestamp) as date,
       c.insight_id,
       ins.insight_type,
       tr.transaction_id,
       c.item_id,
       c.price*c.quantity as item_revenue
from COVEO_CORE_MODEL_V001.COMMERCE.TRANSACTIONS tr
join COVEO_CORE_MODEL_V001.COMMERCE.CART_ITEMS c on c.cart_id = tr.cart_id
join COVEO_CORE_MODEL_V001.COMMON.INSIGHTS ins on ins.insight_id = c.insight_id
where date = :daterange
)

select distinct
       date,
       insight_type,
       sum(item_revenue) as total_revenue
from transaction_base
group by date, insight_type
order by total_revenue desc
limit 10
When using the default query, your dashboard should look like the following:

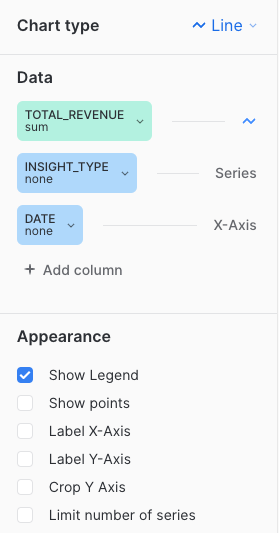
The Chart type, Data, and Appearance sections should look like the following. See Using charts for more information.
Total revenue
The total revenue
is calculated by adding up the revenue from every product sold in each purchase event.
The query in this section creates a Snowflake dashboard tile that reports on different Coveo service components.
|
|
Note
A Coveo service component refers to a specific instance exploited by a Coveo service. For example, you can have many components that leverage the Recommendation service:
In this case, the dashboard will report on these three different components. |
The following code sample serves as a base to get the total revenue metric for different Coveo components. You can add the required information to this generic version, according to the Coveo service component that you want to report on. However, the required information has been added to the sample queries in the following sections, so we recommend that you try one of them:
|
|
Updates to the computation methods for this metric have been implemented. As a result, executing this SQL query may yield slightly different results from those shown in the Advanced Reports (platform-ca | platform-eu | platform-au) page of the Coveo Administration Console. A new version of this query, which aligns with the outcomes of the reports of the Advanced Reports page, will soon be available. |
with transaction_base as (
select distinct
       date(tr.transaction_timestamp) as date,
       c.insight_id,
       ins.insight_type,
       tr.transaction_id,
       c.item_id,
       c.price*c.quantity as item_revenue
from COVEO_CORE_MODEL_V001.COMMERCE.TRANSACTIONS tr
join COVEO_CORE_MODEL_V001.COMMERCE.CART_ITEMS c on c.cart_id = tr.cart_id
join COVEO_CORE_MODEL_V001.COMMON.INSIGHTS ins on ins.insight_id = c.insight_id
where date = :daterange
)

select distinct
       insight_type,
       sum(item_revenue) as total_revenue
from transaction_base
group by insight_type
order by total_revenue desc
limit 10
Top 10 query expressions
The following query creates a Snowflake dashboard tile that displays the top 10 query expressions that generated the most revenue.
|
|
Updates to the computation methods for this metric have been implemented. As a result, executing this SQL query may yield slightly different results from those shown in the Advanced Reports (platform-ca | platform-eu | platform-au) page of the Coveo Administration Console. A new version of this query, which aligns with the outcomes of the reports of the Advanced Reports page, will soon be available. |
with transaction_base as (
select distinct
       date(tr.transaction_timestamp) as date,
       query_expression,
       c.insight_id,
       ins.insight_type,
       tr.transaction_id,
       c.item_id,
       c.price*c.quantity as item_revenue
from COVEO_CORE_MODEL_V001.COMMERCE.TRANSACTIONS tr
join COVEO_CORE_MODEL_V001.COMMERCE.CART_ITEMS c on c.cart_id = tr.cart_id
join COVEO_CORE_MODEL_V001.COMMON.INSIGHTS ins on ins.insight_id = c.insight_id
where date = :daterange
and ins.insight_type = 'search'
)

select distinct
       query_expression,
       sum(item_revenue) as total_revenue
from transaction_base
group by query_expression
order by total_revenue desc
limit 10
When using the default query, your dashboard should look like the following:

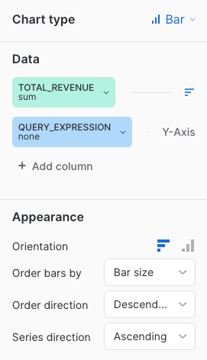
The Chart type, Data, and Appearance sections should look like the following. See Using charts for more information.
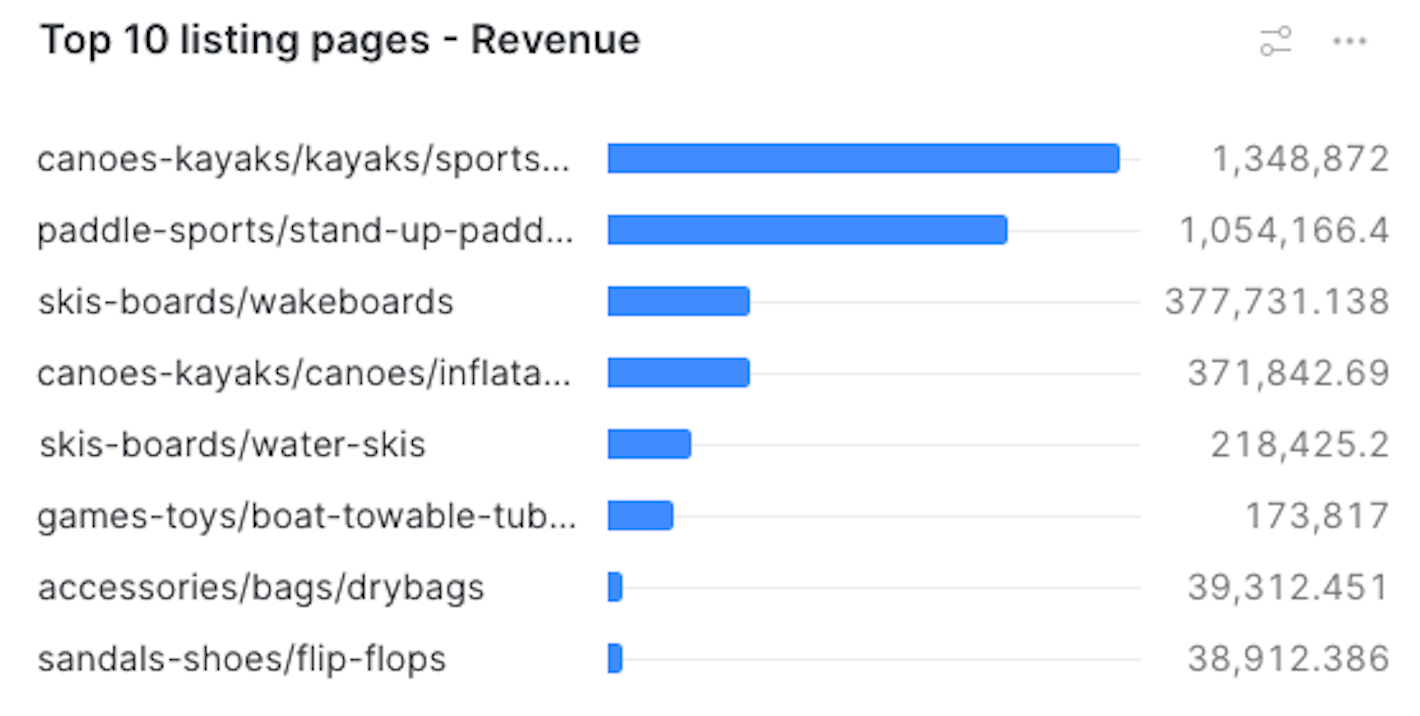
Top 10 product listing pages
The following query creates a Snowflake dashboard tile that displays the paths of the top 10 product listing pages that generated the most revenue.
|
|
Updates to the computation methods for this metric have been implemented. As a result, executing this SQL query may yield slightly different results from those shown in the Advanced Reports (platform-ca | platform-eu | platform-au) page of the Coveo Administration Console. A new version of this query, which aligns with the outcomes of the reports of the Advanced Reports page, will soon be available. |
with transaction_base as (
select distinct
       date(tr.transaction_timestamp) as date,
       ec_listing,
       c.insight_id,
       ins.insight_type,
       tr.transaction_id,
       c.item_id,
       c.price*c.quantity as item_revenue
from COVEO_CORE_MODEL_V001.COMMERCE.TRANSACTIONS tr
join COVEO_CORE_MODEL_V001.COMMERCE.CART_ITEMS c on c.cart_id = tr.cart_id
join COVEO_CORE_MODEL_V001.COMMON.INSIGHTS ins on ins.insight_id = c.insight_id
where date = :daterange
and ins.insight_type = 'listing'
)

select distinct
       ec_listing,
       sum(item_revenue) as total_revenue
from transaction_base
group by ec_listing
order by total_revenue desc
limit 10
When using the default query, your dashboard should look like the following:
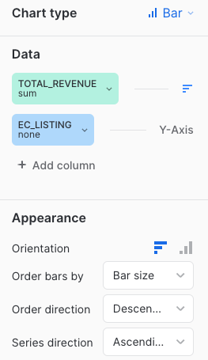
The Chart type, Data, and Appearance sections should look like the following. See Using charts for more information.
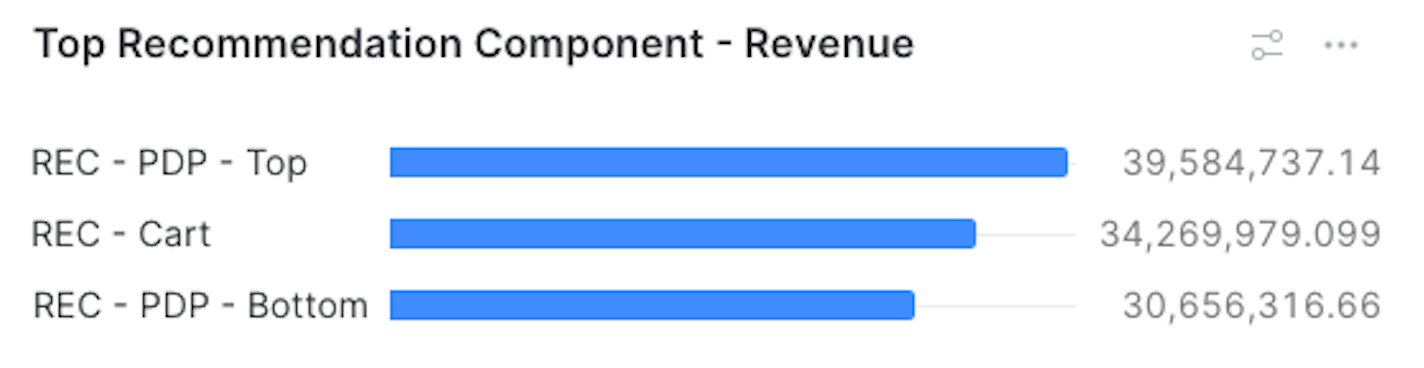
Top 10 recommendation components
The following query creates a Snowflake dashboard tile that displays the recommendation components that generated the most revenue.
|
|
Updates to the computation methods for this metric have been implemented. As a result, executing this SQL query may yield slightly different results from those shown in the Advanced Reports (platform-ca | platform-eu | platform-au) page of the Coveo Administration Console. A new version of this query, which aligns with the outcomes of the reports of the Advanced Reports page, will soon be available. |
with transaction_base as (
select distinct
       date(tr.transaction_timestamp) as date,
       origin as recommendation_component,
       c.insight_id,
       ins.insight_type,
       tr.transaction_id,
       c.item_id,
       c.price*c.quantity as item_revenue
from COVEO_CORE_MODEL_V001.COMMERCE.TRANSACTIONS tr
join COVEO_CORE_MODEL_V001.COMMERCE.CART_ITEMS c on c.cart_id = tr.cart_id
join COVEO_CORE_MODEL_V001.COMMON.INSIGHTS ins on ins.insight_id = c.insight_id
where date = :daterange
and ins.insight_type = 'recommendation'
)

select distinct
       recommendation_component,
       sum(item_revenue) as total_revenue
from transaction_base
group by recommendation_component
order by total_revenue desc
limit 10
When using the default query, your dashboard should look like the following:
The Chart type, Data, and Appearance sections should look like the following. See Using charts for more information.
