Conversion rate (CR)
Conversion rate (CR)
The sum of the completed sessions with at least one transaction, divided by the total number of completed sessions.
SUM (completed sessions with at least one transaction) / SUM (completed sessions)|
|
Notes
|
This article contains SQL queries to create Snowflake dashboard tiles to report on the following metrics:
To learn how you can create custom dashboards in Snowflake and use the queries listed in this section, see Create Snowflake dashboards.
CR per service
The following query creates a Snowflake dashboard tile that displays the CR earned by each Coveo service (that is, Searches, Product listings, and Recommendations).
set start_timestamp = '<START-DATE>'; -- The start date and time. Replace with the desired timestamp.
set end_timestamp = '<END-DATE>';   -- The end date and time. Replace with the desired timestamp.

with visits_insights as (
  select
    v.visit_id,
    ins.insight_type
  from
    COVEO_CORE_MODEL_V001.COMMON.VISITS v
    inner join COVEO_CORE_MODEL_V001.COMMON.INSIGHTS ins on v.visit_id = ins.visit_id
  where
    v.visit_end between $start_timestamp and $end_timestamp
    and ins.start_time :: date >= dateadd(day, -2, $start_timestamp :: date)
),
transaction_visits as (
  select
    distinct visit_id
  from
    COVEO_CORE_MODEL_V001.COMMERCE.TRANSACTIONS
  where
    transaction_timestamp between dateadd(day, -1, $start_timestamp :: date) and $end_timestamp
)
select
  vi.insight_type,
  round(
    div0(
      count(distinct tv.visit_id),
      count(distinct vi.visit_id)
    ) * 100,
    2
  ) as conversion_rate
from
  visits_insights vi
  left join transaction_visits tv on vi.visit_id = tv.visit_id
group by
  vi.insight_type
order by
vi.insight_type;-
Replace
<START-DATE>and<END-DATE>with the start and end dates of the period you want to analyze, in the ISO 8601 format. For example, to analyze data from January 1st, 2025 to January 31st, 2025, you would replace<START-DATE>with2025-01-01and<END-DATE>with2025-01-31.
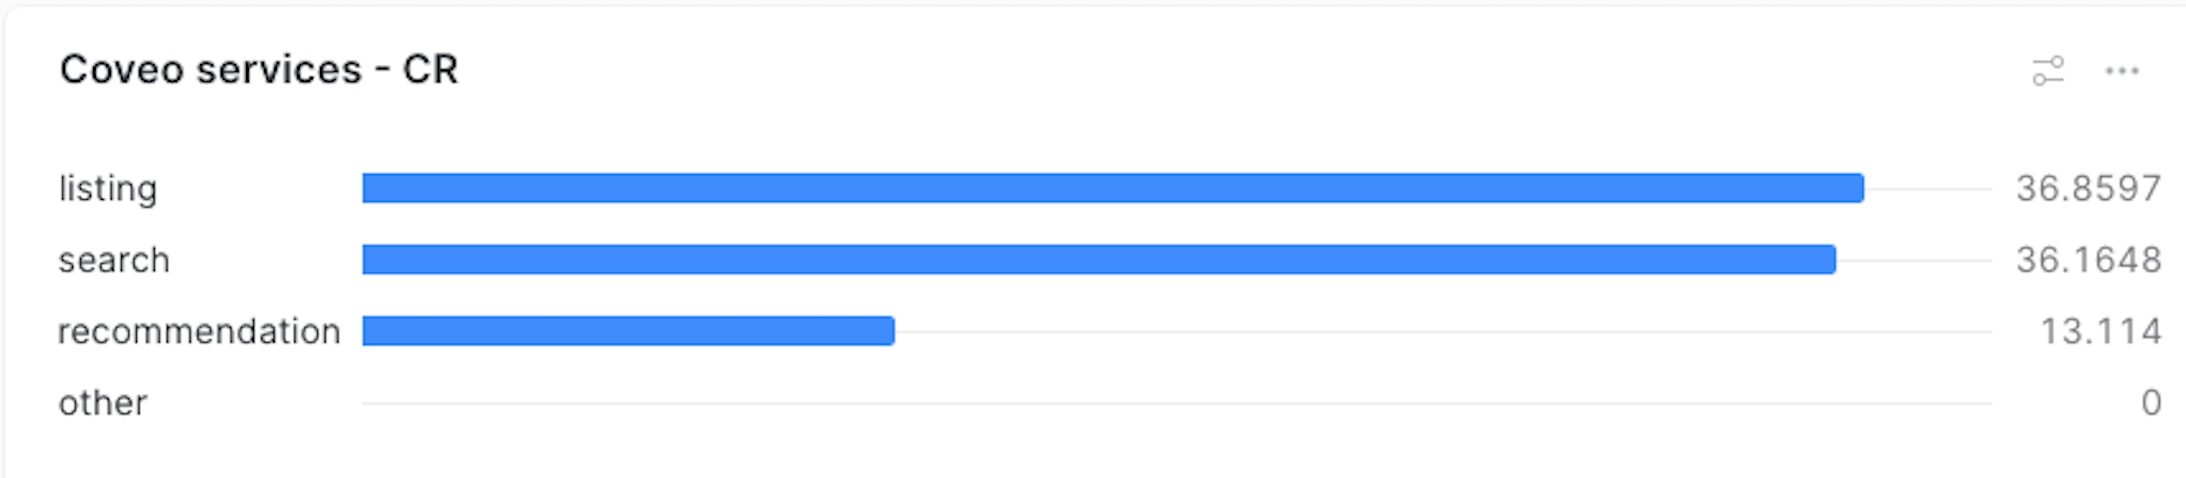
When using the default query, your dashboard should look like the following:
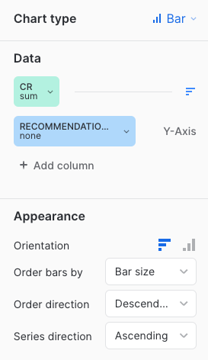
The Chart type, Data, and Appearance sections should look like the following. See Using charts for more information.
CR per service on a daily basis
The following query creates a Snowflake dashboard tile that displays the CR earned by each Coveo service (that is, Searches, Product listings, and Recommendations) on a daily basis.
set start_timestamp = '<START-DATE>'; -- The start date and time. Replace with the desired timestamp.
set end_timestamp = '<END-DATE>';   -- The end date and time. Replace with the desired timestamp.

with visits_insights as (
  select
    v.visit_id,
    date(v.visit_end) as date,
    ins.insight_type
  from
    COVEO_CORE_MODEL_V001.COMMON.VISITS v
    inner join COVEO_CORE_MODEL_V001.COMMON.INSIGHTS ins on v.visit_id = ins.visit_id
  where
    v.visit_end between $start_timestamp and $end_timestamp
    and ins.start_time :: date >= dateadd(day, -2, $start_timestamp :: date)
),
transaction_visits as (
  select
    distinct visit_id
  from
    COVEO_CORE_MODEL_V001.COMMERCE.TRANSACTIONS
  where
    transaction_timestamp between dateadd(day, -1, $start_timestamp :: date) and $end_timestamp
)
select
  vi.date,
  vi.insight_type,
  round(
    div0(
      count(distinct tv.visit_id),
      count(distinct vi.visit_id)
    ) * 100,
    2
  ) as conversion_rate
from
  visits_insights vi
  left join transaction_visits tv on vi.visit_id = tv.visit_id
group by
  vi.date,
  vi.insight_type
order by
  vi.date,
vi.insight_type;-
Replace
<START-DATE>and<END-DATE>with the start and end dates of the period you want to analyze, in the ISO 8601 format. For example, to analyze data from January 1st, 2025 to January 31st, 2025, you would replace<START-DATE>with2025-01-01and<END-DATE>with2025-01-31.
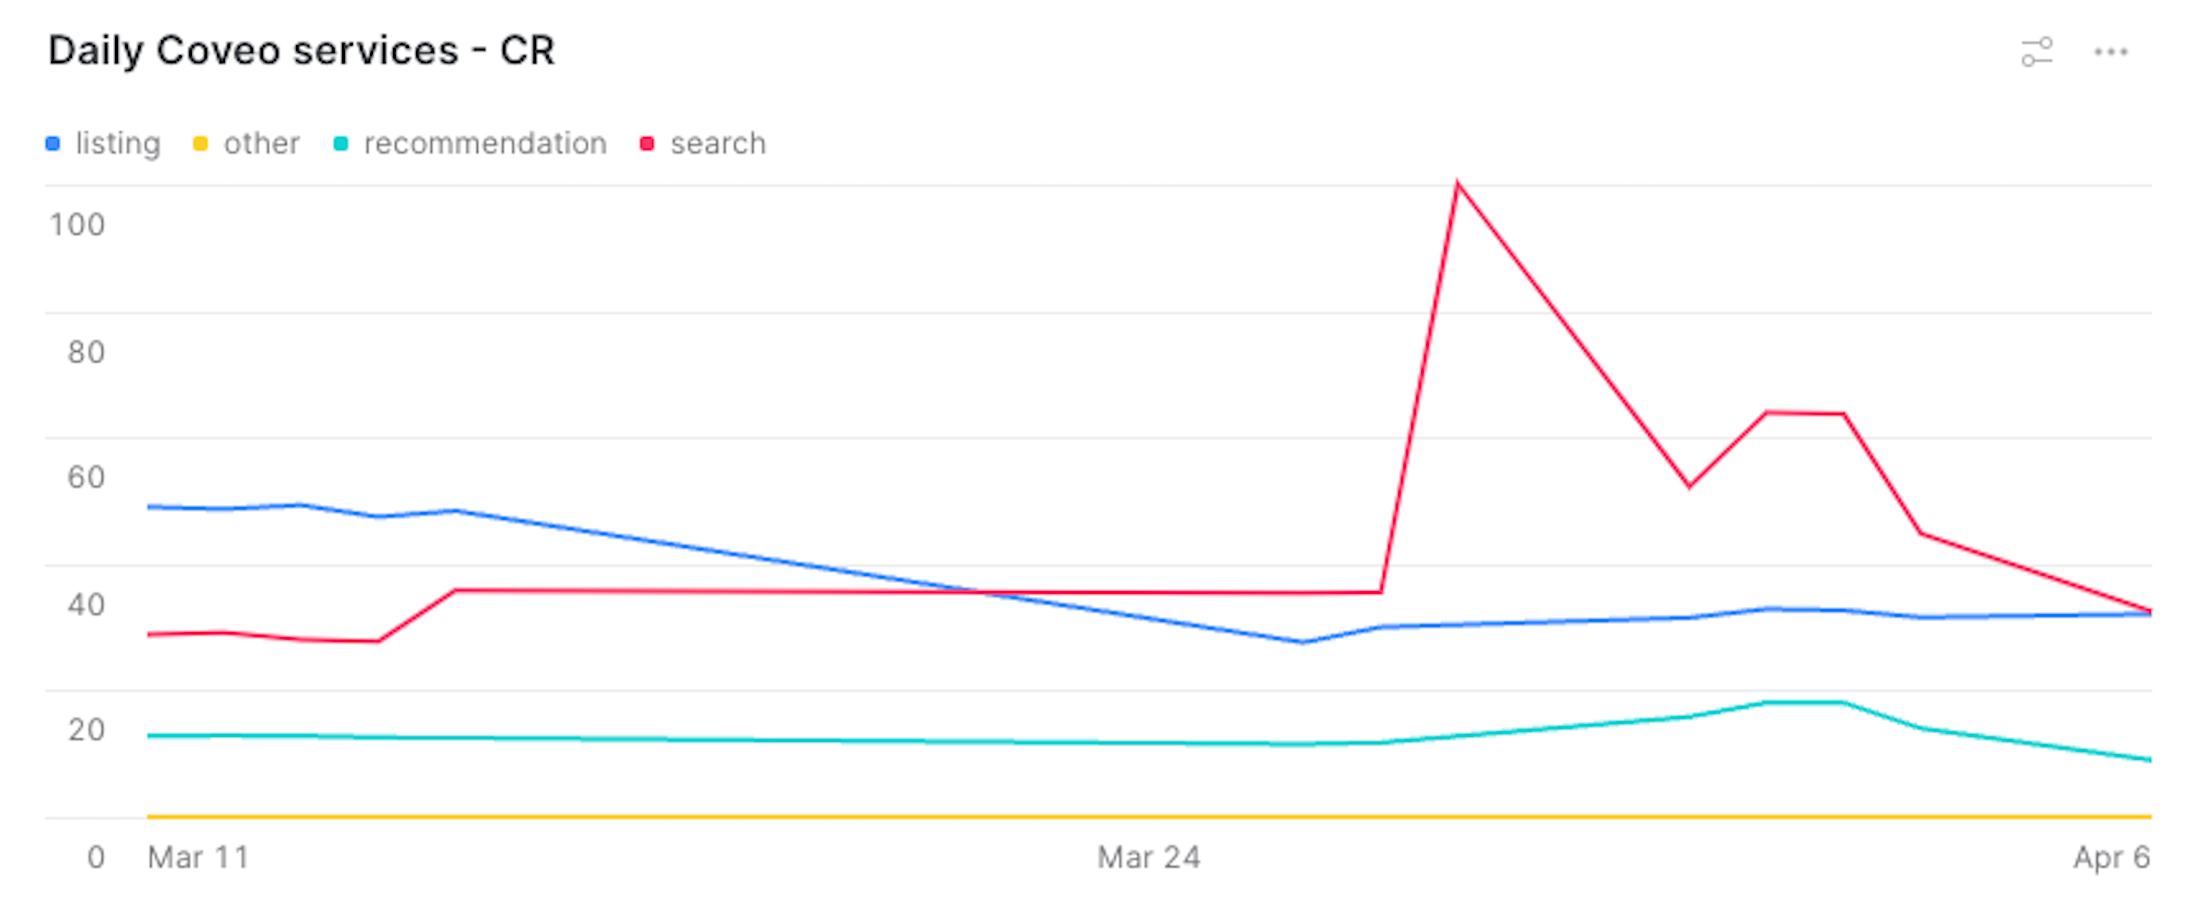
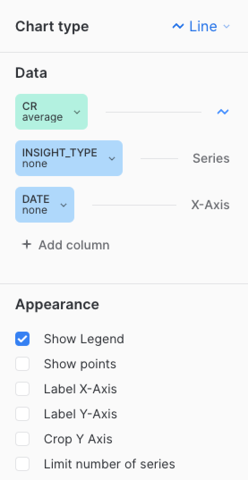
When using the default query, your dashboard should look like the following:
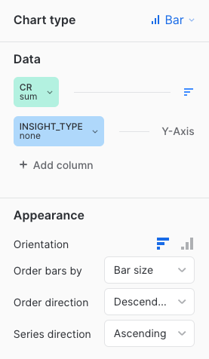
The Chart type, Data, and Appearance sections should look like the following. See Using charts for more information.
CR per component
The query in this section creates a Snowflake dashboard tile that reports on different Coveo service components.
|
|
Note
A Coveo service component refers to a specific instance exploited by a Coveo service. For example, you can have many components that leverage the Recommendation service:
In this case, the dashboard will report on these three different components. |
The following code sample serves as a base to get the CR metric for different Coveo components. You can add the required information to this generic version, according to the Coveo service component that you want to report on. However, the required information has been added to the sample queries in the following sections, so we recommend that you try one of them:
set start_timestamp = '<START-DATE>'; -- The start date and time. Replace with the desired timestamp.
set end_timestamp = '<END-DATE>';   -- The end date and time. Replace with the desired timestamp.

with visits_insights as (
  select
    v.visit_id,
    {COMPONENT}
  from
    COVEO_CORE_MODEL_V001.COMMON.VISITS v
    inner join COVEO_CORE_MODEL_V001.COMMON.INSIGHTS ins on v.visit_id = ins.visit_id
  where
    v.visit_end between $start_timestamp and $end_timestamp
    and ins.start_time :: date >= dateadd(day, -2, $start_timestamp :: date)
),
transaction_visits as (
  select
    distinct visit_id
  from
    COVEO_CORE_MODEL_V001.COMMERCE.TRANSACTIONS tr
  where
    transaction_timestamp between dateadd(day, -1, $start_timestamp :: date) and $end_timestamp
)
select
  vi.{COMPONENT},
  round(
    div0(
      count(distinct tv.visit_id),
      count(distinct vi.visit_id)
    ) * 100,
    2
  ) as conversion_rate
from
  visits_insights vi
  left join transaction_visits tv on vi.visit_id = tv.visit_id
group by
  vi.{COMPONENT}
order by
  vi.{COMPONENT};
Where you replace:
-
<START-DATE>and<END-DATE>with the start and end dates of the period you want to analyze, in the ISO 8601 format. For example, to analyze data from January 1st, 2025 to January 31st, 2025, you would replace<START-DATE>with2025-01-01and<END-DATE>with2025-01-31. -
{COMPONENT}depending on the service you want to report on:Coveo services Value to replace {COMPONENT}withsearchquery_expressionlistingec_listingrecommendationorigin as recommendation_component
Top 10 query expressions
The following query creates a Snowflake dashboard tile that displays the top 10 query expressions that generated the highest CR.
set start_timestamp = '<START-DATE>'; -- The start date and time. Replace with the desired timestamp.
set end_timestamp = '<END-DATE>';   -- The end date and time. Replace with the desired timestamp.

with visits_insights as (
  select
    distinct v.visit_id,
    lower(ins.query_expression) as query_expression
  from
    COVEO_CORE_MODEL_V001.COMMON.VISITS v
    inner join COVEO_CORE_MODEL_V001.COMMON.INSIGHTS ins on v.visit_id = ins.visit_id
  where
    v.visit_end between $start_timestamp and $end_timestamp
    and ins.start_time :: date >= dateadd(day, -2, $start_timestamp :: date) -- 48 hours
    and ins.insight_type = 'search'
    and nullif(query_expression, '') is not null
),
transaction_visits as (
  select
    distinct visit_id
  from
    COVEO_CORE_MODEL_V001.COMMERCE.TRANSACTIONS
  where
    transaction_timestamp between dateadd(day, -1, $start_timestamp :: date) and $end_timestamp
)
select
  vi.query_expression,
  round(
    div0(
      count(distinct tv.visit_id),
      count(distinct vi.visit_id)
    ) * 100,
    2
  ) as conversion_rate
from
  visits_insights vi
  left join transaction_visits tv on vi.visit_id = tv.visit_id
group by
  vi.query_expression
order by
  conversion_rate desc
limit
10;-
Replace
<START-DATE>and<END-DATE>with the start and end dates of the period you want to analyze, in the ISO 8601 format. For example, to analyze data from January 1st, 2025 to January 31st, 2025, you would replace<START-DATE>with2025-01-01and<END-DATE>with2025-01-31.
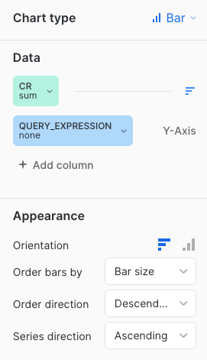
When using the default query, your dashboard should look like the following:
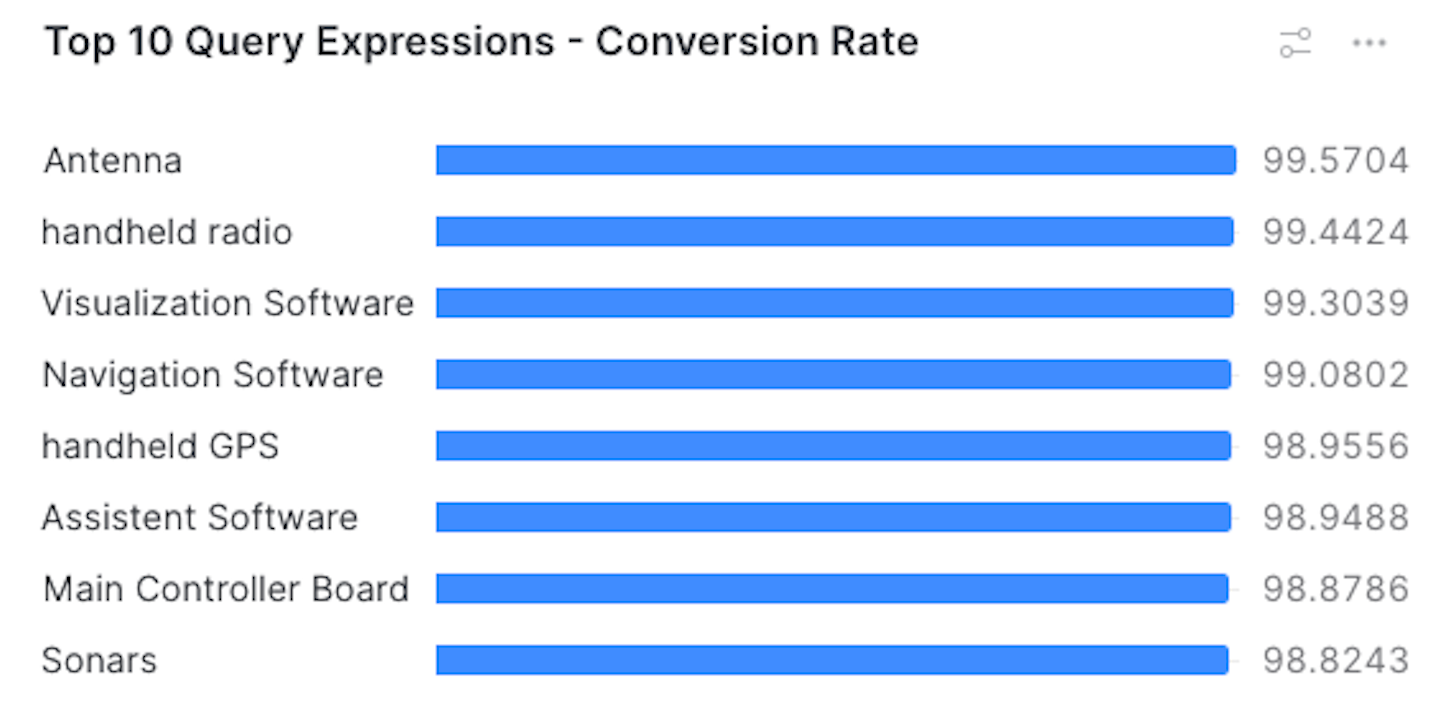
The Chart type, Data, and Appearance sections should look like the following. See Using charts for more information.
Top 10 product listing pages
The following query creates a Snowflake dashboard tile that displays the paths of the top 10 product listing pages that generated the highest CR.
set start_timestamp = '<START-DATE>'; -- The start date and time. Replace with the desired timestamp.
set end_timestamp = '<END-DATE>';   -- The end date and time. Replace with the desired timestamp.

with visits_insights as (
  select
    distinct v.visit_id,
    con.name as ec_listing
  from
    COVEO_CORE_MODEL_V001.COMMON.VISITS v
    inner join COVEO_CORE_MODEL_V001.COMMON.INSIGHTS ins on v.visit_id = ins.visit_id
    inner join COVEO_CORE_MODEL_V001.COMMERCE.CONFIGS con on con.config_id = ins.config_id
  where
    v.visit_end between $start_timestamp and $end_timestamp
    and ins.start_time :: date >= dateadd(day, -2, $start_timestamp :: date)
    and ins.insight_type = 'listing'
),
transaction_visits as (
  select
    distinct visit_id
  from
    COVEO_CORE_MODEL_V001.COMMERCE.TRANSACTIONS
  where
    transaction_timestamp between dateadd(day, -1, $start_timestamp :: date) and $end_timestamp
)
select
  vi.ec_listing,
  round(
    div0(
      count(distinct tv.visit_id),
      count(distinct vi.visit_id)
    ) * 100,
    2
  ) as conversion_rate
from
  visits_insights vi
  left join transaction_visits tv on vi.visit_id = tv.visit_id
group by
  vi.ec_listing
order by
  conversion_rate desc
limit
10;-
Replace
<START-DATE>and<END-DATE>with the start and end dates of the period you want to analyze, in the ISO 8601 format. For example, to analyze data from January 1st, 2025 to January 31st, 2025, you would replace<START-DATE>with2025-01-01and<END-DATE>with2025-01-31.
When using the default query, your dashboard should look like the following:
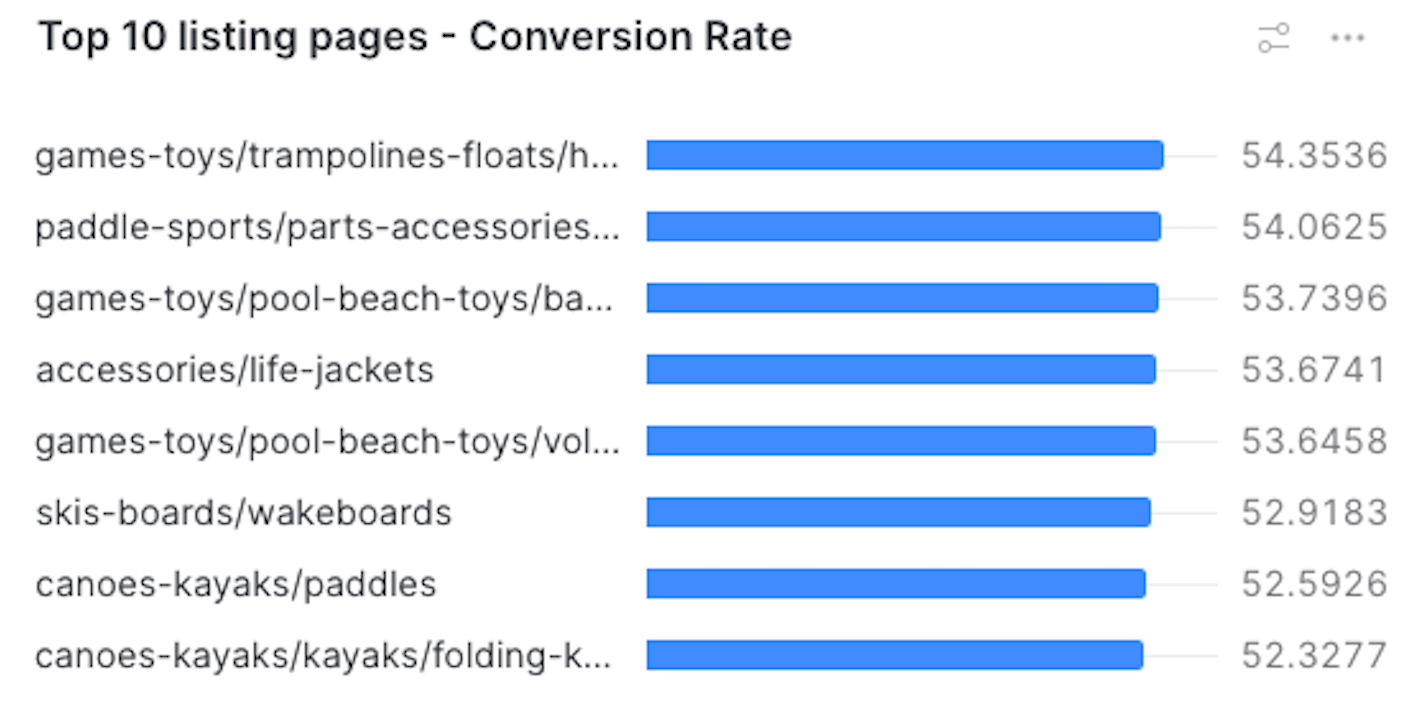
The Chart type, Data, and Appearance sections should look like the following. See Using charts for more information.
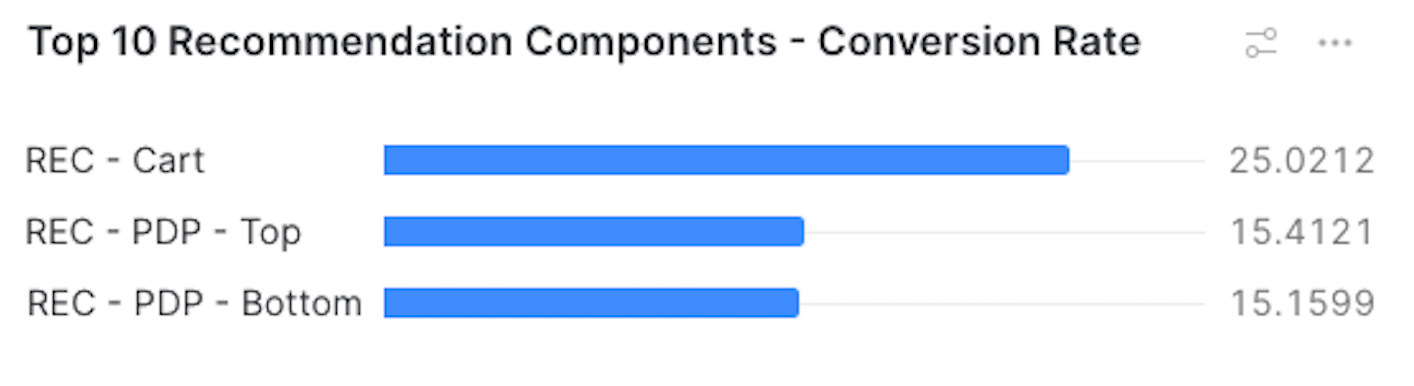
Top 10 recommendation components
The following query creates a Snowflake dashboard tile that displays the recommendation components that generated the highest CR.
set start_timestamp = '<START-DATE>'; -- The start date and time. Replace with the desired timestamp.
set end_timestamp = '<END-DATE>';   -- The end date and time. Replace with the desired timestamp.

with visits_insights as (
  select
    distinct v.visit_id,
    ins.origin as recommendation_component
  from
    COVEO_CORE_MODEL_V001.COMMON.VISITS v
    inner join COVEO_CORE_MODEL_V001.COMMON.INSIGHTS ins on v.visit_id = ins.visit_id
  where
    v.visit_end between $start_timestamp and $end_timestamp
    and ins.start_time :: date >= dateadd(day, -2, $start_timestamp :: date)
    and ins.insight_type = 'recommendation'
),
transaction_visits as (
  select
    distinct visit_id
  from
    COVEO_CORE_MODEL_V001.COMMERCE.TRANSACTIONS
  where
    transaction_timestamp between dateadd(day, -1, $start_timestamp :: date) and $end_timestamp
)
select
  vi.recommendation_component,
  round(
    div0(
      count(distinct tv.visit_id),
      count(distinct vi.visit_id)
    ) * 100,
    2
  ) as conversion_rate
from
  visits_insights vi
  left join transaction_visits tv on vi.visit_id = tv.visit_id
group by
  vi.recommendation_component
order by
  conversion_rate desc
limit
10;-
Replace
<START-DATE>and<END-DATE>with the start and end dates of the period you want to analyze, in the ISO 8601 format. For example, to analyze data from January 1st, 2025 to January 31st, 2025, you would replace<START-DATE>with2025-01-01and<END-DATE>with2025-01-31.
When using the default query, your dashboard should look like the following:
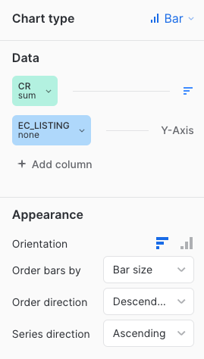
The Chart type, Data, and Appearance sections should look like the following. See Using charts for more information.