Create custom Snowflake commerce dashboards
Create custom Snowflake commerce dashboards
The Coveo Platform uses the Snowflake Database to store all Coveo Analytics data.
Depending on whether you already have a Snowflake account or not, Coveo offers the Data Share and the Snowflake reader account features to access your data in the Snowflake ecosystem. The following table indicates which Coveo features you should use to access your data in Snowflake:
| When you already have a Snowflake account | When you don’t have a Snowflake account |
|---|---|
You can use the Data Share feature of the Coveo Administration Console to integrate your Coveo data to your Snowflake instance. |
You can use the Snowflake reader account to access your data in Snowflake. |
The articles in this section provide guidelines and SQL queries to help you build relevant dashboards allowing you to report on the key commerce metrics directly on Snowflake.
More specifically, these dashboards will help you get insights on the value brought by the different Coveo commerce services (that is, Search, Listings, and Recommendations) and related components.
|
|
Note
To learn more about the different commerce-related views that are available in Snowflake, see COMMERCE schema reference. |
|
|
Aligning Snowflake results with other reporting surfaces
The SQL queries in this section use The queries don’t filter out For more details about how each reporting surface processes data, see the Discrepancies between reports section in any of the Advanced Reports dashboard articles (for example, Search dashboard). |
Create dashboards in Snowflake
To use the guidelines and queries contained in the articles from this section, first create empty dashboards in Snowflake:
-
In Snowflake, create a new empty dashboard.
-
Once the dashboard is created, you must set the environment so that your queries can return results. To do so, select a role (that has the privileges required to create dashboards in Snowflake) and a warehouse in the Context selector.
-
Once the proper role and warehouse are selected, click Add tile (+) to create a tile where you’ll be able to add and edit the queries provided in the articles from this section. See Using dashboards for reference information on how to manage dashboards in Snowflake.
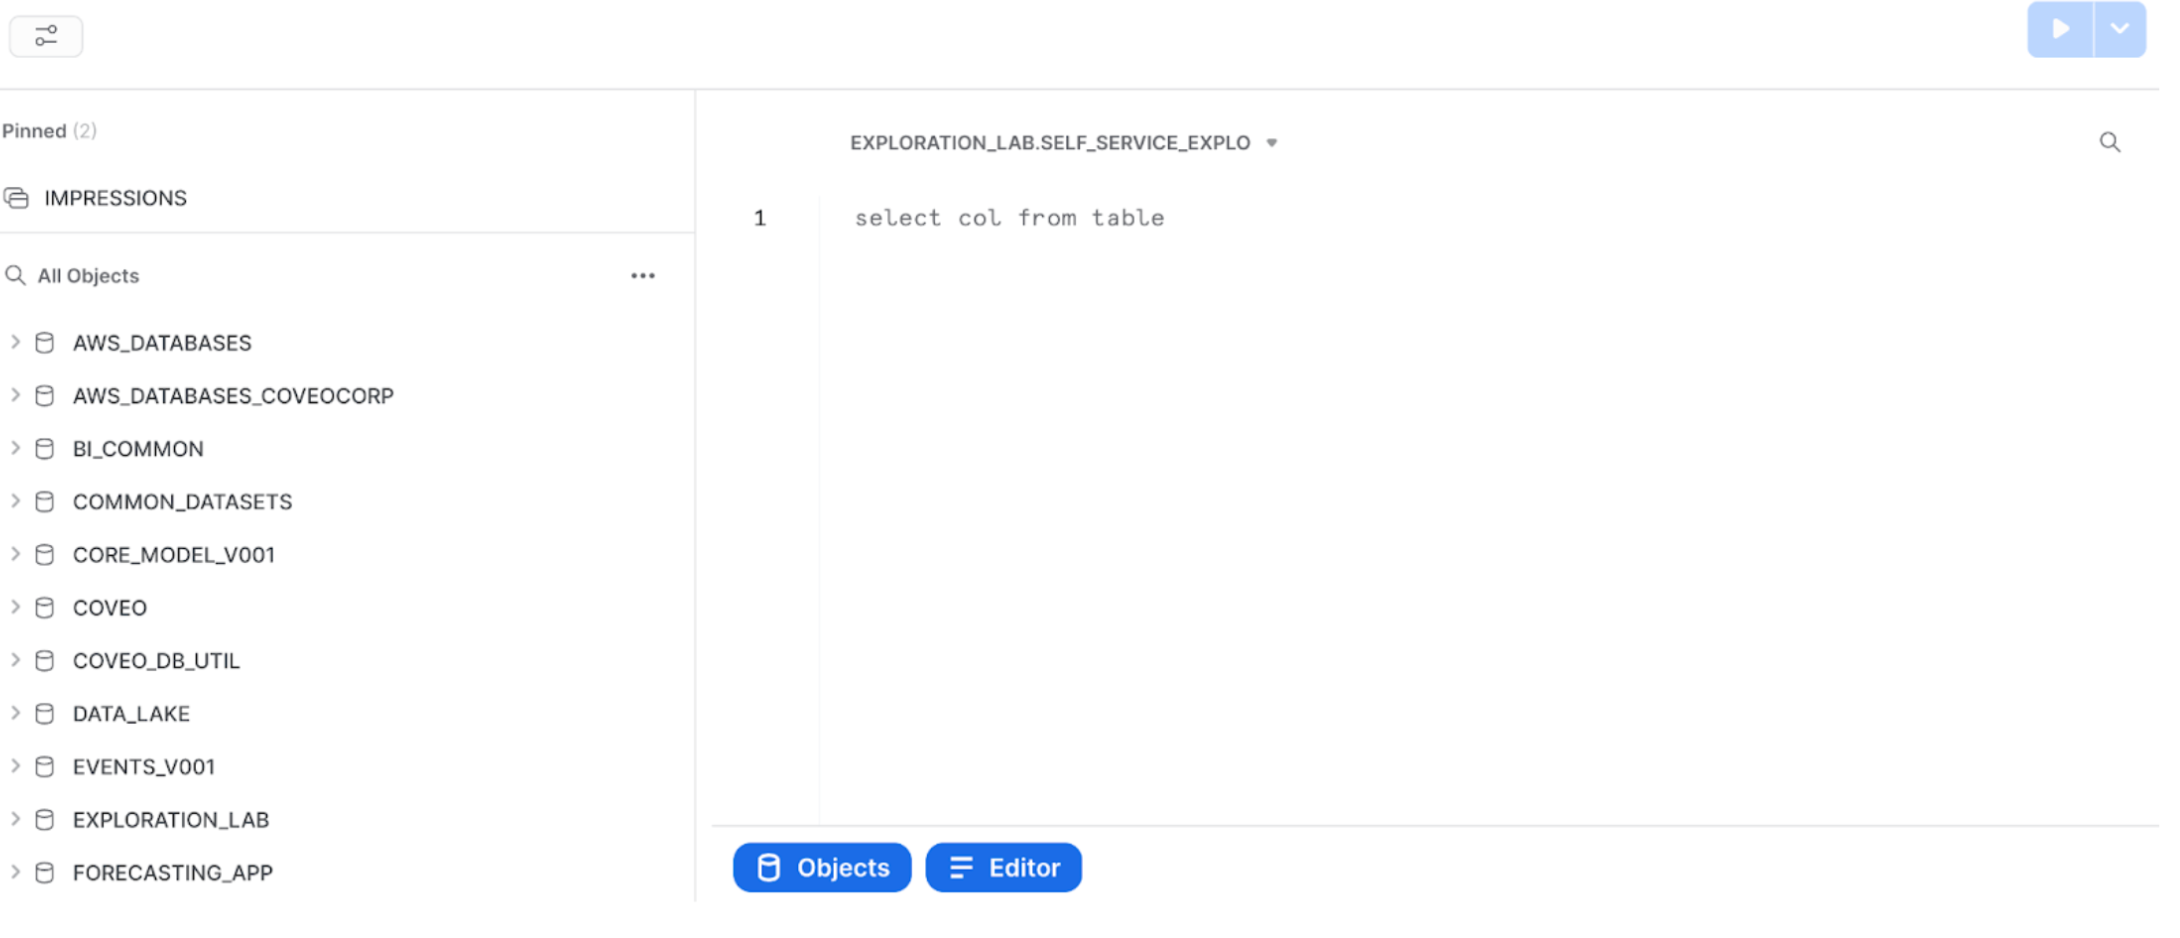
This will create a tile containing three sections:
-
On the left side you can see all the databases, schemas, tables, and views you have access to.
-
The central worksheet lets you write and edit the queries provided in the articles from this section.
-
The play button lets you run the query entered in the central worksheet.
-
-
When you entered a query that targets a specific database, schema, table, or view, and that you hit play to run the query, you can use the Chart feature to format the data returned by the query.
To do so, click Chart and then find the chart that’s more appropriate to format your data.
 Note
NoteThe Snowflake Chart feature displays the most relevant visualization by default. However, you can choose a different one by clicking Chart type. Any modification will appear on your dashboard when you close the tile.
Add filters
You can optionally add filters to your dashboards to further scope the query results.
To add a filter
-
In the query you entered in the central worksheet, you must add a
whereclause followed by the field you want to use as a filter.For example, in the following query,
where date = :daterangeadds a date range filter to the average order value per service dashboard.with revenue_normalization as ( select distinct tr.organization_id, date(tr.transaction_timestamp) as date, c.insight_id, ins.insight_type, tr.transaction_id, c.item_id, c.price*c.quantity as item_revenue, try_to_number(round(coalesce(tr.base_total, tr.total),3),38,3) as trans_total, sum(item_revenue) over (partition by tr.organization_id, tr.transaction_id) as total_revenue, round(div0(trans_total, total_revenue) * item_revenue, 3) as normalized_revenue from COVEO_CORE_MODEL_V001.COMMERCE.TRANSACTIONS tr join COVEO_CORE_MODEL_V001.COMMERCE.CART_ITEMS c on c.cart_id = tr.cart_id join COVEO_CORE_MODEL_V001.COMMON.INSIGHTS ins on ins.insight_id = c.insight_id where date = :daterange )
select distinct
rn.insight_type,
sum(rn.normalized_revenue) / count(distinct rn.transaction_id) as aov
from revenue_normalization rn
group by rn.insight_type
)
select distinct
rn.insight_type,
sum(rn.normalized_revenue) / count(distinct rn.transaction_id) as aov
from revenue_normalization rn
group by rn.insight_type -
When clicking play to run the query, an error message will state that you must choose a value for your filter. You can do so by selecting the filter in the upper-left corner of your worksheet.
|
|
Notes
|
Metrics
Click the metric you want to explore to access the related queries: