Review trends in Coveo for Commerce Advanced Reports
Review trends in Coveo for Commerce Advanced Reports
On the Advanced Reports (platform-ca | platform-eu | platform-au) page of the Coveo Administration Console, you can access the commerce dashboards. These dashboards contain metrics that help you better understand the performance of your ecommerce site and how it’s impacted by your Coveo implementation. With the required privileges, you can use these dashboards to analyze the role that each metric plays in contributing to the total revenue.
Access the dashboards
On the Advanced Reports (platform-ca | platform-eu | platform-au) page, you’ll see several dashboards listed for your Coveo organization.
Click one of the following dashboards, and then click Open:
Set date intervals to review data comparison
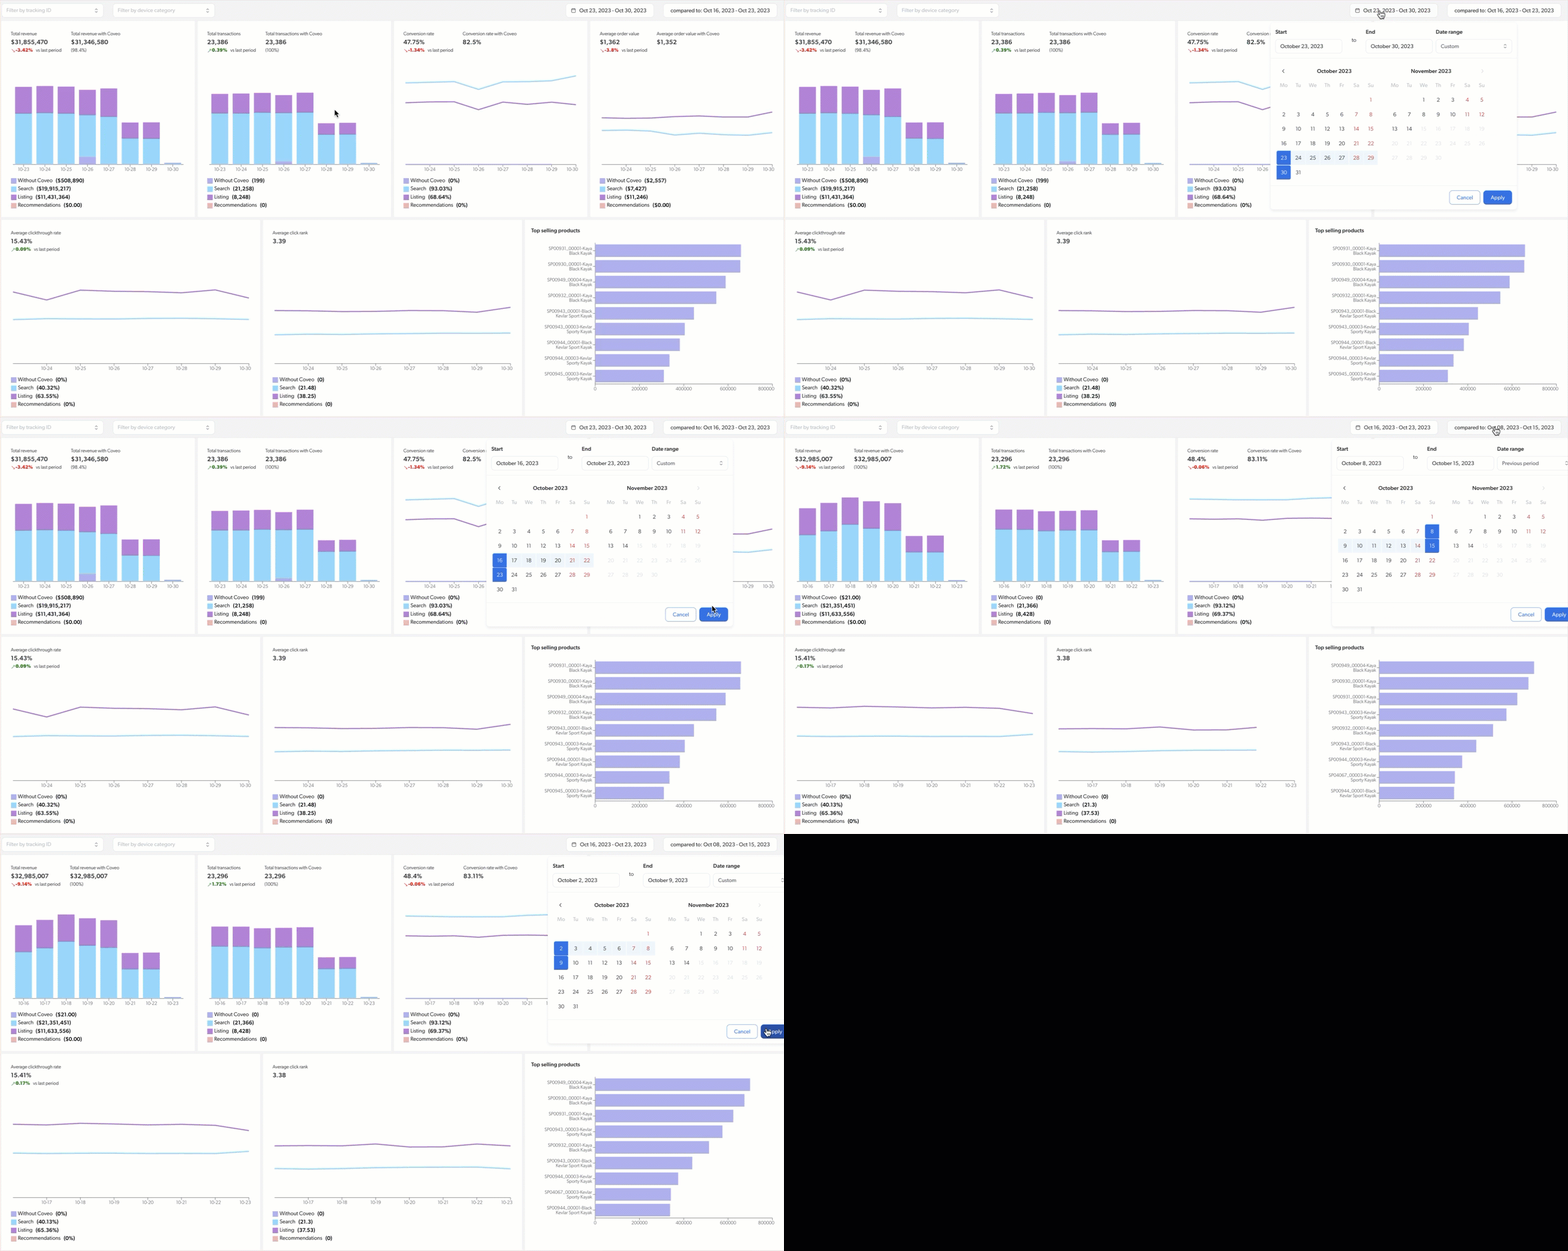
When reviewing data in the Overview dashboard, you can use the date picker to compare data trends between different periods.

-
In the upper-right corner of the dashboard, click the first date picker to select the date range corresponding to the period you want to review, and then click Apply.
-
In the second date picker, select the date range corresponding to the period you want to compare to the first one, and then click Apply.
Add filters to refine view
You can use the filter feature to filter the data displayed in the dashboard by available tracking ID or device category.

-
In the upper-left corner of the dashboard, depending on whether you want to add a tracking ID or device category filter, click either Filter by tracking ID or Filter by device category.
-
Select a value.
Required privileges
As with any other Administration Console feature, you can only access the Advanced Reports (platform-ca | platform-eu | platform-au) page of the Coveo Administration Console if you have the privileges to do so.
If you don’t have these privileges, anyone from the Administrators built-in group can grant them to you.
The required privileges are:
| Action | Service - Domain | Required access level |
|---|---|---|
View Advanced Reports |
Analytics - Analytics data Analytics - Reports Analytics - Dimensions Analytics - Named filters Organization - Organization |
View |