Product listing dashboard
Product listing dashboard
- What is a session?
- What is a product listing event?
- What is product listing attribution?
- Revenue from product listings chart
- Transactions from product listings chart
- Conversion rate from product listings chart
- Average order value influenced by product listings chart
- Average clickthrough rate chart
- Average click rank chart
- Total product listing events chart
- Top selling products chart
- Discrepancies between reports
The Product listing dashboard on the Advanced Reports (platform-ca | platform-eu | platform-au) page provides an in-depth view of the top-performing product listing pages (PLPs). As in the Overview dashboard, you can view basic metrics such as revenue, conversion rate, clickthrough rate, and more. However, the Product listing dashboard emphasizes product listing attribution.
What is a session?
Although sessions aren’t specifically listed in the Product listing dashboard, they’re often used to calculate the metrics listed there.
At Coveo, a session starts with the first event a visitor generates and ends after 30 minutes of inactivity. For a given visitor, if a new event is generated after 30 minutes of inactivity, it results in a new session with a new visit ID.
To be considered Coveo-related, the session must contain search, product listing, or recommendation actions.
What is a product listing event?
In this article, the term product listing event is often used in metric definitions to simplify the explanation. However, this isn’t an official Coveo Analytics event type.
The definition of a product listing event varies depending on whether your Coveo for Commerce implementation targets the Commerce API or the Search API. Expand the following sections to learn about product listing events based on the Coveo API your implementation targets:
Commerce API
A product listing event is triggered when a request is made to the listing endpoint of the Commerce API.
Search API
In practice, a product listing event is a search event that’s triggered when a product listing page (PLP) loads.
This happens when a query is made to the Search API to retrieve the products to display on the page.
To trigger a product listing event, the query must contain the word listing in the searchHub query parameter.
What is product listing attribution?
 Coveo attributes a product in a transaction to the Product listing product discovery solution if the visitor’s last registered click action before purchasing the product was selecting it on a product listing page (PLP).
For more details about how attribution is tracked for the Product listing solution, see About product listing attribution.
The Product listing dashboard shows how Coveo-powered product listing pages (PLPs) have contributed to your key commerce metrics.
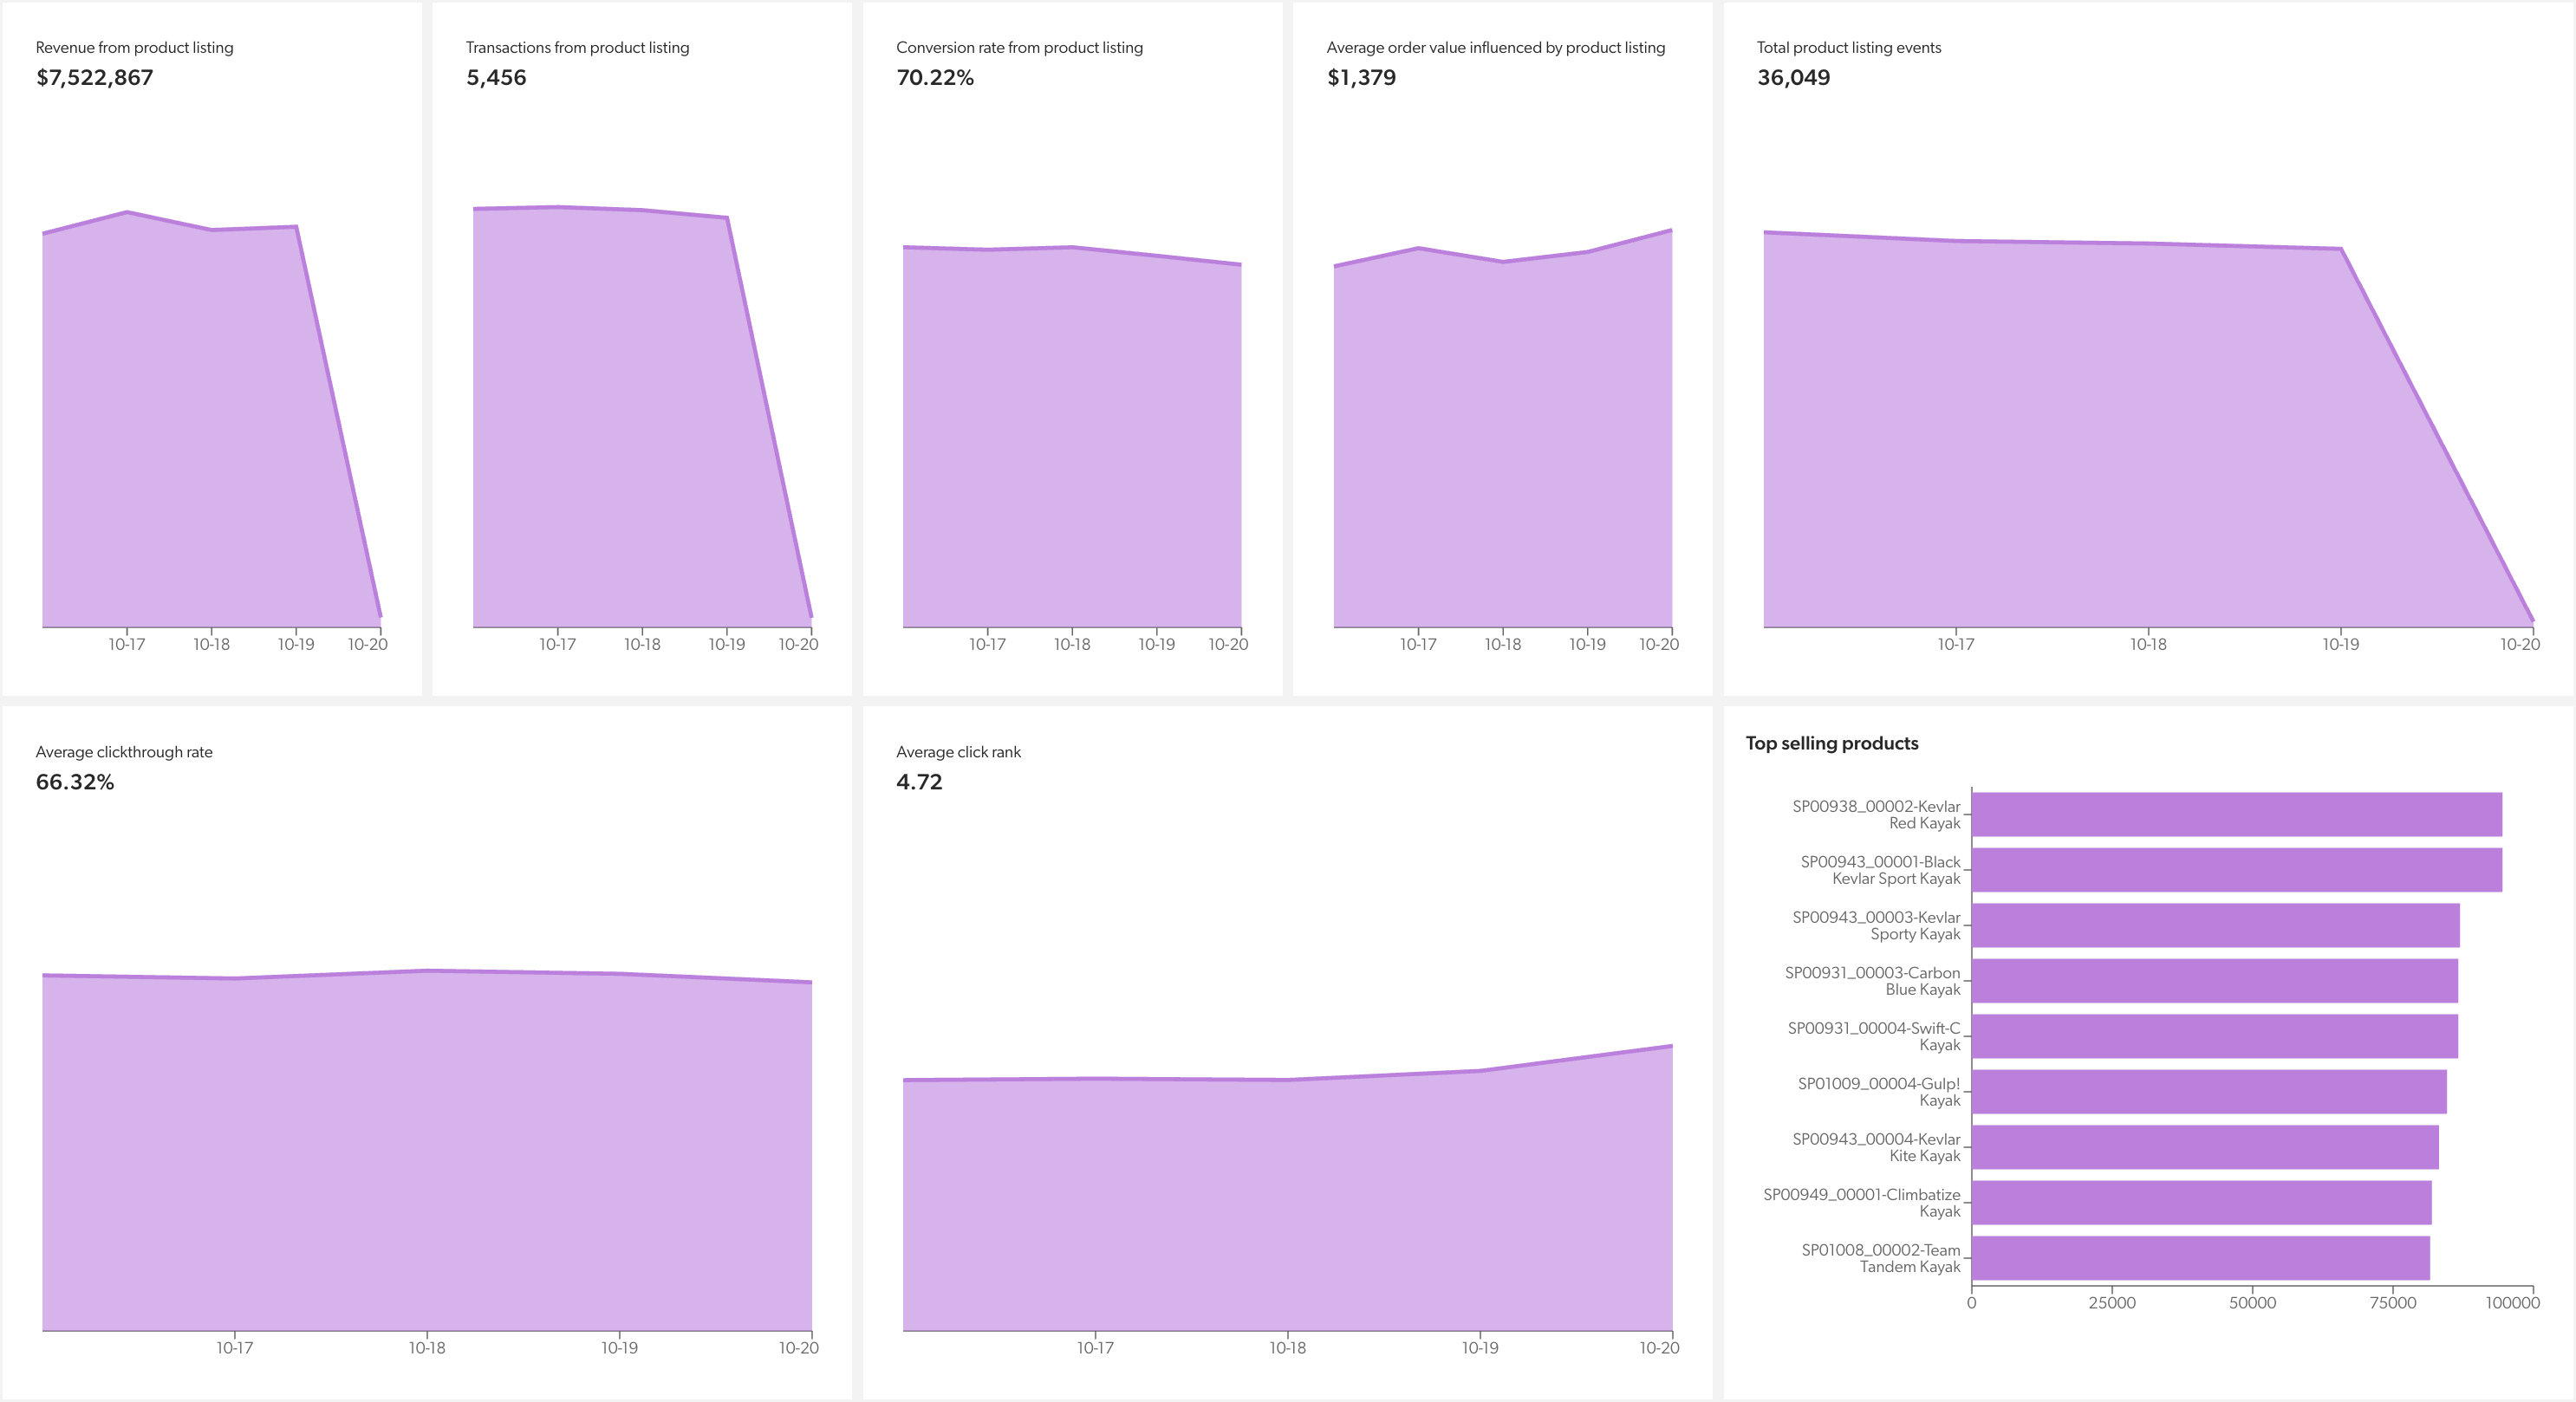
Revenue from product listings chart
The Revenue from product listings chart displays the sum of the gross revenue influenced by Coveo product listing pages (PLPs) that occurred within the chosen filters.
The line graph delineates the revenue variance over a specific period of time.
How is the revenue from product listings calculated?
Expand the following sections to learn how the revenue from product listings is calculated, based on whether you’re tracking events using the Coveo Event protocol or the Coveo UA protocol:
Event protocol
The sum of the gross revenue (from the transaction property) from every product sold in each purchase event that was attributed to product listing events.
SUM (gross revenue attributed to Coveo product listing pages)Coveo UA
The sum of the gross revenue from every product sold in each purchase event that was attributed to product listing events.
SUM (gross revenue attributed to Coveo product listing pages)|
|
Note
Revenue is reported in
The Top selling products metric displays net revenue figures. All other reported revenue metrics use gross revenue, unless otherwise stated. See About revenue for more information on how the revenue metrics are calculated. |
Transactions from product listings chart
Expand the following sections to learn about the Transactions from product listings chart based on the tracking method you use:
Event protocol
The Transactions from product listings chart displays the total number of purchase events influenced by Coveo product listing pages (PLPs) that occurred within the chosen filters.
The line graph delineates the variance of the purchase events over a specific period of time.
Coveo UA
The Transactions from product listings chart displays the total number of purchase events influenced by Coveo product listing pages (PLPs) that occurred within the chosen filters.
The line graph delineates the variance of the purchase events over a specific period of time.
How are transactions from product listings calculated?
Expand the following sections to learn how transactions from product listings are calculated, based on the tracking method you use:
Event protocol
The total number of purchase events attributed to product listing events.
See Capture purchase events for more information on how purchase events are logged and measured.
SUM (purchase events attributed to Coveo product listing pages)Coveo UA
The total number of commerce events that contain the purchase action and are attributed to product listing events.
See Capture a purchase event for more information on how purchase events are logged and measured.
SUM (commerce events with action = purchase attributed to Coveo product listing pages)Conversion rate from product listings chart
The Conversion rate from product listings chart displays the sum of the completed sessions that involved Coveo product listing pages (PLPs) with at least one transaction, divided by the sum of completed sessions that involved Coveo product listing pages (PLPs), within the chosen filters.
The line graph delineates the variance of the rate over a specific period of time.
How is the conversion rate from product listings calculated?
The sum of the completed sessions involving Coveo product listing pages (PLPs) with at least one transaction, divided by the sum of the completed sessions with at least one Coveo product listing event, multiplied by 100.
SUM (completed sessions involving Coveo product listing pages with at least one transaction) / SUM (completed sessions involving Coveo product listing pages) * 100Average order value influenced by product listings chart
The Average order value influenced by product listings chart displays the average gross revenue per transaction influenced by Coveo product listing pages (PLPs) that occurred within the chosen filters.
The line graph delineates the variance of the average over a specific period of time.
How is the average order value influenced by product listings calculated?
The sum of the gross revenue attributed to product listing events, divided by the total number of transactions attributed to product listing events.
SUM (gross revenue attributed to Coveo product listing pages) / SUM (transactions attributed to Coveo product listing pages)Average clickthrough rate chart
The Average clickthrough rate chart displays the ratio between the number of product listing events that were followed by at least one related click event, out of the total number of product listing events, within the chosen filters.
The line graph delineates the variance of the average clickthrough rate over a specific period of time.
How is the average clickthrough rate calculated?
The sum of product listing events that were followed by at least one click event (with a matching unique identifier value), divided by the total number of product listing events.
SUM (product listing events followed by a click event) / SUM (product listing events)Average click rank chart
|
|
A lower click rank is better, because it means that the product was well positioned. |
The Average click rank chart displays the average position of clicked products on a product listing page (PLP), within the chosen filters.
The line graph delineates the variance of the average click rank over a specific period of time.
How is the average click rank calculated?
The average position value for all click events that followed a product listing event.
SUM (position values for all click events that followed a product listing event) / SUM (click events that followed a product listing event)Total product listing events chart
The Total product listing events chart displays the total number of product listing events, within the chosen filters.
The line graph delineates the variance of the total over a specific period of time.
SUM (product listing events)Top selling products chart
A list of the top ten products or product groups on product listing pages (PLPs) that generated the most net revenue, within the chosen filters.
How are top selling products calculated?
The products or product groups contained in click events that followed a product listing event to which a purchase was attributed and that generated the most net revenue.
Discrepancies between reports
Figures shown for metrics in the Commerce Advanced Reports may differ from those for the same metrics in the Reports (platform-ca | platform-eu | platform-au) page of the Coveo Administration Console and Coveo Merchandising Hub (CMH) reports, because each report type applies different filters and processing rules.
| Behavior | Administration Console reports | Commerce Advanced Reports | CMH Overview | CMH Search manager reports |
|---|---|---|---|---|
|
Included |
Included |
Included |
Excluded |
|
Included |
Included |
Included |
Excluded |
|
Included |
Excluded |
Excluded |
Excluded |
|
Included |
Excluded |
Excluded |
Excluded |
Query case normalization |
Case-sensitive |
Case-insensitive |
Case-insensitive |
Case-insensitive |
Timezone |
UTC |
Browser timezone |
Browser timezone |
Browser timezone |
The main drivers of discrepancies between report types are:
-
searchboxAsYouTypeevent handling: Report types differ in whether they count search events where the event cause issearchboxAsYouType:-
Administration Console reports include these events in all metrics.
-
Commerce Advanced Reports and Coveo Merchandising Hub (CMH) Overview reports include them in search counts and revenue, but exclude them from clickthrough rate and average click rank to avoid diluting click-based metrics with product suggestion events.
-
Coveo Merchandising Hub (CMH) Search manager reports exclude them from all metrics to remove noise from product suggestions.
This means Search manager reports show lower search counts and revenue than other report types. If your implementation includes product suggestions in the search box, revenue may also differ between Coveo Merchandising Hub (CMH) Overview and Search manager reports.
-
-
Query case normalization: Commerce Advanced Reports and Coveo Merchandising Hub (CMH) reports normalize queries to lowercase, so "shoes", "Shoes", and "SHOES" are counted as one query. Administration Console reports may count them separately.
-
Timezone: Administration Console reports use UTC. Commerce Advanced Reports and Coveo Merchandising Hub (CMH) reports use the browser’s local timezone, which can shift daily totals near day boundaries.