Get opinions results
Get opinions results
Getting started
To open the Opinions dashboard, select Data tools and Opinions from the side menu.
Understanding the dashboard
After opening Opinions you will be presented with a dashboard that provides a summary of all of the feedback received for you property, which includes:
-
A histogram, showing the distribution of feedback starting from the point when Qubit started receiving data from your property
-
A feedback count and heatmap
-
Details of each piece of feedback
-
Feedback topic categorization
Changing the reporting period
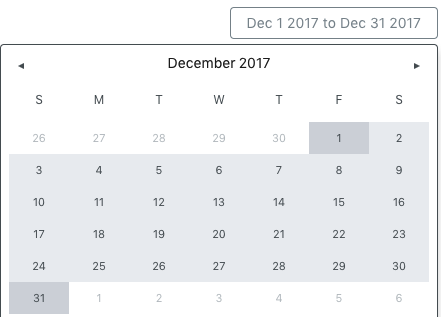
By default, the reporting period is the last 7 days, but you can change this by selecting a time period in the upper-right hand corner of the page. In the following example, the user has chosen to review the feedback between 1 December and 31 December:
Reviewing the heat map to understand the volume and sentiment of feedback topics
To help you understand the feedback sentiment, topics, and associated volume, we present your feedback data in a heatmap. The heatmap corresponds to the selected reporting period.
The following points will guide you in the use of the heatmap:
-
The bigger the box, the more feedback of that topic type was submitted
-
The shading applied to each topic indicates the aggregated sentiment for that topic
-
Overall positive sentiment is represented by colors in the green palette, with light green indicating mostly positive sentiment, and dark green indicating positive sentiment
-
Overall neutral sentiment, where the positivity for a topic matches the negativity, is represented by yellow
-
Overall negative sentiment is represented by colors in the orange-red palette, with light orange indicating mostly negative sentiment, and red indicating negative sentiment
In the following example, we can see the range of colors used to indicate the overall sentiment for the range of feedback topics:

Filtering feedback results
In addition to filtering feedback by a time period, there are further options that you can use to filter results to focus in on a particular feedback topic or visitor type.
Filter by topics
By selecting a topic in the heatmap, you can filter your results to only show the feedback that corresponds to that topic.
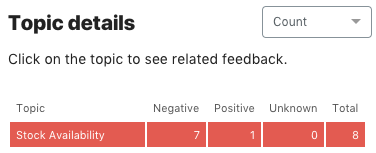
In the following example, the user has chosen to filter by Stock Availability:

When you select a topic, we highlight the topic in the table of results shown in the Topic details panel:
and only show the details of feedback that correspond to this topic:

To clear the filter, select the same topic.
Filter by visitor type
By default, we show the feedback left by both new and returning visitors.
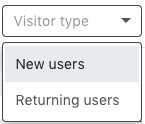
To view the feedback left by only new or only returning visitors, select the appropriate filter from the Visitor type combo box and select Apply:
Reviewing individual Feedback
Changing the language used to display feedback
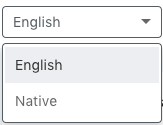
For clients that have chosen to translate their feedback responses from a source or native language to English, you can toggle between the source and translated text by making a selection from the language combo box:
Viewing, editing, and removing feedback
Viewing
For each piece of feedback sent to Qubit, we also gather additional information that you can use to get a better understanding about visitors leaving feedback, including:
-
The number of pages visited in the current entrance before feedback was left
-
The user’s entrance number when feedback was left
-
The user’s journey for the entrance when the feedback was left
You might use this information, for example, to improve a particular feature on your site or improve your FAQs.
To view this information select and Show details.
Editing
When feedback is received from your property, and after it has been broken down in statements, we use machine learning techniques to assign a topic and sentiment to each statement.
To fine-tune this automated process, and improve the overall accuracy of topic and sentiment assignments, you can edit each piece of feedback.
Start by selecting and Edit.
Adding a topic
Step 1
Select Add new topic, make a selection from the list of topics, and select a sentiment: positive, negative
Step 2
Select Save and then Done
Removing a topic
Step 1
Select a topic and Remove topic
Step 2
Select Done
Changing the topic
Step 1
Select a topic and make a selection from the topic combo box:

Step 2
Select Save and then Done
Changing the sentiment of a topic
Step 1
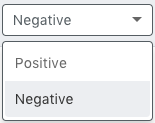
Select a topic and make a selection from the sentiment combo box:
Step 2
Select Save and then Done
Removing a piece of feedback
Select and Remove.
Downloading feedback
You can download the feedback sent from your property by selecting Download feedback. The resulting .tsv file will include all the feedback for the selected reporting period. Remember that by default this is the last 7 days.