Campaign performance — product recommendations
Campaign performance — product recommendations
In this step, you’ll learn about what happens when you launch a campaign, what metrics you’ll see when the Coveo Experience Hub has enough data, and how you can use those metrics to gauge the impact of campaigns.
Some useful information
When you launch a campaign, your customers will start to generate relevant data. Once this process is underway and there’s enough data to get started, the Experience Hub will begin reporting against some key metrics.
These are the metrics you’ll use in your team to determine your campaign’s impact, and you’ll likely use these metrics in wider merchandising and marketing discussions.
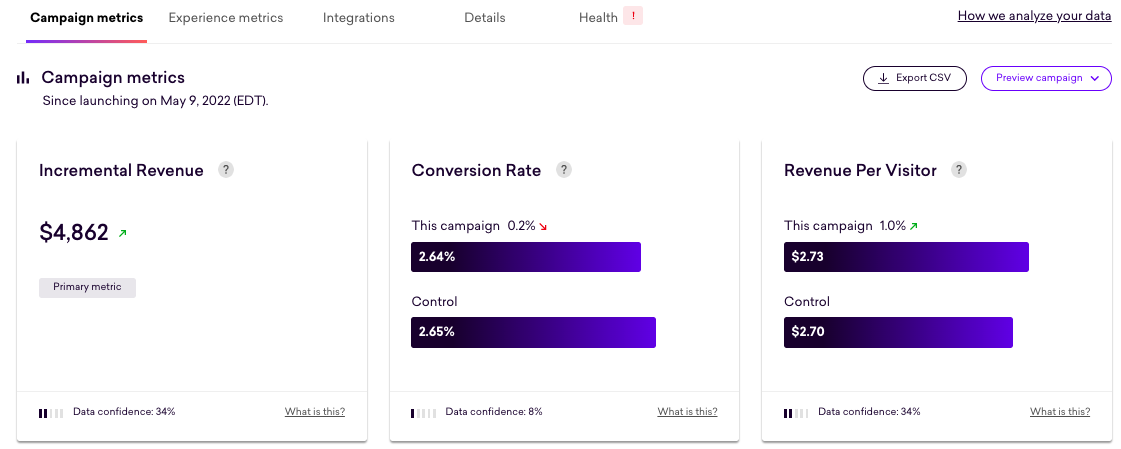
You can review this data by opening your campaign and navigating to Campaign metrics:
|
|
Note
For campaigns launched with audience splits of 50% and 95%, you’ll need to see 500 converters in the control and the campaign (variation) you can learn anything meaningful about campaign performance. You won’t see any metrics until this threshold has been passed. |
It’s also recommended to refer to the glossary where you can find explanations for Experience Hub terms.
Post-launch
As mentioned above, for campaigns running at 50% and 95%, there’s a minimum threshold that needs to be passed before showing metrics. The magic number is 500!
So when you first launch your campaign and until this number is reached, you’ll see Not enough data for the metrics.
Once this threshold is passed, you can start reporting the changes for each metric. You can see this process in play in the following example:

|
|
Some words about… 100% campaigns
For a start, for campaigns launched at 100%, you won’t need to wait for the 500 converters threshold. This is because with 100% visibility you’re not comparing your campaign to your default website content–there’s no A/B testing. All your visitors will see your campaign. You’ll still have to wait for your campaign to generate data before you can show metrics. You’ll also notice that the metrics you use for 100% campaigns are different. |
Getting updates
Sitewide impact
There are three levels of reporting. The first is sitewide–this is an aggregation of ALL the campaigns on your site. Sitewide metrics are a great way of proving the value of the Experience Hub and your returns for your hard work and investment.
To get the sitewide impact, select Campaigns from the side menu.
Here’s an example:

Campaign impact
At the next level, the campaign, you’ll find out how things are going for each of your campaigns.
To get the campaign impact, open one of your live or paused campaigns
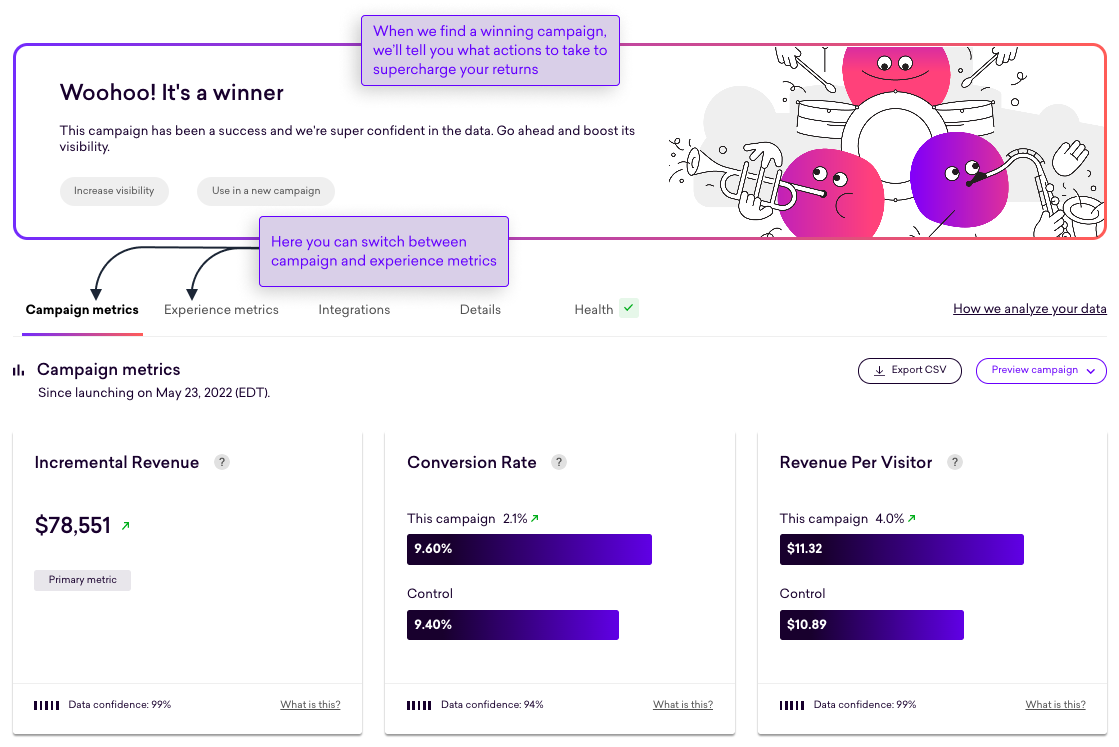
You’ll use these metrics to understand the impact of the campaign:
|
|
Note
The metrics the Experience Hub reports for campaigns with a 50:50 and 95:5 splits are different from the metrics reported for campaigns launched at 100. |
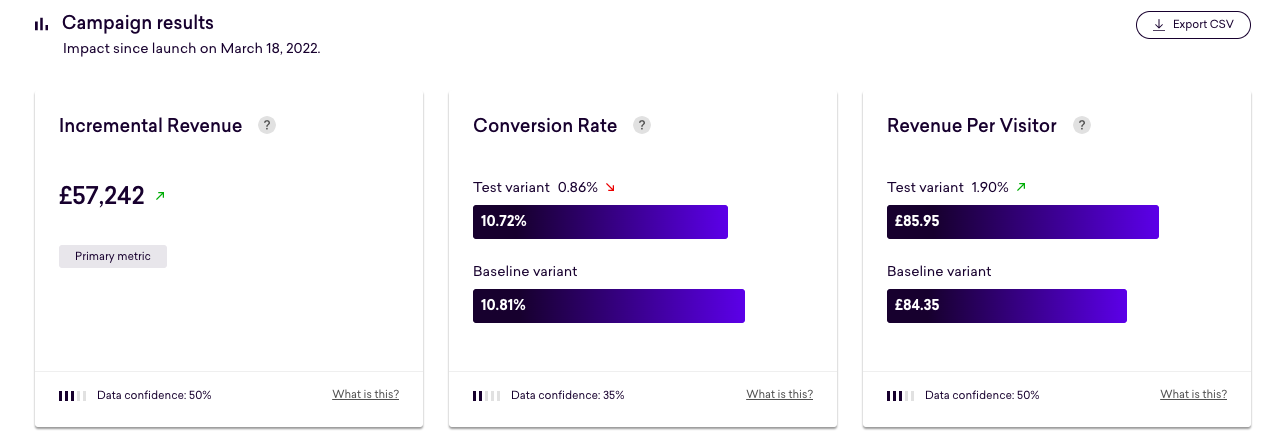
To dive into some additional campaign metrics, such as clickthrough rate and Revenue per converter (RPC), click Show campaign results.
In this example, you can see that the Experience Hub is confident in the data reported. As a result, the campaign is a winner:
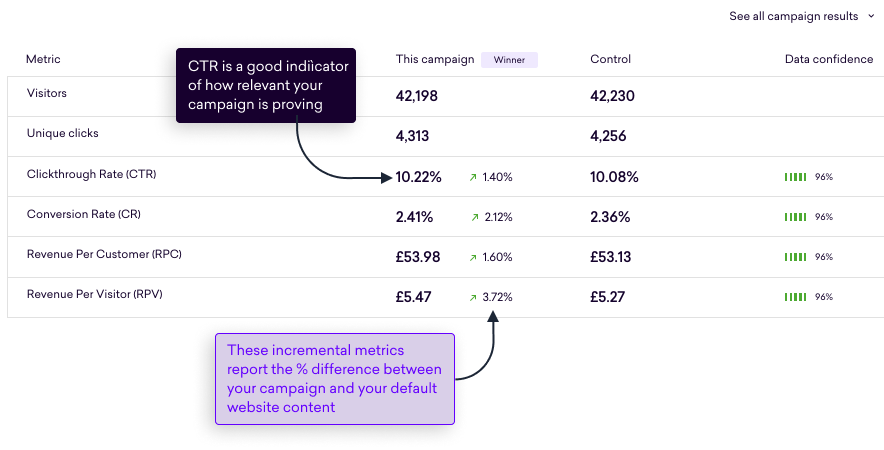
You can find an explanation of each of the metrics reported against at the bottom of this article.
Experience impact
Switching to Experience metrics, you’ll also find experience-level metrics that will prove especially useful when trying to understand how each experience stacks up against your default website content:
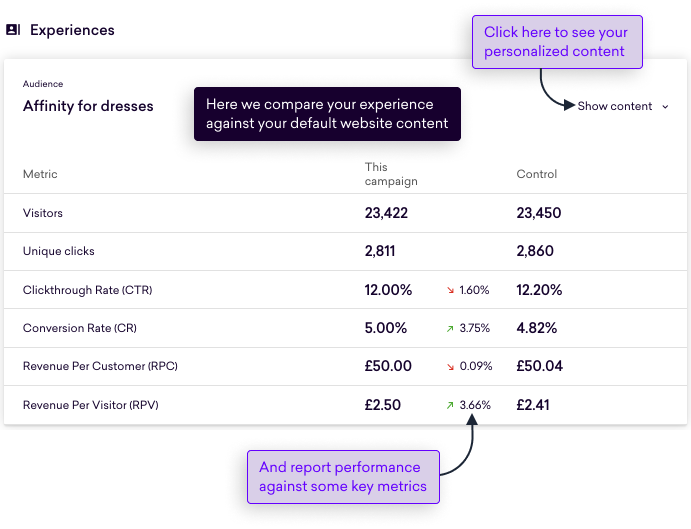
Or, if you chose to replace your control, how experiences performed head-to-head.
These experience-level metrics align exactly with your personalized content, recommendations, and badging campaign configurations. This means that any experience, recommendation, or badge you create will get its own experience-level metrics.
Historical metrics
Each time a campaign is edited (see below) and re-launched, the Experience Hub stores a new revision and resets experience metrics to zero. The Experience Hub does this because metrics need to come from the same underlying experiences to be statistically meaningful. By starting with a new set of metrics, it’s ensured that the data reported is based on a fair comparison.
|
|
Note
Returning visitors who saw the initial and new revisions will be counted in each revision’s experience metrics. It’s therefore normal for the sum of visitors across revisions to not add up precisely to the total number of visitors in the campaign metrics. |
When navigating to the "Experience metrics" tab, the data displayed is for the most recent revision by default. You can review the metrics of a previous revision by selecting it from the dropdown shown below. The date ranges in the dropdown represent the first and last day on which we calculated metrics for a revision. The dates may differ slightly from when the campaign was published or paused and will appear on newly launched revisions once we’ve computed the first batch of metrics.
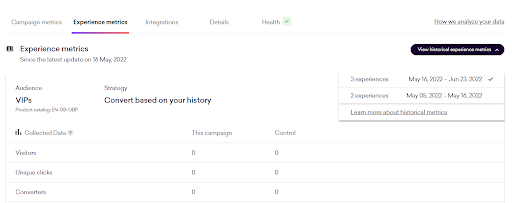
Editing a campaign refers to any action that changes the campaign’s logic, including:
-
Adding, removing, or re-ordering experiences
-
Changing the audience, strategy, content, or rules of an experience
-
Adjusting the campaign from single to multi-variant, etc
Under the hood
Let’s focus now on a metric card and discuss how to interpret the results.
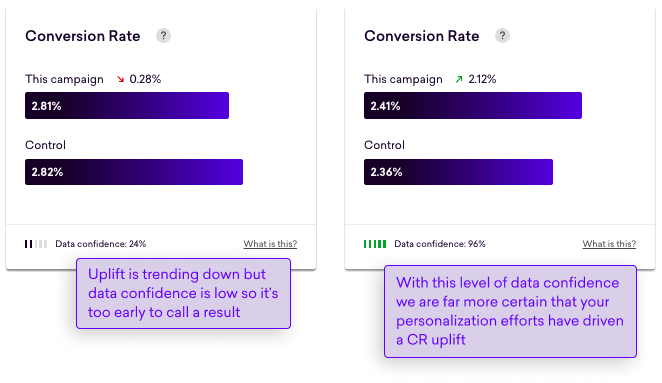
Data confidence
If you look at the example below, you can see what happens to data confidence as the campaign progresses and gathers more data, moving from 24% to 96%. Data confidence is an expression of how confident the Experience Hub is in the reported change for a metric–as more people see your campaign and the longer it runs for, the more confident Experience Hub can be in the result.
Finding winners and losers
Whether your campaign is a winner, loser, or something in between, the Experience Hub will suggest what next steps you can take. For example, you possibly get a suggestion to increase the number of people that see the campaign, pausing it, or even editing it. This will be covered in detail in the next article Taking action.
You’ll be kept updated about the progress your campaign is making, so you’ll always have the metrics to back up whatever decision you take.
Winner
The Experience Hub will declare the campaign a winner when:
-
Enough people have seen your campaign
-
It’s been running for long enough
-
The probability of an uplift in RPV is higher than 95%
Here’s an example:

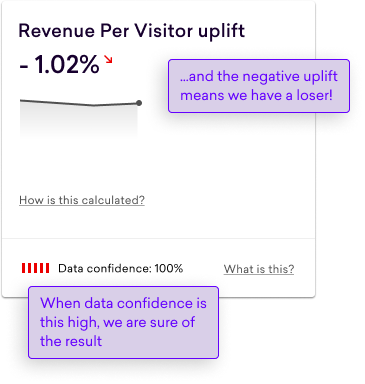
Loser
The Experience Hub will declare the campaign a loser when:
-
Enough people have seen your campaign
-
It’s been running for long enough
-
The probability of an uplift in RPV is less than 5%
Here’s an example:
Somewhere in the middle
The Experience Hub will declare the campaign neither a winner nor a loser when:
-
Enough people have seen your campaign
-
It’s been running for long enough
-
The probability of an uplift in RPV is more than 5% but less than 95%
Trending positive and negative
Before getting to the point where a campaign can be declared a winner, loser, or neither, you’ll be given a heads up about the trend the Experience Hub is seeing:

The difference between a trending positive and winning campaign is only really the amount of data. When a campaign is trending positive or negative, the Experience Hub doesn’t have the right amount of data to be confident in the uplift reported.
You should pay particular attention to campaigns that are trending negative because at this stage, you still have time to intervene and make changes by changing the imagery or message.
Hold ya horses
Of course, the Coveo team understands that what a winning campaign looks like to you and your team is a little more complicated than just looking at a single metric, such as RPV.
You and your team will know the reasons for launching a campaign and precisely what you are trying to achieve. To help you build a more balanced picture of each of your campaigns, the Experience Hub provides a host of over metrics, including view and click-based attribution–these are the metrics merchandisers look for as the strongest indicators of customer relationships.
Using click-based attribution, for example, is a great way to demonstrate your campaign’s impact. Amongst other things, it shows:
-
How well your brand resonates with your customers
-
How engaging your content is
-
The effectiveness of your funnel, from the initial engagement at the top to that order at the bottom
|
|
Note
You’ll find a definition for each metric in our glossary. |
Your next steps
Whatever the result, the Experience Hub will suggest what actions you can take. This could include:
-
Moving from a 50% visibility to 95% to engage more customers, where the Experience Hub has found a winner.
-
Waiting a bit longer for the data, where it’s trending positive, but the Experience Hub is not sure of the result yet.
-
Pausing it or making changes, where the Experience Hub has found a loser (and this will happen) or if it’s trending negative.
The next section covers how you take action following test results, Taking action.
|
|
A quick word about losing campaigns
The Experience Hub is a tool that allows you to get personalized content, product recommendations, and badging on your website without having to rely on a dev team and in a highly repeatable way; getting a campaign up and running can take minutes. This gives you a unique opportunity to discover what works with your customers and, equally, what doesn’t. A losing campaign and finding out what doesn’t work is just as important as finding out what does. You’ll likely have many losing campaigns, especially at the outset. Take away the lessons, use the metrics the Experience Hub provides to understand why, and build those lessons into your next campaign. |
Exporting campaign data
Sometimes you need to perform deeper analyzes of your campaigns, typically in a spreadsheet or BI tool. To achieve this, you can export a CSV containing all the metrics you see in the UI for each day a campaign has been live. To download this data, click Export CSV.
Here’s more information on the CSV’s contents:
| Field | Definition | Metric source | Example | Suggested formatting |
|---|---|---|---|---|
string_date |
The campaign metric date |
n/a |
2022-01-01 |
Text |
campaign_id |
The campaign’s unique identifier |
n/a |
abc123-def456 |
Text |
allocation |
The maximum allocation towards the campaign’s variant |
n/a |
0.5 |
Percentage |
visitors_variant |
The cumulative count of unique visitors in the campaign’s variant |
Collected |
100000 |
Integer |
visitors_control |
The cumulative count of unique visitors in the campaign’s control |
Collected |
100000 |
Integer |
converters_variant |
The cumulative count of unique converters in the campaign’s variant |
Collected |
5100 |
Integer |
converters_control |
The cumulative count of unique converters in the campaign’s control |
Collected |
5000 |
Integer |
clickers_variant |
The cumulative count of unique clickers in the campaign’s variant |
Collected |
10500 |
Integer |
clickers_control |
The cumulative count of unique clickers in the campaign’s control |
Collected |
10000 |
Integer |
cvr_variant |
The cumulative ratio of converters to visitors for the variant |
Analyzed by the stats engine |
0.051 |
Percentage |
cvr_control |
The cumulative ratio of converters to visitors for the control |
Analyzed by the stats engine |
0.050 |
Percentage |
cvr_uplift |
The uplift in Conversion Rate (CR) |
Analyzed by the stats engine |
0.020 |
Percentage |
ctr_variant |
The cumulative ratio of clickers to visitors for the variant |
Analyzed by the stats engine |
0.105 |
Percentage |
ctr_control |
The cumulative ratio of clickers to visitors for the control |
Analyzed by the stats engine |
0.100 |
Percentage |
ctr_uplift |
The uplift in clickthrough rate |
Analyzed by the stats engine |
0.050 |
Percentage |
rpv_variant |
The cumulative ratio of attributed revenue to visitors for the variant |
Analyzed by the stats engine |
5.050 |
Your property’s currency |
rpv_control |
The cumulative ratio of attributed revenue to visitors for the control |
Analyzed by the stats engine |
5.000 |
Your property’s currency |
rpv_uplift |
The uplift in revenue per visitor |
Analyzed by the stats engine |
0.010 |
Percentage |
rpc_variant |
The cumulative ratio of attributed revenue to converters for the variant |
Analyzed by the stats engine |
50.500 |
Your property’s currency |
rpc_control |
The cumulative ratio of attributed revenue to converters for the control |
Analyzed by the stats engine |
50.000 |
Your property’s currency |
rpc_uplift |
The uplift in revenue per converter |
Analyzed by the stats engine |
0.010 |
Percentage |
incremental_revenue |
Incremental revenue attributed the variant computed as the multiplication of variant visitors, control RPV, and RPV uplift |
Analyzed by the stats engine |
5000 |
Your property’s currency |
impression_converters_variant |
The cumulative count of unique converters that previously saw the campaign’s variant |
Collected |
5100 |
Integer |
impression_converters_control |
The cumulative count of unique converters that previously saw the campaign’s control |
Collected |
5000 |
Integer |
impression_revenue_variant |
The cumulative sum of revenue attributed to visitors that previously saw the campaign’s variant |
Collected |
505000 |
Your property’s currency |
impression_revenue_control |
The cumulative sum of revenue attributed to visitors that previously saw the campaign’s control |
Collected |
500000 |
Your property’s currency |
clickthrough_converters_variant |
The cumulative count of unique converters that previously clicked the campaign’s variant |
Collected |
2050 |
Integer |
clickthrough_converters_control |
The cumulative count of unique converters that previously clicked the campaign’s control |
Collected |
2000 |
Integer |
clickthrough_revenue_variant |
The cumulative sum of revenue attributed to visitors that previously clicked the campaign’s variant |
Collected |
202000 |
Your property’s currency |
clickthrough_revenue_control |
The cumulative sum of revenue attributed to visitors that previously clicked the campaign’s control |
Collected |
200000 |
Your property’s currency |
Campaign metrics
Campaigns with a standard control
| Audience split | Metric | Explanation |
|---|---|---|
50% and 95% |
Incremental Revenue |
A prediction of the additional revenue generated by your campaign, based on the current Revenue Per Visitor uplift |
Conversion Rate |
The percentage of visitors that saw the campaign and went on to convert |
|
Revenue Per Visitor |
The total revenue divided by the total number of unique campaign visitors |
|
Visitors |
The number of unique campaign visitors |
|
Unique clicks |
The number of unique clicks an experience link |
|
Clickthrough Rate |
The total number of unique visitors that clicked an experience link at least once divided by the total number of unique visitors in the campaign |
|
Conversion Rate |
The total number of unique converters divided by the total number of unique visitors in the campaign |
|
Revenue Per Customer |
The total revenue divided by the total number of unique campaign converters |
|
100% |
Impression Revenue |
The total amount of revenue from orders placed by visitors that saw the campaign |
Conversion Rate |
The total number of unique converters divided by the total number of unique visitors in the campaign |
|
Revenue Per Visitor |
The total revenue divided by the total number of unique campaign visitors |
|
Visitors |
The number of unique campaign visitors |
|
Unique clicks |
The number of unique clicks an experience link |
|
Clickthrough Rate |
The total number of unique visitors that clicked an experience link at least once divided by the total number of unique visitors in the campaign |
|
Conversion Rate |
The total number of unique converters divided by the total number of unique visitors in the campaign |
|
Revenue Per Customer |
The total revenue divided by the total number of unique campaign converters |
Campaigns with a replaced control
| Audience split | Metric | Explanation |
|---|---|---|
50% and 95% |
Incremental Revenue |
A prediction of the additional revenue generated by your campaign and is based on the current Revenue Per Visitor uplift |
Conversion Rate |
The total number of unique converters divided by the total number of unique visitors in the campaign |
|
Revenue Per Visitor |
The total revenue divided by the total number of unique campaign visitors |
|
Visitors |
The number of unique campaign visitors |
|
Unique clicks |
The number of unique clicks an experience link |
|
Clickthrough Rate |
The total number of unique visitors that clicked an experience link at least once divided by the total number of unique visitors in the campaign |
|
Conversion Rate |
The total number of unique converters divided by the total number of unique visitors in the campaign |
|
Revenue Per Customer |
The total revenue divided by the total number of unique campaign converters |