Troubleshoot problems using the Coveo Diagnostic Page
Troubleshoot problems using the Coveo Diagnostic Page
Coveo for Sitecore provides a tool to quickly diagnose issues. It’s called the Diagnostic Page.
Accessing the Diagnostic Page manually
Open the following URL in a web browser: http://<INSTANCE_HOSTNAME>/sitecore modules/Web/Coveo/admin/CoveoDiagnosticPage.aspx, where <INSTANCE_HOSTNAME> must be replaced with the name of your Sitecore instance.
Accessing the Diagnostic Page via the Control Panel
-
Open the Coveo Search section of the Sitecore Control Panel (see Open the Coveo Search Control Panel Section).
-
Choose Diagnostic.

-
The Diagnostic Page will open in your default web browser.
Using the Diagnostic Page
Coveo for Sitecore Diagnostic Package
The diagnostic package wraps all the information present on the Diagnostic Page in a compressed file and lets the user download it.

Coveo for Sitecore components state
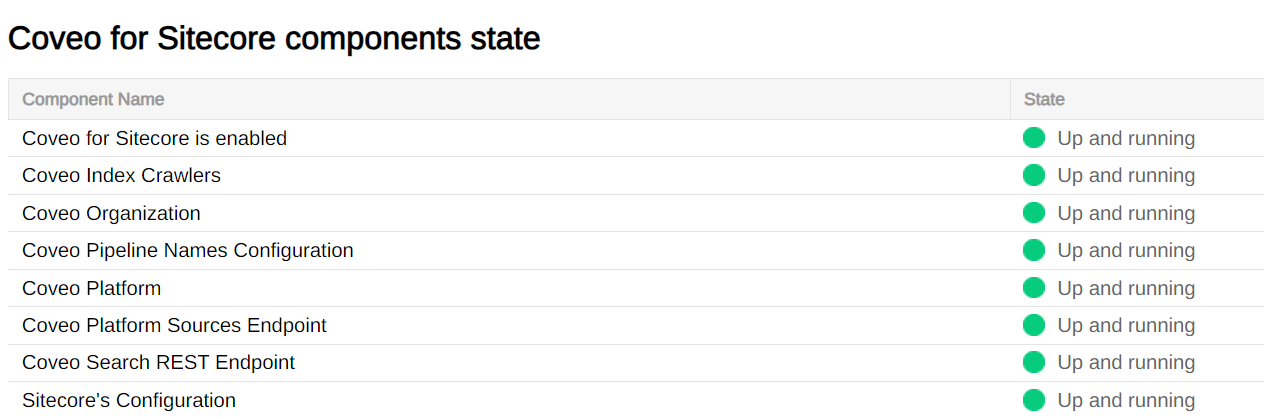
The Diagnostic Page provides a list of all the major modules that form Coveo for Sitecore, along with a status for each one of them.
Status of the different modules are retrieved automatically after the first page load. If you want to update those statuses, you must hit Refresh in the upper-right corner.
For a fully working Coveo for Sitecore instances, components should all be in the "Up and running" state, as seen below:
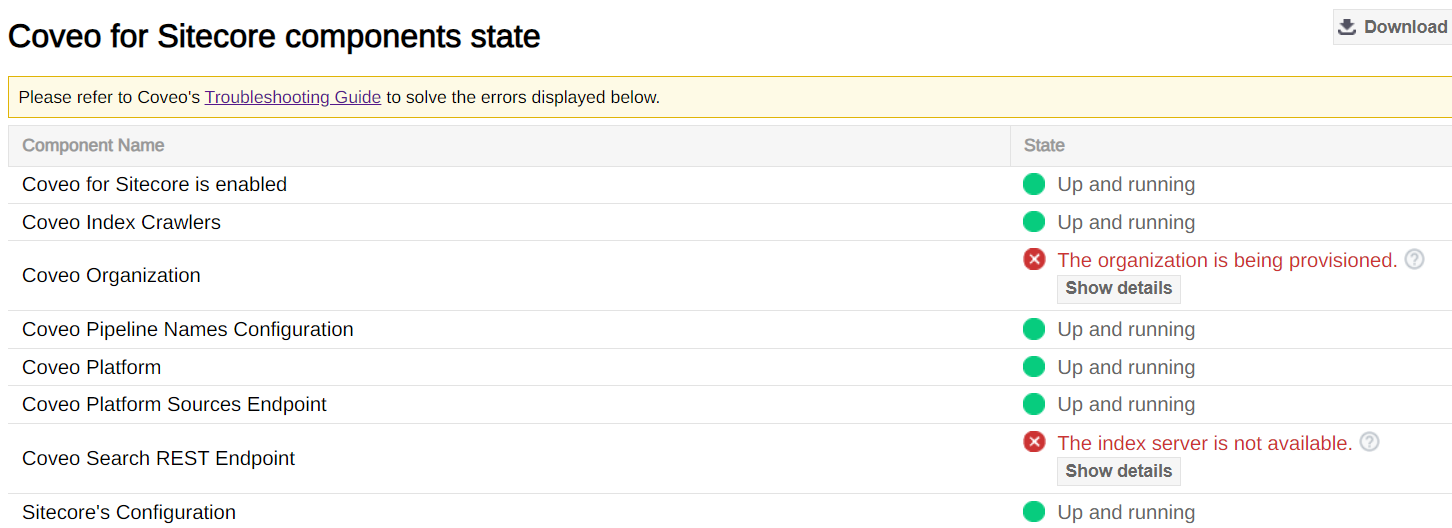
However, if any module is down (if the organization is provisioning, for example) you’ll see an error message similar to this one:
Diagnostic states description
| Name | Description | Things to look for if in error |
|---|---|---|
Coveo Index Crawlers |
Validate the crawling root of the Coveo indexes. |
In your configuration files, locate your Coveo indexes and validate your crawling root. |
Coveo Platform |
Tries to get the Coveo Platform status. |
Validate that you have access to the Coveo Platform from your Sitecore instance. |
Coveo Organization |
Tries to get your Coveo organization status. |
Validate in the Coveo Platform that your organization is healthy. |
Coveo Platform Sources Endpoint |
Tries to get the sources from your Coveo organization. |
Validate that there are Sources (platform-ca | platform-eu | platform-au) in your Coveo organization and that your organization is healthy. |
Sitecore’s Configuration |
Tries to create the required configuration for Coveo. |
Check the error in the details and fix accordingly. |
Coveo for Sitecore version information
The Diagnostic Page provides you with a way to check if your Sitecore and Coveo for Sitecore versions are compatible. The following describes the different compatibility statuses you might encounter:
Compatibility status: These versions are compatible.
Meaning: Your current Sitecore and Coveo for Sitecore versions are compatible.
Compatibility status: The Sitecore version is not supported yet. The latest supported version is <SITECORE_VERSION>.
Meaning: The current Coveo for Sitecore version hasn't been tested on your version of Sitecore. See Supported Sitecore versions and dependencies.
Compatibility status: These versions are incompatible. Sitecore <SITECORE_VERSION> is expected.
Meaning: You downloaded and installed a Coveo for Sitecore version that's meant to be used on Sitecore <SITECORE_VERSION> (Note: The Update portion of <SITECORE_VERSION> is irrelevant). To fix the issue, download a Coveo for Sitecore package associated with your current version of Sitecore.
Coveo for Sitecore organization information
This section provides information about your Coveo organization, its name and ID, and details regarding your field and document usage. The Open Coveo Platform Administration Console link provides access to your organization in the Coveo Administration Console.
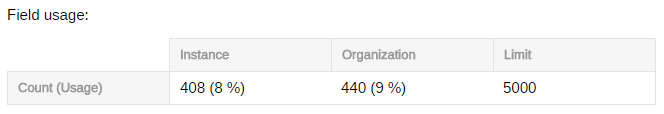
The Field Usage section allows you to see how many fields are being indexed for the current Sitecore instance, and across all your Coveo organization.
-
The Instance column presents the number of indexed fields for the current Sitecore instance. It’s the sum of the fields indexed for all the Coveo indexes of the current Sitecore instance. The fields are retrieved using the
coveoIndexingGetFieldspipeline (see About the coveoIndexingGetFields Pipeline). -
The Organization column presents the total number of indexed fields, across all sources in your Coveo organization.
-
The Limit column presents the maximum number of fields that can be configured in the Coveo organization.
-
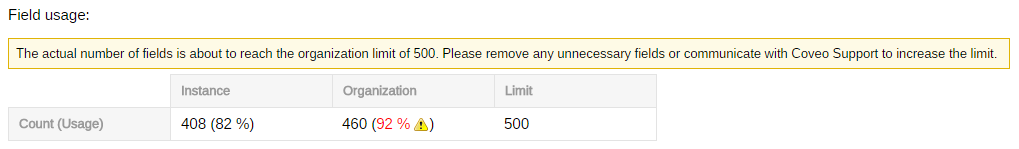
The Usage represents the ratio between the total number of indexed fields in your Coveo organization and the organization limit.
 Note
NoteVisual indicators are displayed when your usage ratio reaches 80%.
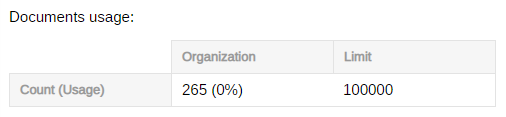
The Document Usage section allows you to see how many documents are currently indexed in your Coveo organization.
-
The Organization column presents the total number of indexed documents you currently have, across all sources in your Coveo organization.
-
The Limit column presents the maximum number of documents that can be indexed in your Coveo organization.
-
The Usage represents the ratio between the number of indexed documents you currently have and the organization limit.
NoteVisual indicators are displayed when your usage ratio reaches 80%.
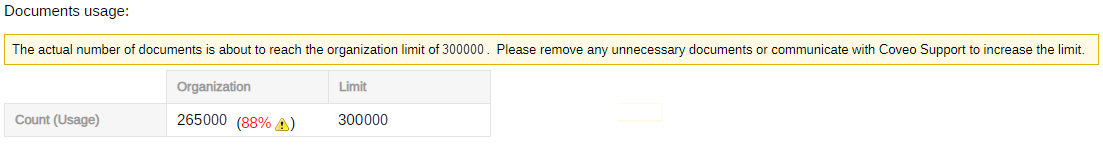
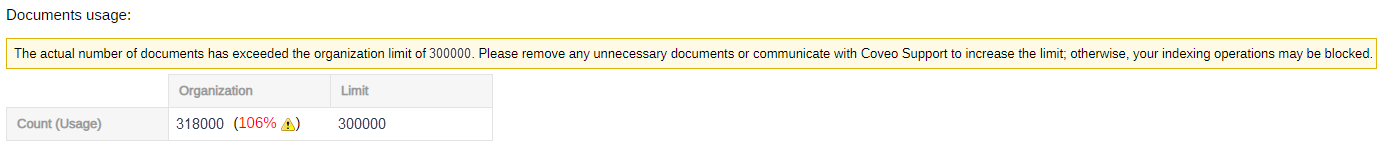
Exceeding your document limit may cause indexing operations to be blocked.
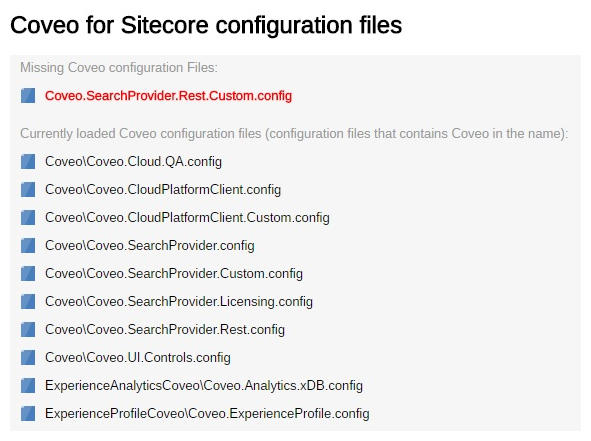
Coveo for Sitecore configuration files
The Diagnostic Page provides a list of all currently loaded Coveo configuration files:
If you want to refresh the list, you must hit Refresh in the upper-right corner.
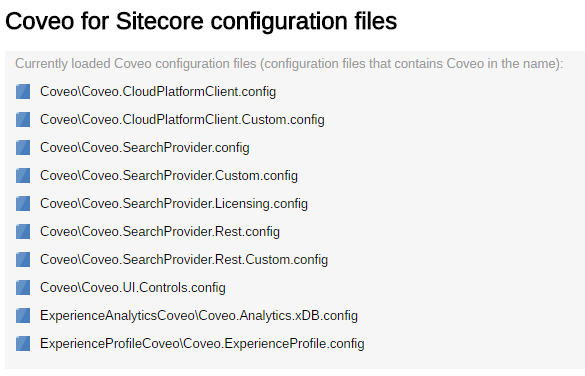
When Coveo is unable to find one of the configuration files, the missing file appears in red under Missing Coveo configuration Files.
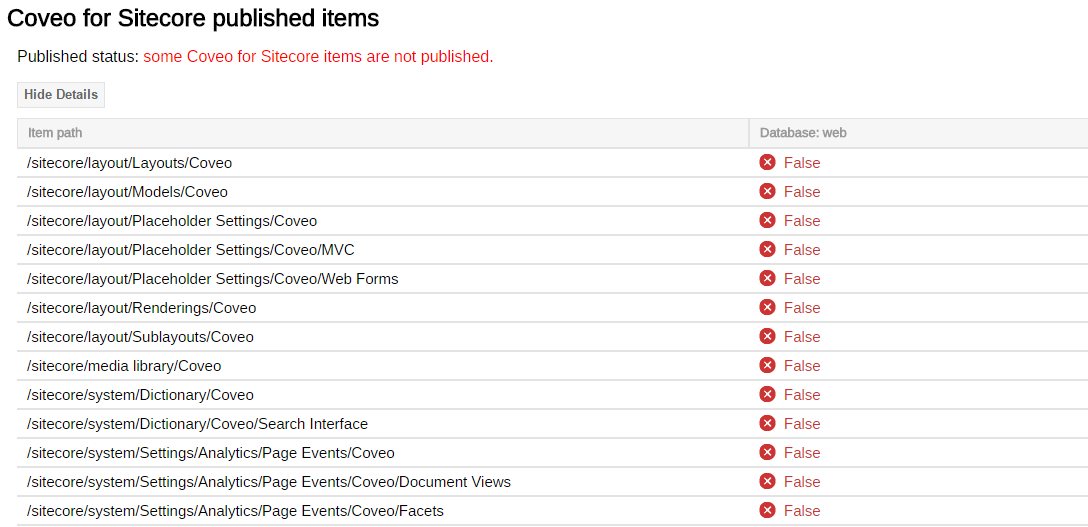
Coveo for Sitecore published items
The Diagnostic Page gives you a list of the items that need to be published for Coveo to work properly.
If all the needed items are published, you should see a message similar to this one:

If some items aren’t yet published, the following message should be displayed. You can click Show details to show the list of currently published items, as shown in the following image:
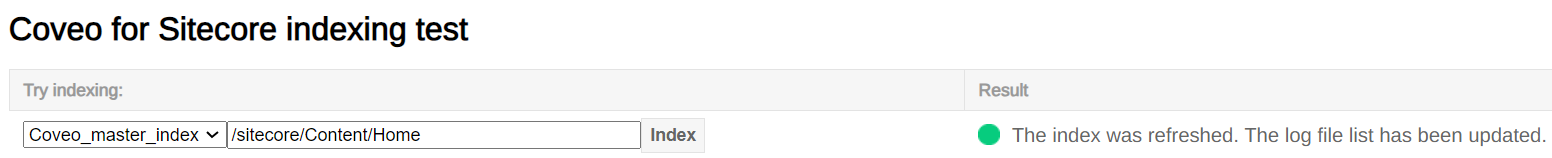
Coveo for Sitecore indexing test
The Diagnostic Page gives you the possibility to refresh a sub-tree of the Coveo index:

To perform a sub-tree refresh:
-
Select an index in the dropdown menu on the left.
-
Enter the path of the sub-tree you would like to refresh.
-
Click Index.
If the refresh was performed, a success message should be displayed:
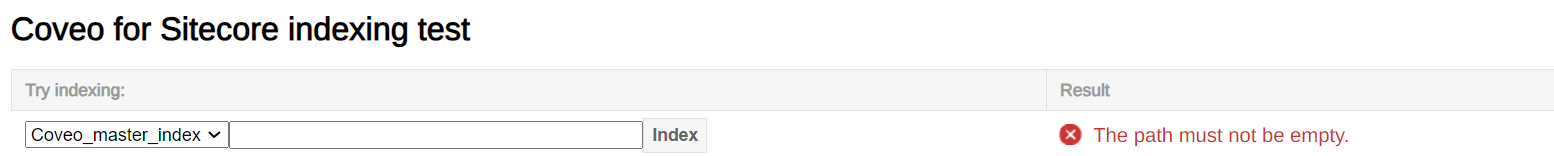
However, if an error occurs (for example, if the path of the item isn’t specified), you should see an error message like this one:
Coveo for Sitecore log viewer
The Diagnostic Page provides a tool to read Sitecore log files:
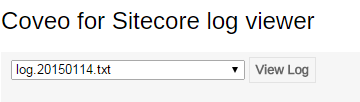
To watch a specific log file:
-
Select the file you want to watch in the dropdown menu. Most recent log files are displayed on top.
-
Click View Log.
-
The log file appears on the screen:
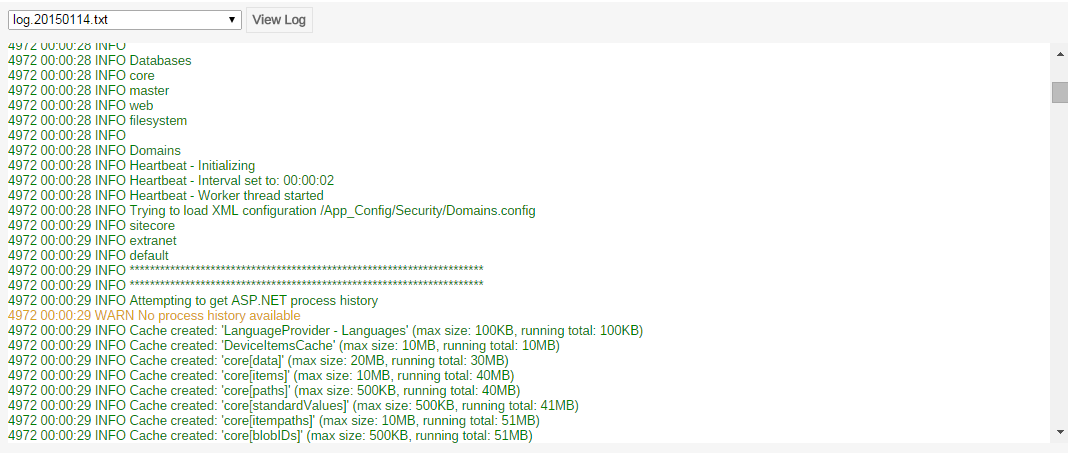
The tool colors each line depending on the severity of the entry. This can be useful to quickly locate errors. The table below shows the color in which each type of entry is displayed:
| Entry type | Color |
|---|---|
INFO, VERBOSE |
Dark Green |
DEBUG, TRACE |
Light grey |
WARN |
Yellow |
ERROR |
Red |
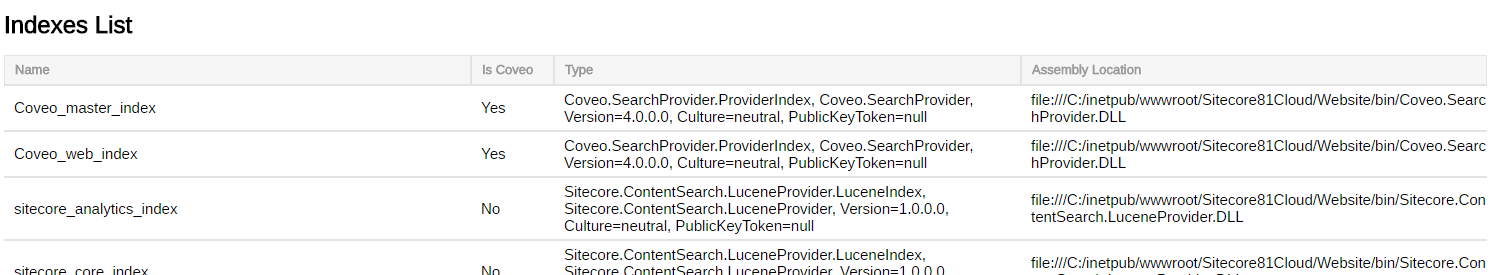
Indexes List
The Diagnostic Page also shows the complete list of indexes currently configured.
Downloading the diagnostic package directly
It’s possible to directly access the package by opening the following URL in a web browser: http://<INSTANCE_HOSTNAME>/sitecore modules/Web/Coveo/CoveoDiagnosticPackage.aspx, where <INSTANCE_HOSTNAME> must be replaced with the name of your Sitecore instance.
You need to be authenticated to download the diagnostic package this way. If you try to download the package without having the proper authentication, the following page will be shown :
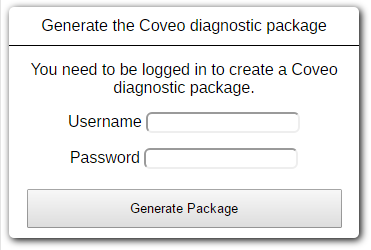
You might need to specify the domain (sitecore\USERNAME, for example) for it to correctly log in.
The download should start automatically after being logged in.