Analyze HTTP Traffic Using Chrome Developer Tools
Analyze HTTP Traffic Using Chrome Developer Tools
Analyzing the GET and POST response that’s sent by a Web Application reveals useful information. This is particularly true when diagnosing the behavior of a Coveo for Sitecore Search.
This article explains how to obtain the Headers and the Response of any HTTP method called by a Coveo for Sitecore Search page using Chrome Developer Tools.
Sample Troubleshooting Procedure
-
Open the Chrome Browser (Get Chrome)
-
Open the Chrome Developer Tools (or select F12)
-
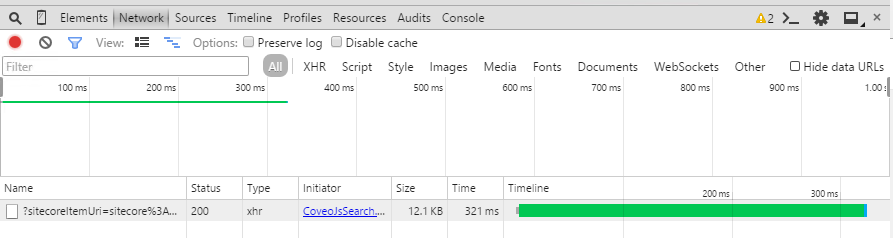
In the Developer Tools Console, select the Network tab. This will display all the methods that were used since you opened the tool.
-
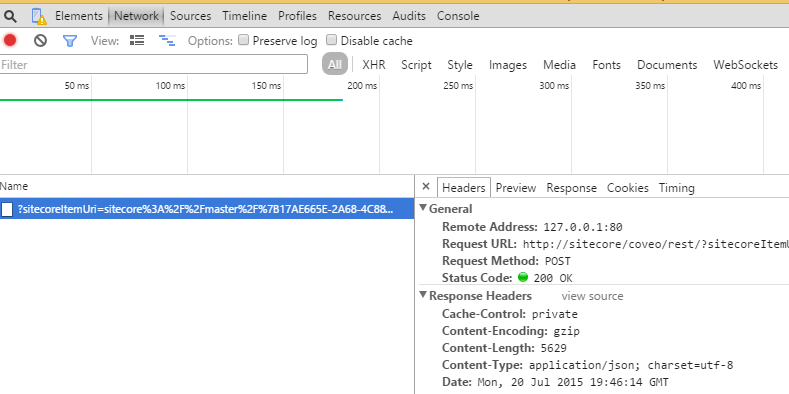
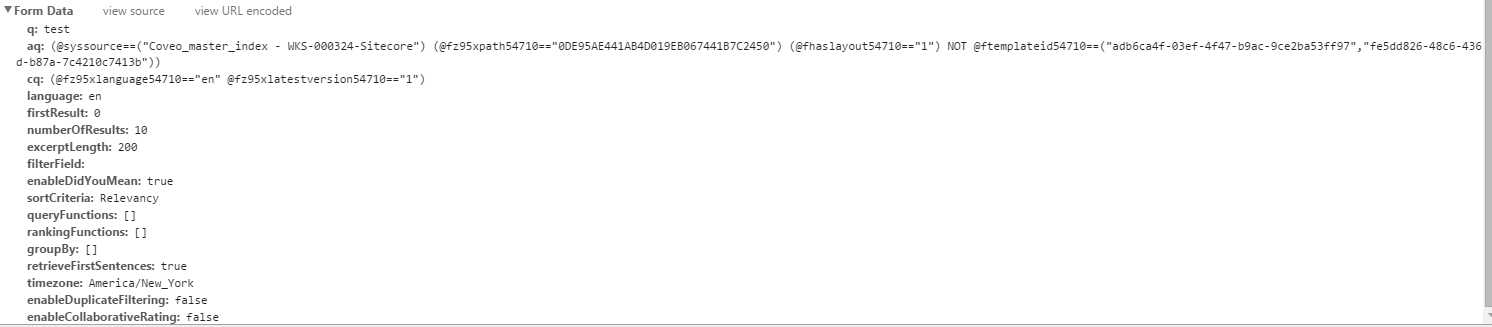
Clicking a method under the Name column header will give the details of that method. The Headers represent the header of the method.
-
The Headers tab also allows you to see the full query that’s sent by your Coveo for Sitecore Search page.
-
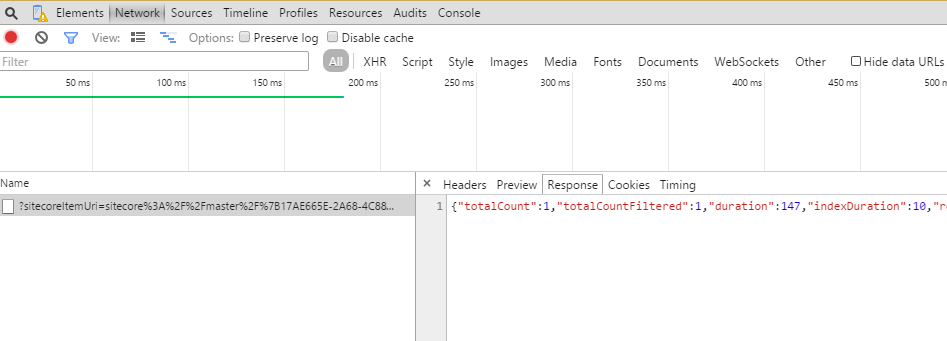
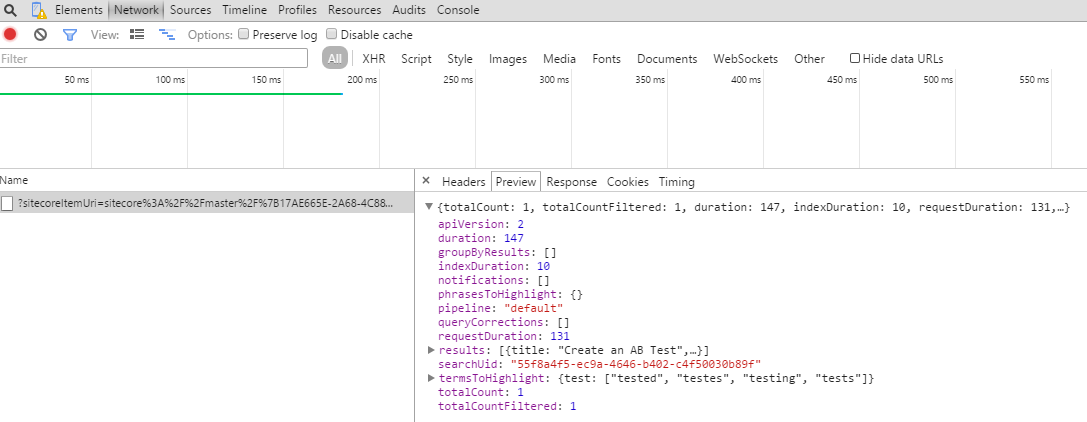
The Preview tab displays a summary of the relevant information that was returned by the method call. For a query in a Coveo for Sitecore page, it will show information like how many results were returned, how long did the query took, etc.
-
The Response tab contains the entire content of what was returned by the method call.