With Coveo Qubit debugger
With Coveo Qubit debugger
The Coveo Qubit debugger provides a visualization of the events emitted when each of your pages is rendered and a first check of event validity. This check ensures that each event meets the bare minimum specification according to our event schemas. An event is considered valid if:
-
It includes all mandatory fields
-
Each field value conforms to the expected type
|
|
Only valid events are processed by our data pipeline. Although the Experimentation Hub collects and stores invalid events, it does not process the data contained within them. Invalid events therefore essentially represent lost data that would otherwise be used to drive the power of the Experimentation Hub. |
The Coveo Qubit debugger is available to all Coveo customers, and can be called directly in your browser with no additional setup.
|
|
Note
Whist using the Coevo Qubit debugger, you may notice site performance issues. This is due to the call made to one of our APIs which enriches event with meta and context data for more effective segmentation. |
Starting the tool
To start the Coveo Qubit debugger, add the following line to your property’s URL in your browser’s address bar:
?qubit_debugor if a query parameter already exists in the url in question:
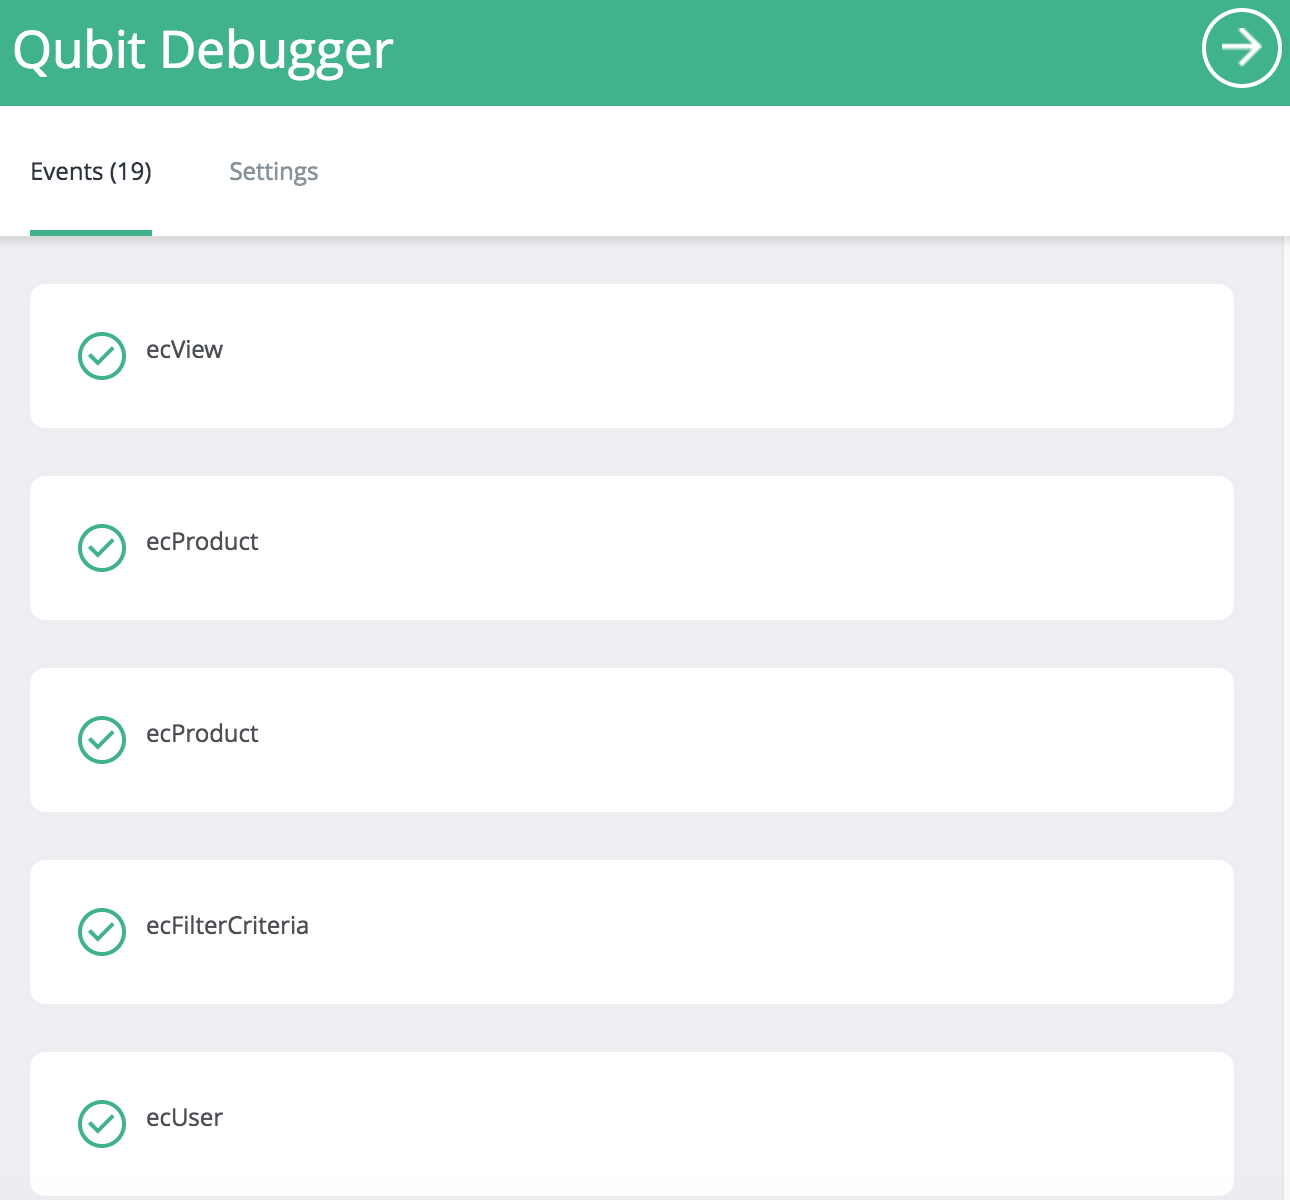
&qubit_debugExecuting this will load the Debugger into a side panel with all of the events emitted on the page:

In the above example, we can see that 19 events have been emitted.
Checking that events are valid
As each event is loaded into the Debugger, the fields and field values in each event are validated against our data dictionary for that event.
 denotes a valid event
 denotes an invalid event
Viewing event details
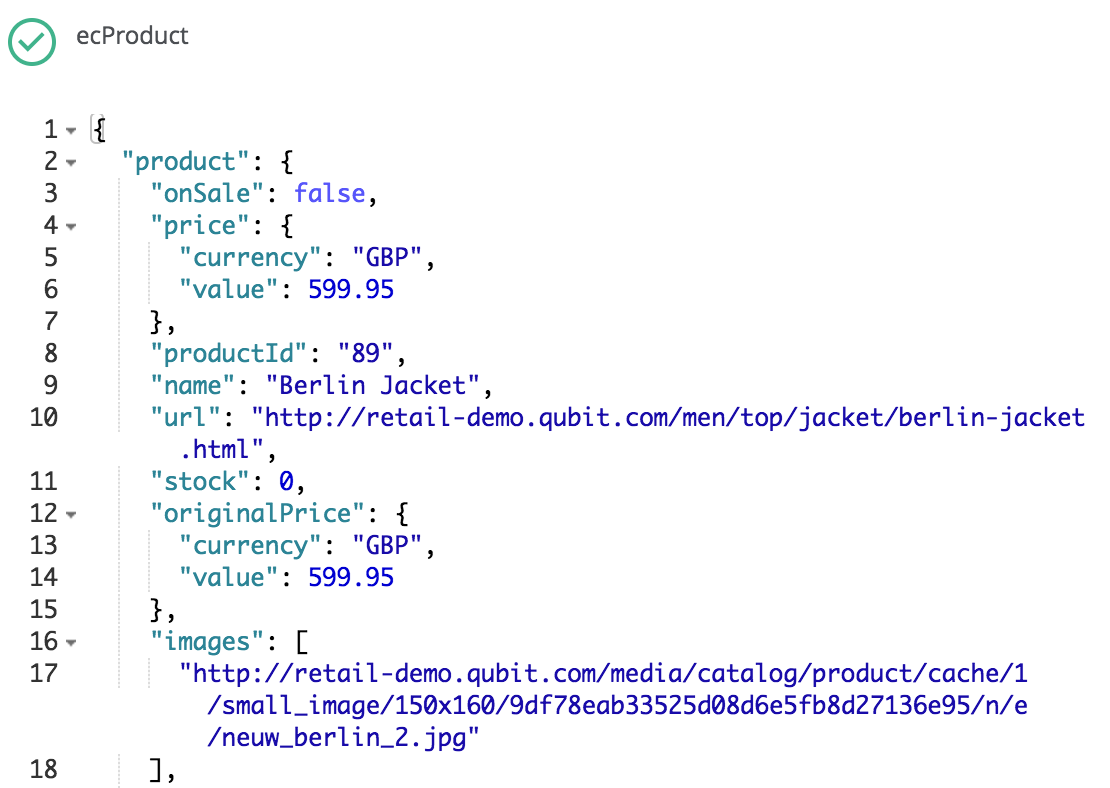
By selecting an event, you can view the event, meta, and context data within it:
