Analyze
Analyze
In this article, we’ll take an in-depth look into the metrics you can use to understand how each of your segments is performing, including the number of visitors in the segment, the Conversion Rate of the visitors in the segment, and the number of visitors joining and leaving the segment over the last seven and thirty days.
Intro
The Overview tab on the Segments page provides detailed insights into each of your segments. It combines several smart views that will help you discover trends in visitor behavior and make well-informed choices about when and how to personalize:
-
Segment size
-
Metrics (Conversion Rate, Revenue Per Visitor, Average Order Value)
-
Visitor movements in and out of the segment
-
Visitor session distribution
-
Visitor opinions responses
-
Top products and top product categories
|
|
For some views in the Overview tab, for example, Visitors joining and leaving, we report results over the last seven or thirty days. If your segment is less than seven days old, the reporting period will start from its creation date. |
Segment size
The Segment size card reports the current segment size in real time from the segment start date.
|
|
If you have included historical data, the segment start date will be the creation date minus thirty days or a custom date of your choosing. If not, the segment start date is the creation date. |
In the following example, the segment contains 964,354 visitors, with more than 12,000 visitors added in the last 24 hours:
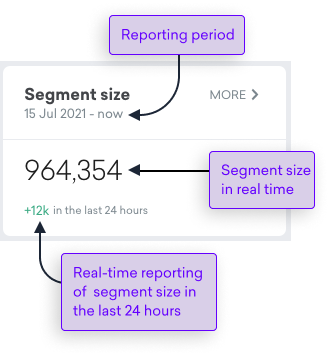
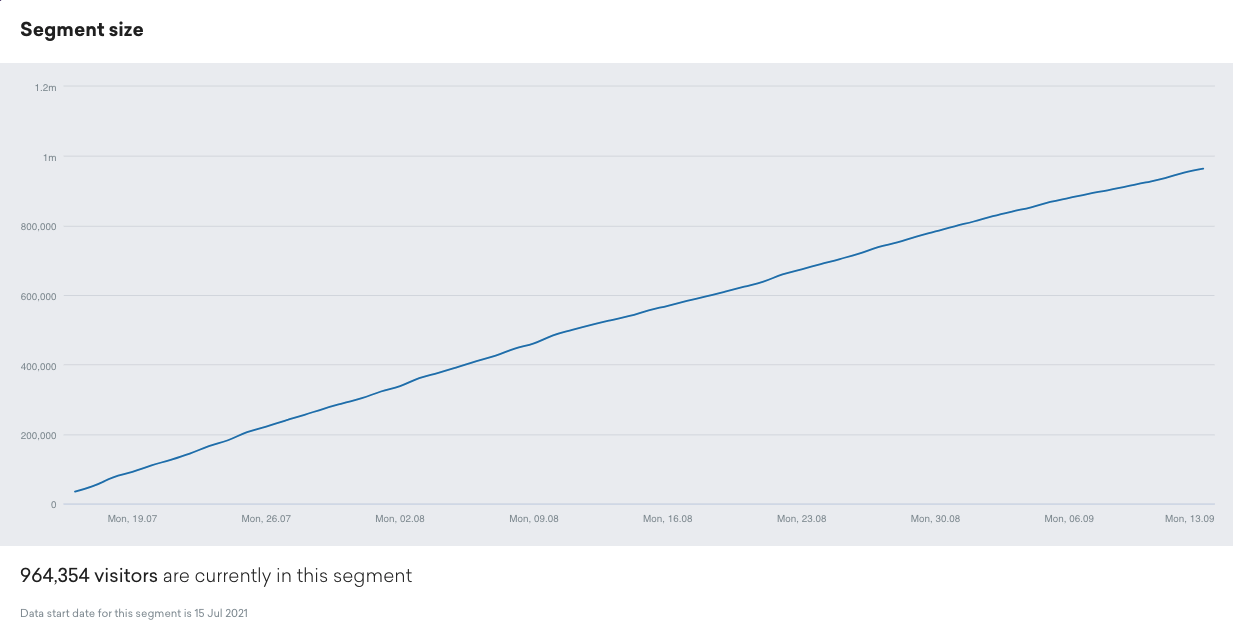
By selecting MORE, you can view a line graph showing the segment size over time:
Common vertical metrics
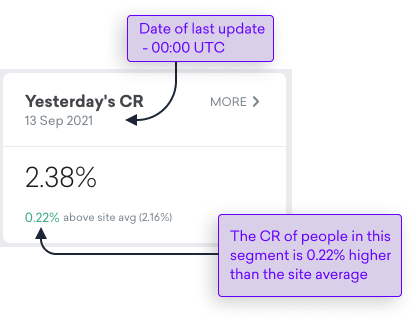
Conversion Rate, Revenue Per Visitor, and Average Order Value metrics for the previous day (00:00 - 23:59) are shown for each of your segments. Let’s look at an example:
Here’s how we calculate each of these metrics.
| Metric | Calculation |
|---|---|
Yesterday’s CR |
Number of converters in the segment divided by the number of visitors in the segment that visited the site yesterday (between 00:00 and 23:49) |
Yesterday’s RPV |
Yesterday’s revenue generated by converters in the segment divided by the number of visitors in the segment that visited the site yesterday (between 00:00 and 23:49) |
Yesterday’s AOV |
Yesterday’s revenue generated by converters in the segment divided by the number of orders completed yesterday (between 00:00 and 23:49) by visitors in the segment |
To get an insight into these metrics over a longer period and discover trends that might help you refine your targeting, you’ll need to widen the reporting period. You can do this by clicking MORE.
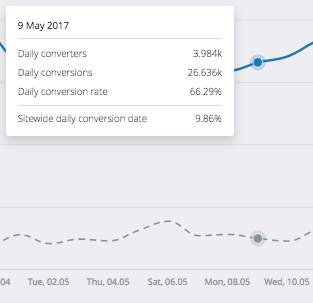
This resulting view provides an easily understandable visual representation of segment performance against site-wide performance and can help spot behavioral trends:
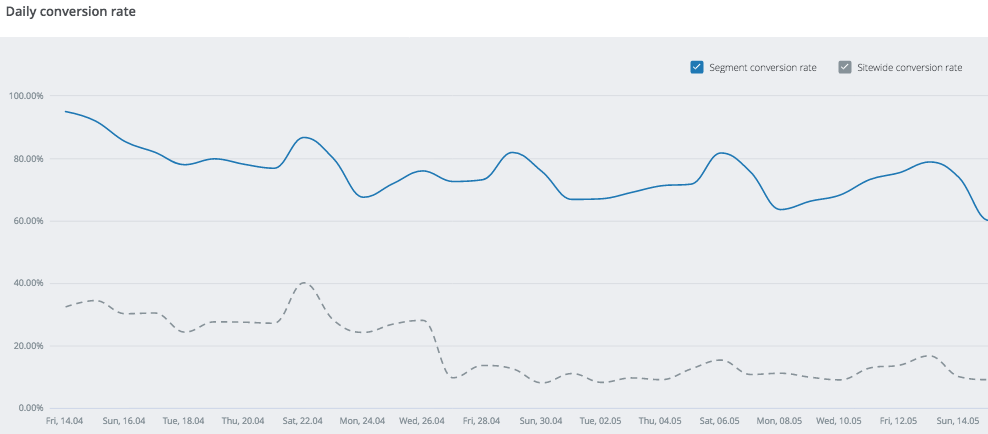
By positioning the cursor over the line, you can see the metrics for any given data point over the last 30 days:
Visitors joining and leaving
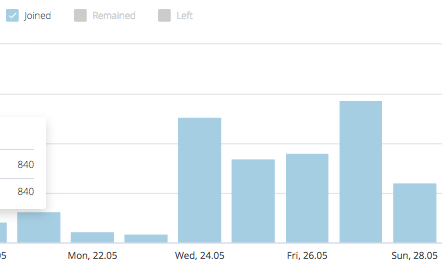
The Visitors joining and leaving panel shows visitor movements in and out of the segment over the last 7 days and last 30 days (or as far back as the segment creation date).
You can isolate the data by Joined, Remained, and Left depending on the information you’re interested in. In the following example, the user has chosen to focus only on the growth in new visitors:
Activity distribution
The Activity distribution over 30 last days panel shows the distribution of session events for each visitor, while in the segment, over the previous 30 days, with a location, device, and session split.
|
|
Note
The given activity metrics report the distribution of visitor sessions within your segments. A visitor could appear in more than one category total if they registered multiple sessions. |
Distribution by location
This view breaks down session events by country over the last 30 days:
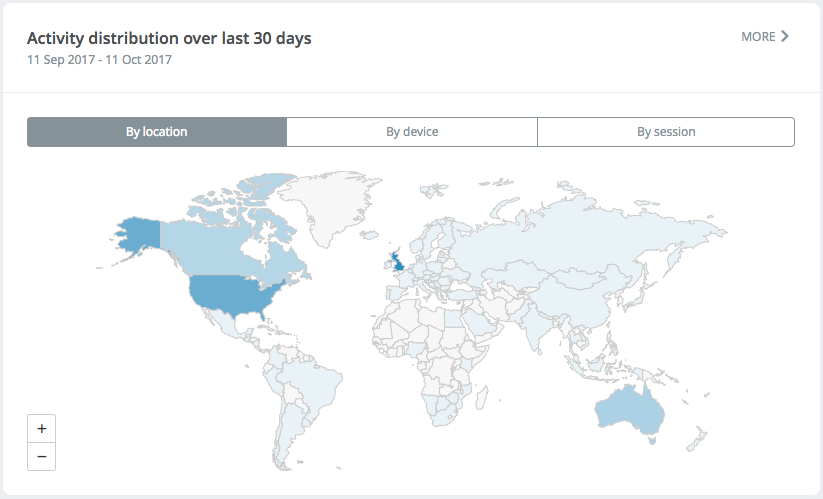
Select  to deep-dive into the relevant data for each country.
Use  to zoom in and out and
  to navigate through the table of results.
Refer to the following table for an explanation of the results columns:
| Column Name | Explanation |
|---|---|
No. of sessions observed |
The total number of visitor session events for visitors in the segment for the reported country |
Percentage of segment’s sessions |
Total session events for visitors in the segment for the reported country as a percentage of the total number of observed session events for all countries |
Percentage of sitewide’s sessions |
Total session events for visitors in the segment for the reported country as a percentage of the total number of observed session events for all visitors sitewide |
|
|
Note
It is possible for segments targeting a specific country to observe a small number of sessions from outside of that country. |
|
|
Note
The action that triggers the movement out of a segment is included in the calculation of metrics. As an example, if a visitor starts a session outside of a country that is targeted by a segment, the session itself is considered the action that prompted the movement out of the segment and is therefore included when working out the country distribution. |
|
|
Note
If a visitor records sessions when located in multiple countries, we will count the individual countries as long as they have a session in each one. |
Distribution by device
This view breaks down the session events by device over the last 30 days:
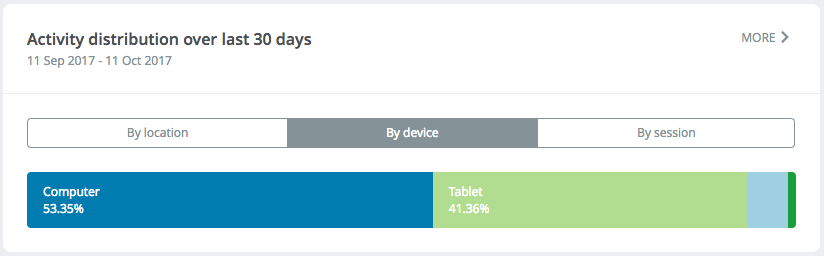
Select to deep-dive into the relevant data for each device.
Refer to the following table for an explanation of the results columns:
| Column Name | Explanation |
|---|---|
No. of sessions observed |
The total number of visitor session events for visitors in the segment for the reported device |
Percentage of segment’s sessions |
Total session events for visitors in the segment for the reported device as a percentage of the total number of observed session events for all devices |
Percentage of sitewide’s sessions |
Total session events for visitors in the segment for the reported device as as percentage of the total number of observed session events for all visitors sitewide |
Distribution by session
This view breaks down the session events by session number over the last 30 days:
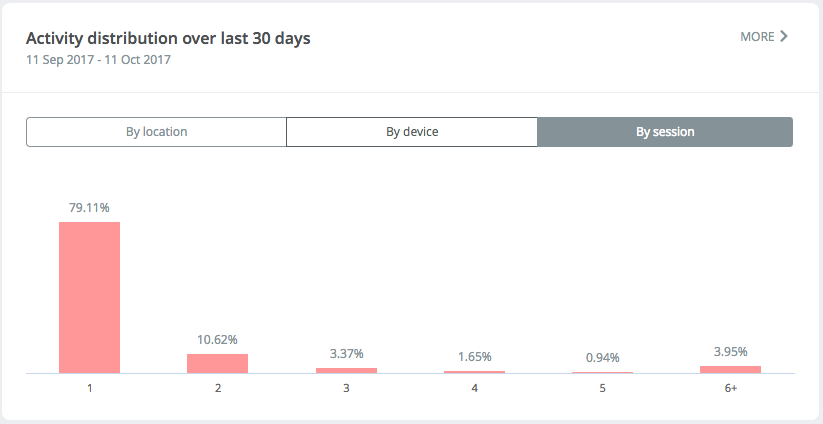
Select to deep-dive into the relevant data for each session number.
Refer to the following table for an explanation of the results columns:
| Column Name | Explanation |
|---|---|
Session number |
Lifetime session number, see below for an example |
No. of sessions observed |
The number of sessions observed for that session number |
Percentage of segment’s sessions |
The number of sessions observed for that session number as a percentage of the total |
Percentage of sitewide’s sessions |
Total number of sessions observed for that session number as a percentage of the total session numbers for all visitors sitewide |
A focus on session number
Visitor A is currently not in the segment Visitors that have browsed t-shirts.
The user’s site session count is 4.
The visitor then browses t-shirts, enters the segment, and has two further sessions.
Sessions numbers four, five, and six are then included in Session number.
Vertical specific metrics
How are these calculated?
Each day, the top 30 viewed/transacted metrics are stored. Depending on the metric, this will be products, categories, or destinations. Anything not in the top 30 will be counted as other.
These daily values are then used to calculate the monthly overview.
|
|
Slight inaccuracies are possible in the calculation of the monthly overview where a product, category, or destination was not in the top 30 for each of the days in the reporting period. |
|
|
If these metrics are not displayed, there may be issues sending product/category/package/betslip related events from your site. When resolving data collection issues, your first port of call is the Validation Dashboard, which will help you identify issues for speedy resolution. |
Ecommerce metrics
Top products over last 30 days
This shows the following information for either products viewed or purchased:
-
The top 5 products
-
The cumulative views/purchases over the last month
Top categories over last 30 days
This shows the following information for either categories viewed or purchased:
-
The top 5 categories
-
The cumulative views/purchases for the last month
Travel
Top destinations over last 30 days
This shows the following information for either destinations viewed or purchased:
-
The top 5 destinations
-
The cumulative views/purchases for the last month
eGaming
Top markets over last 30 days
This shows the following information for either markets viewed or purchased:
-
The top 5 markets
-
The cumulative views/purchases for the last month
Top selections over last 30 days
This shows the following information for either selections viewed or purchased:
-
The top 5 selections