Reporting on abandonment recovery experiences
Reporting on abandonment recovery experiences
In this article, we’ll show you how to find the key metrics for each of your Abandonment recovery experiences so that you can understand the value being driven for your business.
What reporting is available?
For each of your Abandonment recovery experiences, we report the key metrics that will enable you to understand the value that the experience is driving for your business, not only in narrow terms of revenue and conversions but also in the wider context of engagement, for example, understanding the effectiveness of abandonment recovery messaging in getting visitors back to your site.
These metrics will help you answer questions such as:
-
What is the RPV for those visitors that saw the experience? -
Of those visitors that abandoned, how many returned and how many went on to convert?
And help you with higher-level decisions around experience strategies and planning.
|
|
For the highest possible accuracy, it is vital that you emit the required Abandonment recovery events and that you validate your QProtocol setup. |
Getting started
To view the metrics for an Abandonment recovery experience, select Experiences from the side menu and open the desired experience
If you’re interested in the test results for your experience and specifically the performance of an experience as it compares to your control, switch to Results. If you would like to edit the experience, switch to Settings.
Using the Performance summary
The Performance summary card displays the key revenue and engagement metrics for your Abandonment recovery experience over the last 28 days.
For each metric, we provide a brief explanation in the form of a tooltip. Refer to the following tables for additional details.
Revenue
| Key Metric | Type | Description | Sub Metric | Value Reporting |
|---|---|---|---|---|
Attributed revenue |
Currency |
Total revenue attributed to visitors over the 28-day period that received an abandonment message and completed their order within 28 days |
% of site-wide revenue attributable to the experience |
Revenue driven by contacting site abandoners |
Attributed transactions |
Integer |
Total transactions attributed to visitors over 28-day period that received an abandonment message and completed their order within 28 days |
% of total site-wide transactions attributable to the experience |
Transactions driven by contacting site abandoners |
Revenue Per Visitor |
Currency |
Total Revenue Per Visitor over the 28-day period for visitors that received an abandonment message |
Uplift compared to RPV for all site visitors |
Uplift in RPV from contacting site abandoners |
Revenue Per Converter |
Currency |
Total Revenue Per Converter over the 28-day period for visitors that received an abandonment message |
Uplift compared to RPC for all site visitors |
Uplift in RPC from contacting site abandoners |
Engagement
| Key Metric | Type | Description | Sub Metric | Value Reporting |
|---|---|---|---|---|
Messages sent |
Integer |
The total number of abandonment messages that were sent over the 28-day period |
The effectiveness of Qubit’s Abandonment recovery technology |
|
Returning abandoners |
Integer |
The total number of visitors over the 28-day period that received an abandonment message and activated a new session within 28 days of receiving the message |
The effectiveness of abandonment messaging in getting abandoners back to your site |
|
Converting abandoners |
Integer |
The total number of visitors over the 28-day period that received an abandonment message, activated a new session, and then transacted within 28 days of receiving the message |
The effectiveness of abandonment messaging in getting abandoners to complete their order |
For several metrics, we provide further context through a sub-metric. This either reports the impact of an experience as a percentage of the total site-wide metric, as seen in this example:

Or a percentage uplift, compared to the site average, as seen in this example:

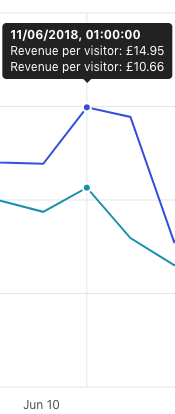
To the right of each metric is a line graph showing the selected metric over the entire 28-day period. By positioning the cursor over the timeline, you can see the metrics for any given data point over the reporting period:

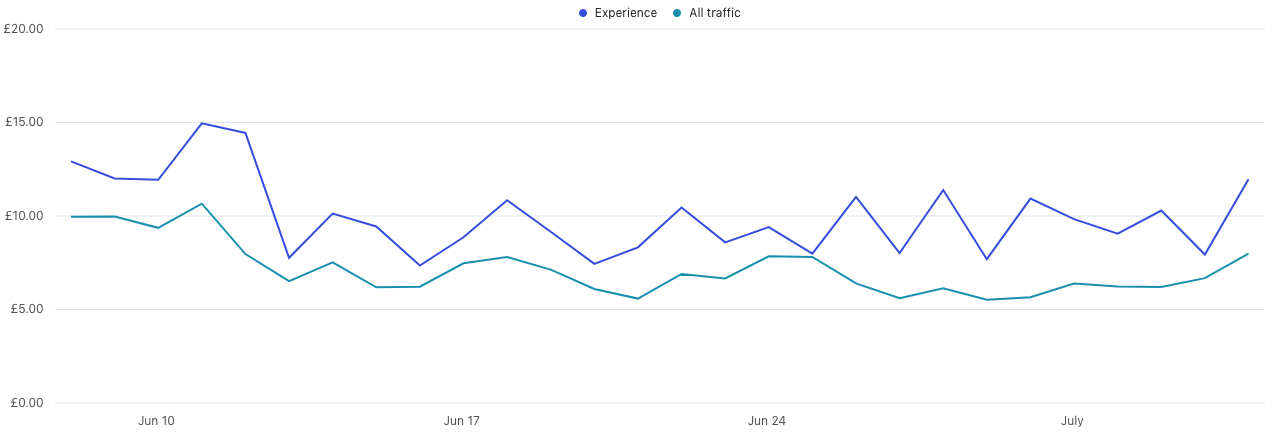
For several metrics, the line graph shows distinct lines for both the experience and your site’s accumulated traffic.
In the following example, we can see the RPV for an experience and the same metric for all your site’s traffic. The difference between the 2 lines represents the value driven by the experience:

A lightbulb moment
To really drive home the value that your experience is delivering, we present a key headline above the Performance summary card.
In the following example, we see that an experience drove 16.19% of total revenue over the reporting period:

Navigating through the metrics
Metrics are displayed in 1 or more pages.
Navigate through these pages by selecting  and
and 