Single event validation
Single event validation
|
|
We strongly recommend that all new Commerce implementations use the Event Protocol to log events. |
This article explains how to use your browser’s developer tools to validate that each event sent to Coveo Analytics has the correct payload.
Use developer tools for client-side request verification
Event payloads can be validated by inspecting the requests sent to Coveo Analytics from your browser.
You can quickly pinpoint and troubleshoot any potential implementation issues by examining the payload of the request sent to Coveo’s backend and identifying instances where data should’ve been sent but wasn’t. This step is critical to ensuring your data tracking script functions as expected, providing reliable data for reporting and your Coveo Machine Learning models.
Access developer tools
-
Open your web browser’s developer tools.
 Note
NoteThis article uses the Google Chrome developer tools. For browser-specific information, see:
-
Select the Network tab.
With the Network tab open, you can now inspect all outgoing requests your site sends out.
Monitor network requests
The following image showcases a screenshot of the Network tab using Chrome’s developer tools when inspecting a collect event.
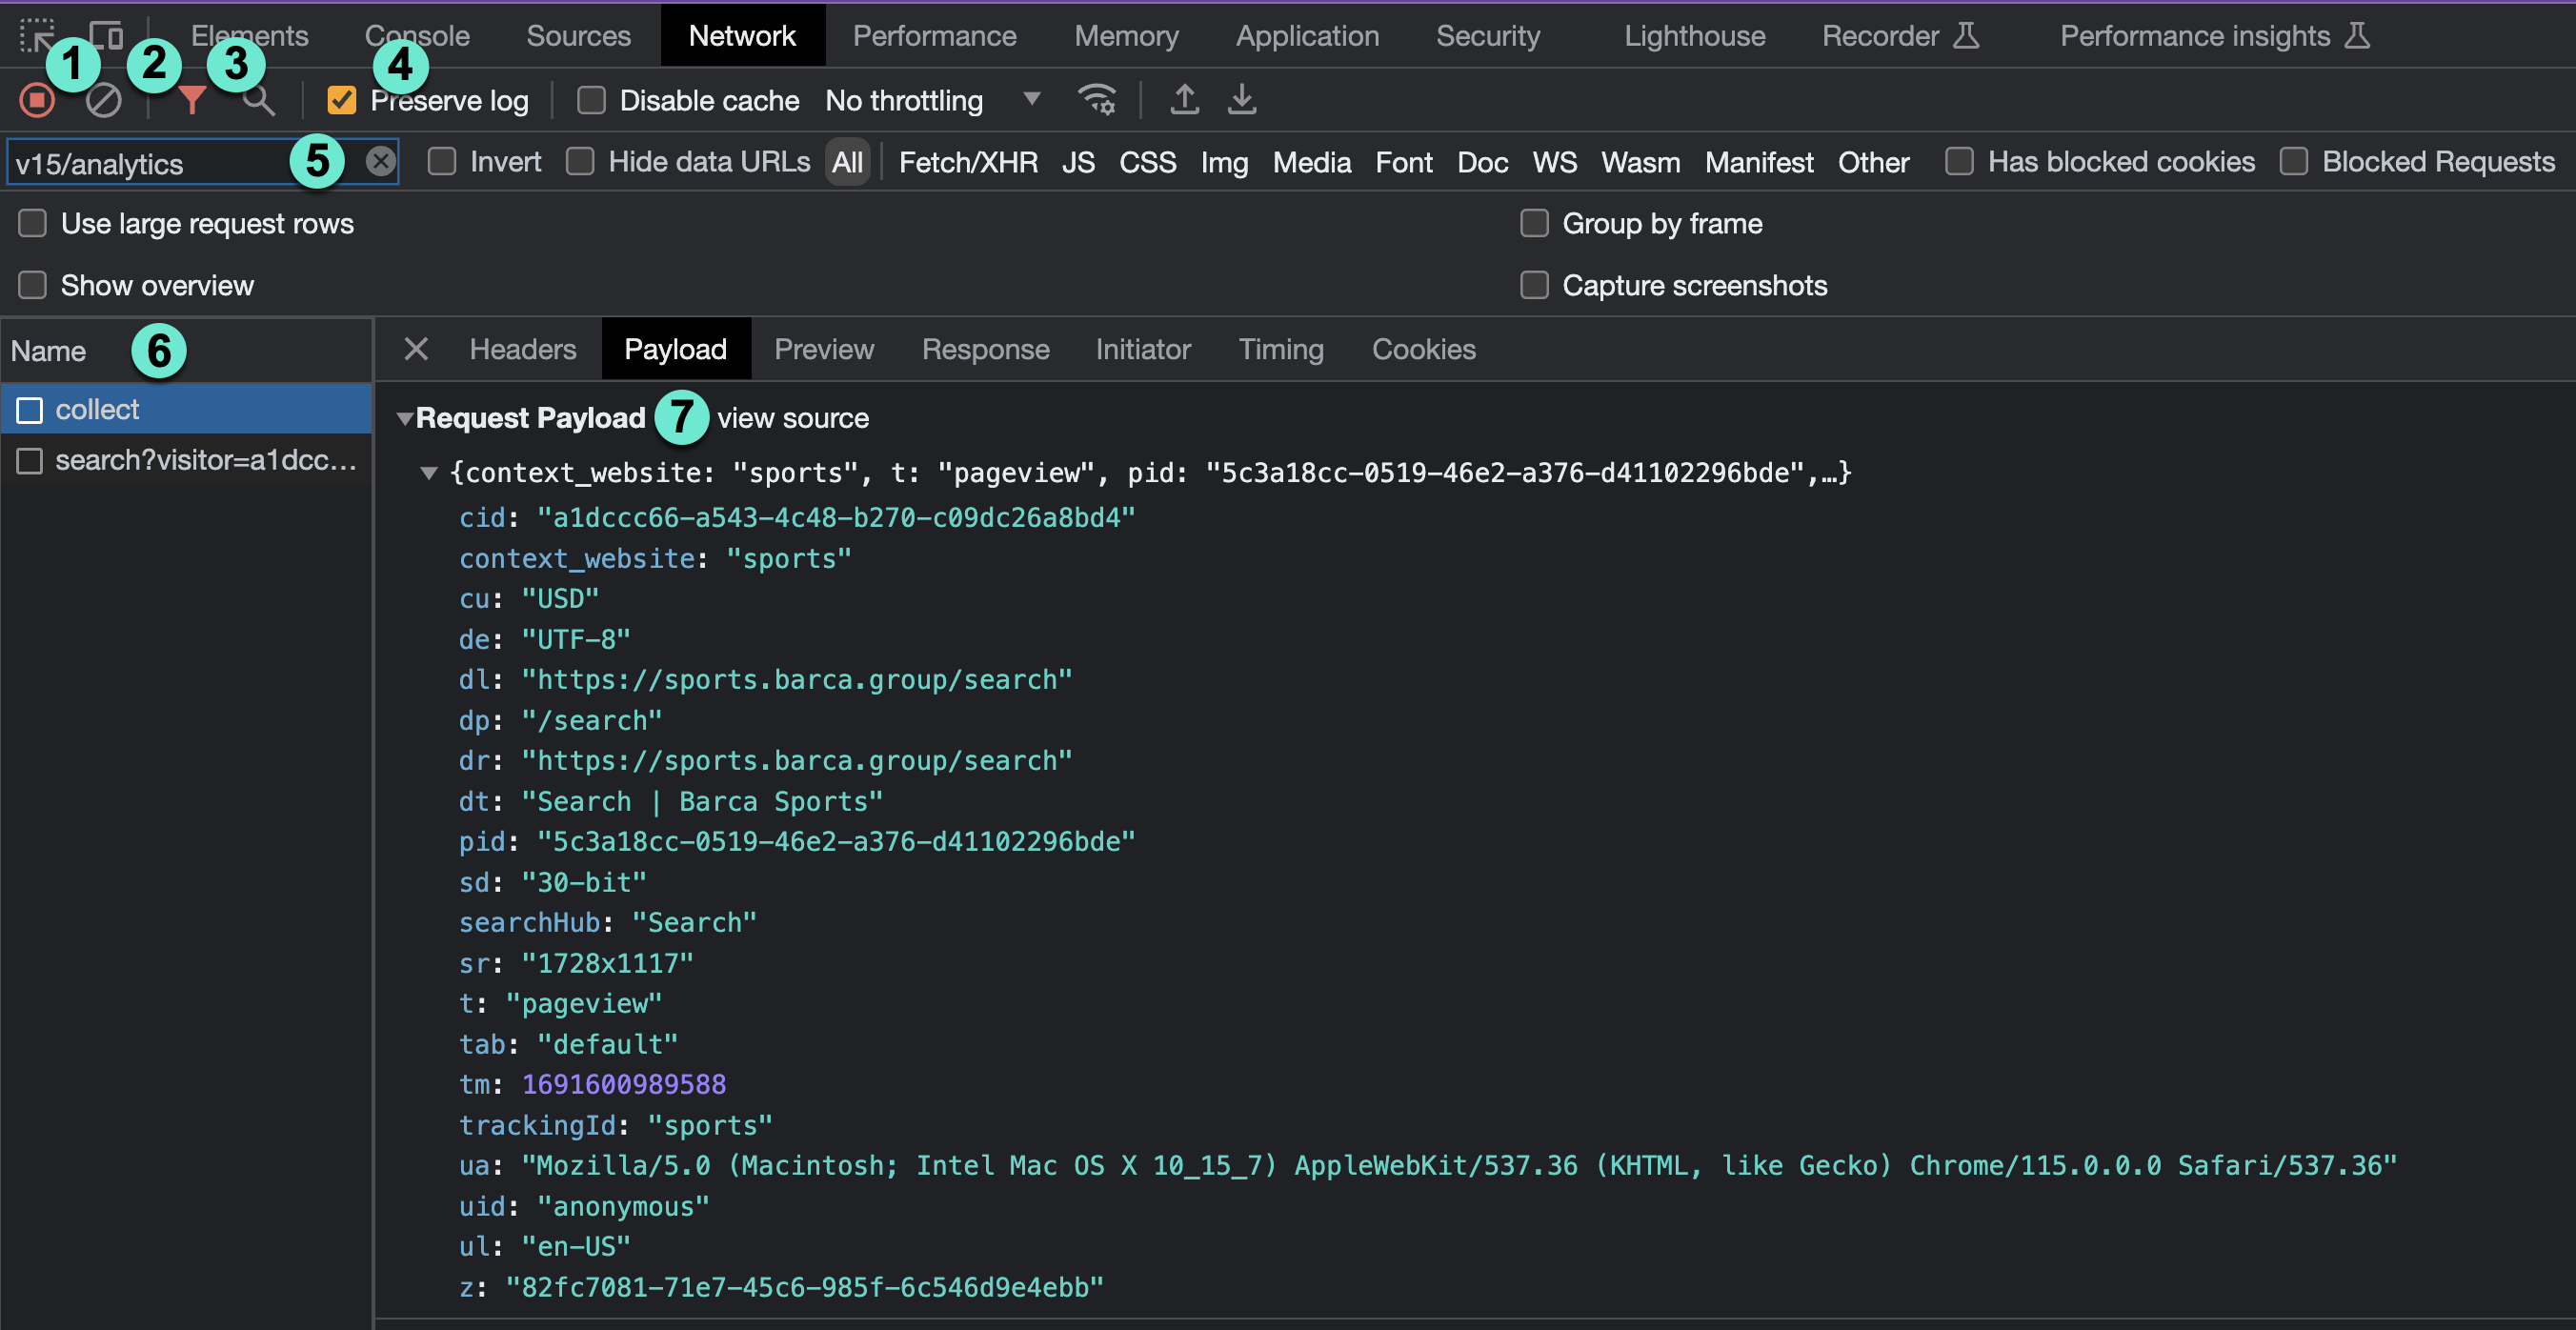
Though the interface appears complex, only a few key elements are relevant to our task:
1 Record network log: When activated (indicated in red), this button logs all requests made from your webpage. If it’s not activated, click the button to start logging requests.
2 Clear button: This button clears the entire log of previously recorded events. After the log is cleared, all newly recorded events are added.
3 Filter: Activating this button (shown in red) enables a sub panel, which allows you to select specific destinations for messages. As we primarily want messages sent to Coveo’s backend, ensure this button is activated.
4 Preserve Log checkbox: Checking this box ensures the message log is maintained, even when you navigate to a new page. If it’s not checked, the message log will be cleared whenever a new page is visited. For this reason, keep this box checked.
5 Destination Filter box: This input field allows you to type in part or the whole of a URL to monitor its traffic.
Given our interest in requests made to Coveo, input v15/analytics in this box.
6 List of messages/requests: This list displays all outgoing requests in chronological order, with the most recent ones at the bottom. Each request is accompanied by its destination URL.
7 Content of each message: The content of each message can be viewed by clicking the corresponding event in the message list. Pay close attention to the Payload tab, which displays the message content. Each message comprises a set of keys (indicated in purple) and values (indicated in red).
Verify requests sent to Coveo
The next step involves validating that the correct network request is being sent for each implemented event type. This verification process ensures that the correct data is being sent for each user interaction and event.
To perform this check:
-
Open your application.
-
Initiate a user action that should trigger an event (for example, clicking a product). This action should prompt a network request.
-
Open the Network tab in your Developer Tools and inspect the payload fields of the outgoing request. Verify that the accurate values are transmitted through the corresponding Coveo Analytics parameters by referring to the specific validation section for each of the subsequent events: