Post-experience analysis
Post-experience analysis
In this article, we’ll discuss how you can use post-experience segmentation to get highly granular data on the impact of your experiences.
What is it?
Post-experience segmentation allows you to understand the effects of an experience on end-user behavior, in a highly granular way, by breaking down experience results into the following important visitor attributes:
-
Device type (computer, mobile, and tablet)
-
New vs. Returning visitors. See Qubit’s Experience Attribution Model for further details
-
Country (top 3 by traffic volume, based on visitor public IP address)
|
|
Note
Post-experience segmentation does not work for draft or archived experiences. To get segmented results for an archived experience, you’ll need to unarchive it. |
|
|
Note
Post-experience segmentation does not work for experiences launched before January 1st, 2017. |
Starting post-experience segmentation processing
Select Experiences from the side menu and select an experience from your Live or Paused list to open it
Navigate to the Results tab and select Start processing

The following message confirms that processing has started:

|
|
Note
Results can take up to 15 minutes to process but ultimately the processing time depends on how many days have passed since the last time results were processed and how much data there is to process. |
|
|
Leading-practice
You do not need to stay on the Experiences page—you are completely free to continue working in other parts of the platform. |
Visitor attribute results ready will display beneath the experience’s name in your various lists of experiences when results are ready.
In the following example, we see that two experiences have attribute results that are ready to be viewed:

|
|
Post-experience segmentation results will remain available for 12 hours.
Beyond that point, we’ll notify you that the results are out-of-date: |
Viewing results
Results for the visitor attributes mentioned above are generated for each of your experience’s goals.
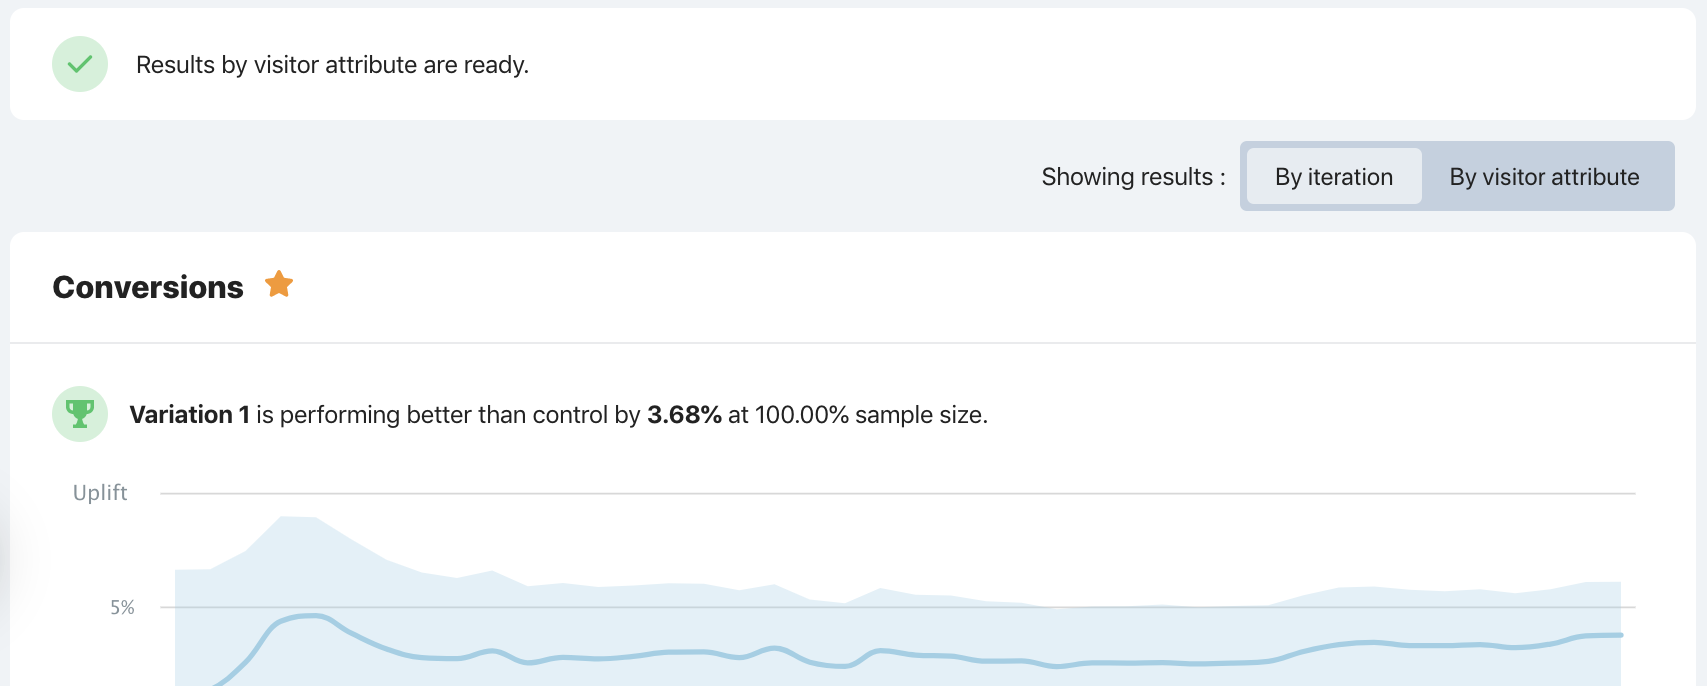
Start by navigating to the Results tab. Then select By visitor attribute above one of goal cards. You can toggle between regular and segmented views of your test results:

In any goal of your choice, select one of the groups of visitor attributes mentioned above to expand it, and then select the visitor attribute you’re interested in to see the results
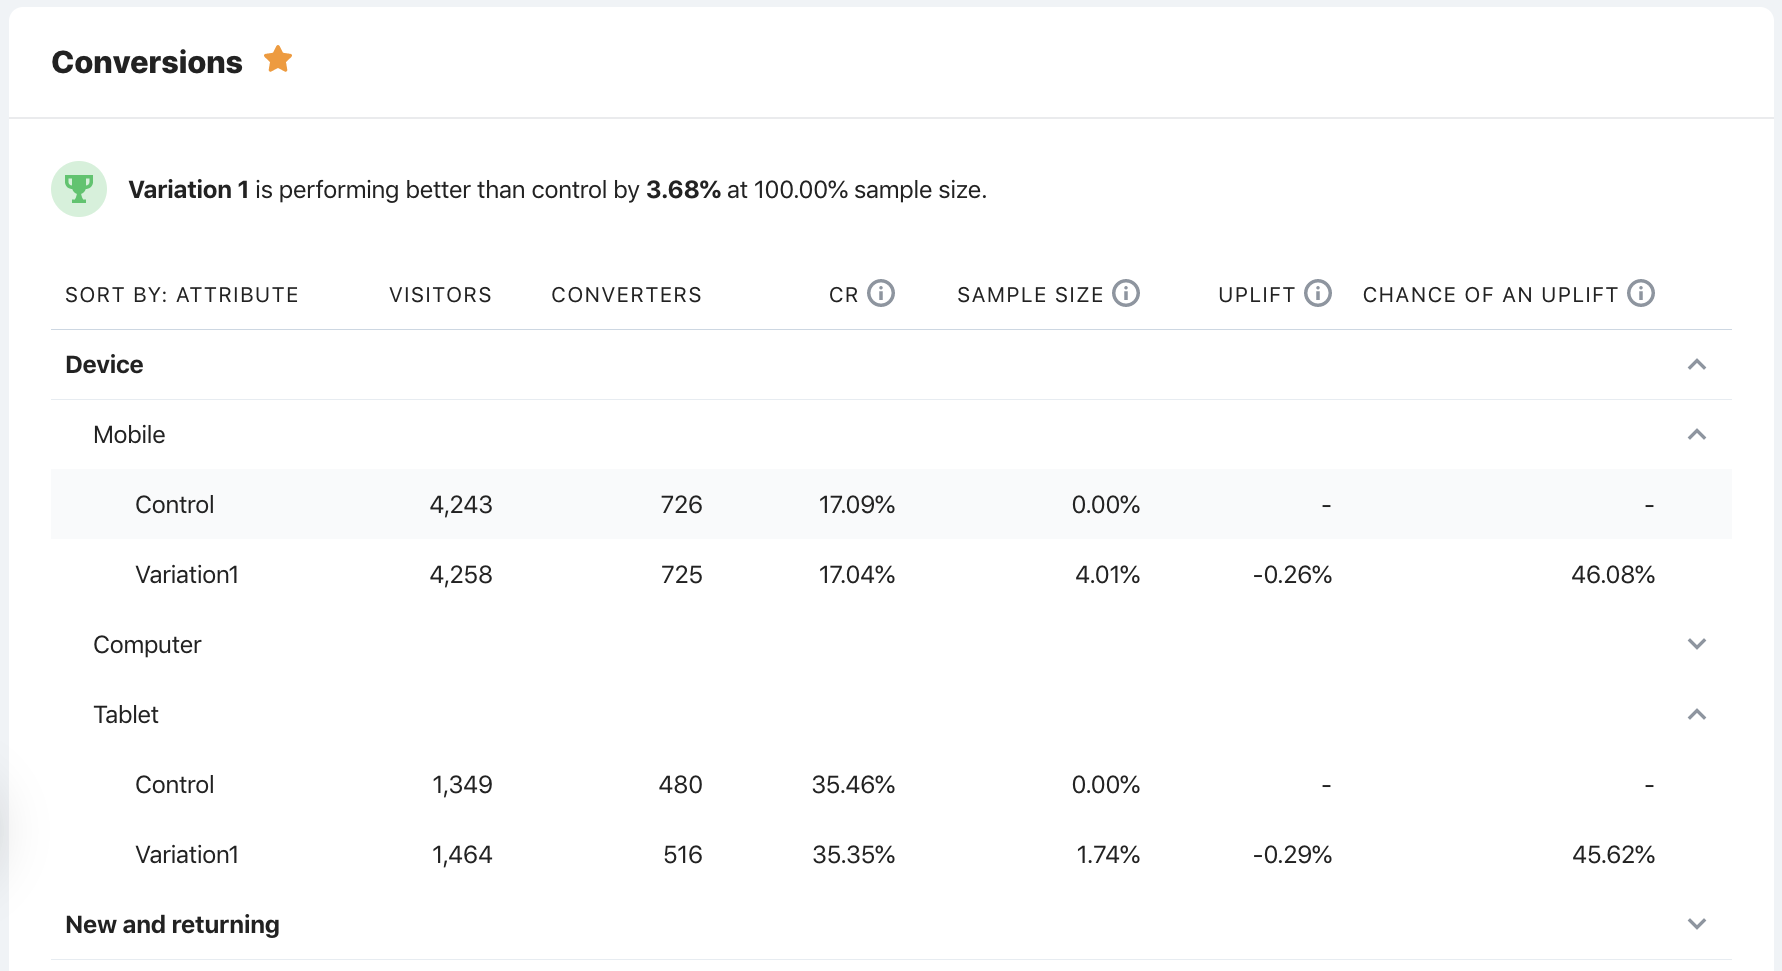
The raw data and analysis results for the control and each variation are presented as a table. In the following example, the user has chosen to view results for the mobile and tablet segments of their conversions goal:

Interpreting segmented results
Declaring a winning experience
There is a small subtlety around declaring a winner in a segmented A/B/n test.
If you were to segment an A/A test’s data using 20 randomly generated visitor attributes, by chance you would expect to see, on average, one experiment with a probability of an uplift above 95%, even though these segments are random and meaningless.
The same is true for meaningful segments, so you must account for the fact you’re testing multiple hypotheses, and this must be done in a principled way.
The simplest thing to do is to adjust the threshold at which a winner is called, based on the number of segmented tests that are being performed simultaneously. Accordingly, Qubit only declares a segmented test a winner when it reaches a 99.5% probability of an uplift.
What is the attribution model in Post-experience segmentation?
See Qubit’s Experience Attribution Model for a detailed discussion as well as practical examples of how attribution is derived.
