Derived datasets
Derived datasets
In this article, we’ll introduce you to Derived datasets and how they can be used to power business insights for supercharged personalizations.
What is a derived dataset?
A derived dataset (DD) uses the power of SQL to query and aggregate any data points we’ve collected or ingested for your property or data you’ve imported yourself through a manual or programmatic import.
By combining raw data points, Derived datasets can generate meaningful and useful business insights in a way that those data points by themselves cannot.
Once created, the resulting dataset can be used to power experiences, segments, and analysis.
Common uses
Derived datasets are already being used by Qubit customers to power one-to-one personalizations and drive conversions. What’s more, to help you get started, we’ve built several dd-based models that can be used off-the-shelf:
Stock replenishment
Focusing on the higher conversion rates of repeat purchasers, a Derived dataset can be created to re-target users when products they have previously bought are due to run out.
This can be achieved by ingesting the number of replenishment days per product–the number of days that typically elapse between a product being purchased and then re-purchased–and then building a query to predict when a user’s supply is due to run out.
The result is then used to inform the user, on return to a site, how many days are left until their products run out.
Size preference
In another example, we could create a Derived dataset to pre-select the size in each product category based on a user’s previous browsing and purchasing behavior.
For each user, a SQL query is run every 6 hours to produce a dataset of a compound key of context Id, category Id, and the value of the last purchase. This dataset is then used in an experience on product detail pages (PDP) to preselect the size for each individual user.
Getting started
Select Data tools > Import from the side menu, and then switch to the Derived data tab
Opening an existing dataset
On opening, you’ll find a list of your Derived datasets, including a timestamp that indicates the last time data was ingested into the import and the schedule that determines how often your SQL query is run to pull data into the dataset.
|
|
|
When you open a dataset, you’re presented with key information, organized into three tabs:
-
Preview: Shows a preview of the data imported using the query.
-
Details: Activity associated with the dataset:
-
In Query we show the SQL query used in the dataset.
-
In Import activity, you can see details of each data import since the creation of the dataset.
-
In Info, you can find the dataset Id. When using the Import API to use imported data in an experience, you’ll need to pass this Id in your
GETrequest. -
in Lookup Access, we provide the namespace and endpoint for the import. This information can be used to query the import using the Import API. You can copy the endpoint by selecting
 and then paste it into a browser window, replacing
 id=<key>with an actual key from your import. -
In Live Tap Access, you can find the project and table name for the imported data; you’ll need this information to explore the data in Live Tap.
-
-
Schema: Shows the import’s schema, including, importantly, which fields in the schema are available for lookup.
Creating a new dataset
To create the dataset, select New import in the list view and select Derived data
Developing the query
|
|
The results from a query can’t exceed 20 columns. |
To develop the query, you’ll use three panels. To the left, you’ll find quick access to the data that you can build you queries from.
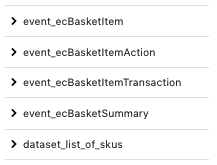
This includes all the QP events emitted by your property, any imported datasets, and, if you’re using Live Tap, the Live Tap Business Views. In the following example, we see that the user can choose from a number of events and an import called datasetlist_of_skus_:

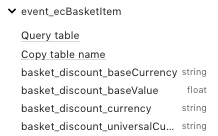
To get details of the fields and field types in each one, simply select it:

From this view, you can query the table, copy the table name, or select the field to use in your query.
The top panel is an editor that you use to develop your query using Standard SQL. All the usual grouping, joining, and aggregation can be done to derive insights from the data held in Qubit. You can find more information about Standard SQL in Standard SQL Functions and Operation.
Once you’ve done this, you can run the query. The results are shown below the editor.
In the following example, the user is building a query to identify the latest stock for all products as the basis for a low stock experience:
WITH stockData AS
 ( SELECT product_productid, product_stock,
 row_number() OVER(PARTITION BY product_productid ORDER BY meta_serverts DESC) RANK
 FROM `qubit-client-36902.kn8__v2.event_ecProduct`
WHERE meta_serverTs >= timestamp_sub(current_timestamp(), INTERVAL 24 hour)
  AND meta_ts >= timestamp_sub(current_timestamp(), INTERVAL 24 hour))
SELECT * EXCEPT(RANK) FROM stockData
WHERE RANK = 1
Running your query and getting results
Once you’re happy with the query, you can test it by running it. To do this, select Run query.
Assuming that the query doesn’t contain syntax errors, the results of your query will be shown in the Results panel.
SQL helper methods
We’ve added a few helper functions to streamline the writing of SQL. These are optional, but should make the final query more compact and succinct, and are able to handle common tricky tasks such as JSON generation.
ms
Converts a human-friendly duration into milliseconds using parse-duration JavaScript library, useful for decorators and interval comparisons.
Example:
{{ms "5m 3 seconds"}} -> 303000
eventTable
Returns the full project, dataset, and table identifier string for a given event type, including QP namespace, if relevant.
The function will also optionally replace % with the vertical.
Example:
{{eventTable "%View"}} -> qubit-client-12345:demo.event_ecView
groupAsJson & concatForGroup
A common use case for Derived Datasets is to compute, for every user, a collection of attributes keyed by some other entity. For example, a mapping of user Ids to their most visited categories, including how many times they have viewed each one.
Since we only allow one row per primary key, user Id in this case, this Derived dataset query requires concatenating the collection into a single field in a single row. Using the example above, you would end up with a column of user Ids and a column of arrays of categories with a view count.
This is very hard to achieve in BigQuery, even more so in legacy SQL syntax.
The groupAsJson and concatForGroup function attempt to make this easier and require less boilerplate by using a UDF to combine the collection into a JSON array of objects.
groupAsJson generates a unique UDF function according to its input.
It accepts 3 props:
-
groupFields: A comma-separated list of fields that should be present on the row without any concatenation (that is, is already a single scalar value). AllgroupFieldswill be cast to strings. -
rowFields: A comma-separated list of fields that have been prepared with the following:-
concatForGroupand now require reformatting into an array of JSON objects. -
rowsKey: The output field name for the array of JSON objects. This is optional and defaults to rows.
-
-
concatForGroupis used to prepare data for grouping. Underneath it’s doing a group concat with a special delimiter. It accepts 2 arguments:-
The first is the source of the group data, for example, a field
-
The second is used for naming the concatenated column, for example, the
ASclause
-
The example below produces a single row per context Id, where the second column is an aggregation of all the meta_ids of ecView events for that context Id:
SELECT
  context_id,
  event_ids
FROM ({{ groupAsJson groupFields="context_id" rowFields="event_id" rowsKey="event_ids" }}(
  SELECT
    context_id,
    {{concatForGroup "meta_id" "event_id"}}
  FROM [{{eventTable "ecView"}}]
  GROUP BY 1
))
Example output:
{
  "context_id": "1478101023161.686953",
  "event_ids": "[{\"event_id\":\"du3ftgry988-0iv1393cq-a59g4kg\"},{\"event_id\":\"r20oxngl51c-0iv136qoj-z8ifptc\"},{\"event_id\":\"phaf4jr0n0w-0iv148xwz-km6ah1s\"},{\"event_id\":\"h6f2qd45ugo-0iv13d6mb-lih8lcg\"},{\"event_id\":\"c23ur5k0kvs-0iv13dq7s-24rfqi8\"}]"
}
Variables
As well as helper methods, the following are available as plain variable values:
-
trackingId
-
clientId
-
vertical
-
namespace
Saving the dataset
Once you’ve developed your query, and you’re happy with the results, you can save the dataset. You must do this before adding a schedule.
Select Save
Add a name to identify your dataset. We recommend you use a name that identifies the purpose of the dataset
|
|
Note
You can’t edit the name of the Derived dataset once you confirm the setup. |
You must now choose a schedule to define how often the query is run. Your schedule can be either daily or weekly
In the following example, the user has chosen to schedule the query to run every week at 09:00 on Monday, Wednesday, Friday:

|
|
Note
You can also specify whether to make fields available for lookup. Only fields available for lookup can be used when building experiences. To do this, select the AVAILABLE FOR LOOKUP toggle for each field in Lookup and then Enable lookup in the modal window. |
Finally, select Confirm. This will initiate the data import into the dataset. Once this is complete, you can start to use the data in your experiences and segments
Error reporting
As mentioned earlier, in your list of datasets,  will display when an error was encountered the last time data was imported into the dataset.
You can get more details by opening the dataset and looking in the Details tab.
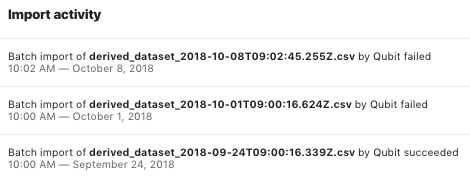
In the Import activity panel you’ll find details of each of the data imports into the dataset.
In the following example, we see that the last two imports failed:

Typically, failure is caused by problems in one of Qubit’s internal services. If you see two consecutive failures, we recommend to contact Coveo Support.
FAQs
Are there any limitations on the size of derived datasets?
Yes. A dataset can’t have more than 20 columns or exceed 10GB in size.
What data can be used to build a derived dataset?
You can query the data held in any of your property’s BigQuery tables, imported datasets or other derived datasets to build your dataset.
What can I do with the data returned by a derived dataset?
How you use the data returned by your Derived dataset query depends on your personalization goals.
One option is use the data returned by your query to create new or enhance existing segments and target those segments with hyper-relevant personalized experiences. See Using imported and derived data to create segments for more information.
A more powerful and flexible option is the Import API, which can deliver one-to-few and one-to-one personalizations that target small subsets of visitors, and even individual visitors, based on behavioral patterns and interactions. This approach offers a greater connection between online and offline campaign messaging than can be achieved with segments.
One of the most powerful features of the API is that it provides an endpoint that can be directly called in an experience to target visitors. It supports complex data types and per field filtering.
Can I edit a derived dataset once it has been set up?
To an extent, yes.
Once you confirm the setup of your Derived dataset, you can change the SQL code that generates the output fields and the schedule but you can’t change its name, whether fields are available for lookup, or alter the names or types of columns output by the query. These restrictions are a consequence of the BigQuery dataset functionality, which doesn’t allow such changes.
It’s however possible to edit any aspect of a Derived dataset and save it with a new name; previous names can’t be re-used. If you do this, please delete the original dataset as soon as you no longer require it.
