Review and manage dashboards
Review and manage dashboards
- Leading practices
- Access a dashboard
- Rename a dashboard
- Set a date interval in which to review data
- Add a global dimension filter to refine data
- Manage global dimension filters
- Manage dashboards
- Add a section
- Add a card
- Manage sections and cards
- Manage tabs
- Move content from one dashboard to another
- Change the time series card interval
- Review dashboard activity
- Required privileges
As a member of the Administrators or Analytics Managers built-in groups, you can use the Reports (platform-ca | platform-eu | platform-au) page in the Analytics section of the Coveo Administration Console navigation menu to review the data collected by Coveo Analytics. The data that you can review may be limited by your permissions.
After creating a dashboard, you can add tabs, sections, cards, and filters to report only on the desired Coveo Analytics data and organized in the desired structure.
|
|
Note
Figures shown for metrics in the Coveo Administration Console reports may differ from those for the same metrics in Commerce Advanced Reports and Coveo Merchandising Hub (CMH) reports. These discrepancies typically occur because different reports use distinct filters and processing rules when calculating figures for the same metric. Here are the most common reasons for differences between reports:
|
Leading practices
When managing Coveo Analytics reports, consider reporting limits by following these tips to improve report loading time:
-
Computing statistics such as trends and unique counts (for example, Unique Client ID) takes time, so consider excluding unnecessary metrics and trends from report cards.
-
Select a report period that only includes the data you need. A wider date range (for example, months versus weeks) means more data to sort through and compute.
-
View your report at least seven days after the end-of-month as you may see differences in your data from when you view a report on the first day of the month as opposed to a few days later. This is due to additional changes that occur within the first few days following the end-of-month, where click events are subsequently associated with search results.
-
Reduce the number of cards in the same tab by reorganizing your report. A high number of cards means many API calls at the same time, which can increase the report loading time.
-
Use trend cards with caution. Trend cards are the most costly, in performance terms, so reports containing many cards of this type take a longer time to load.
-
Review the complexity of the report filters:
-
Including the Advanced Query Expression dimension in a filter has a high performance cost. Therefore, use custom dimensions instead since they remove the need for filtering on Advanced Query Expression.
-
Filtering with the Contains or Does not contain operators and a list of values such as usernames or client IDs takes a longer time to compute.
-
"Exact match" filters (using the Is or Equals operators) are better performing than "contains" filters.
-
named filters don’t improve report performance.
ExampleApplying a named filter that contains five filters is the same as adding those five filters individually on a report.
-
Adding a large number of filters to group users can significantly impact the report’s performance.
-
Access a dashboard
-
On the Reports (platform-ca | platform-eu | platform-au) page, click the desired dashboard, and then click Open in the Action bar.
-
When you want to keep your changes, enter Edit mode:
On the dashboard page, click Edit in the upper-right corner.

Changes that you made prior to accessing Edit mode are kept. Therefore, you must remove these changes (if unwanted) before saving the dashboard.
Rename a dashboard
-
In Edit mode, change the dashboard name by clicking and editing the original name in the upper-left corner.
-
(Optional) Enter a dashboard description by clicking and editing the original description.
-
Click Save.
Set a date interval in which to review data
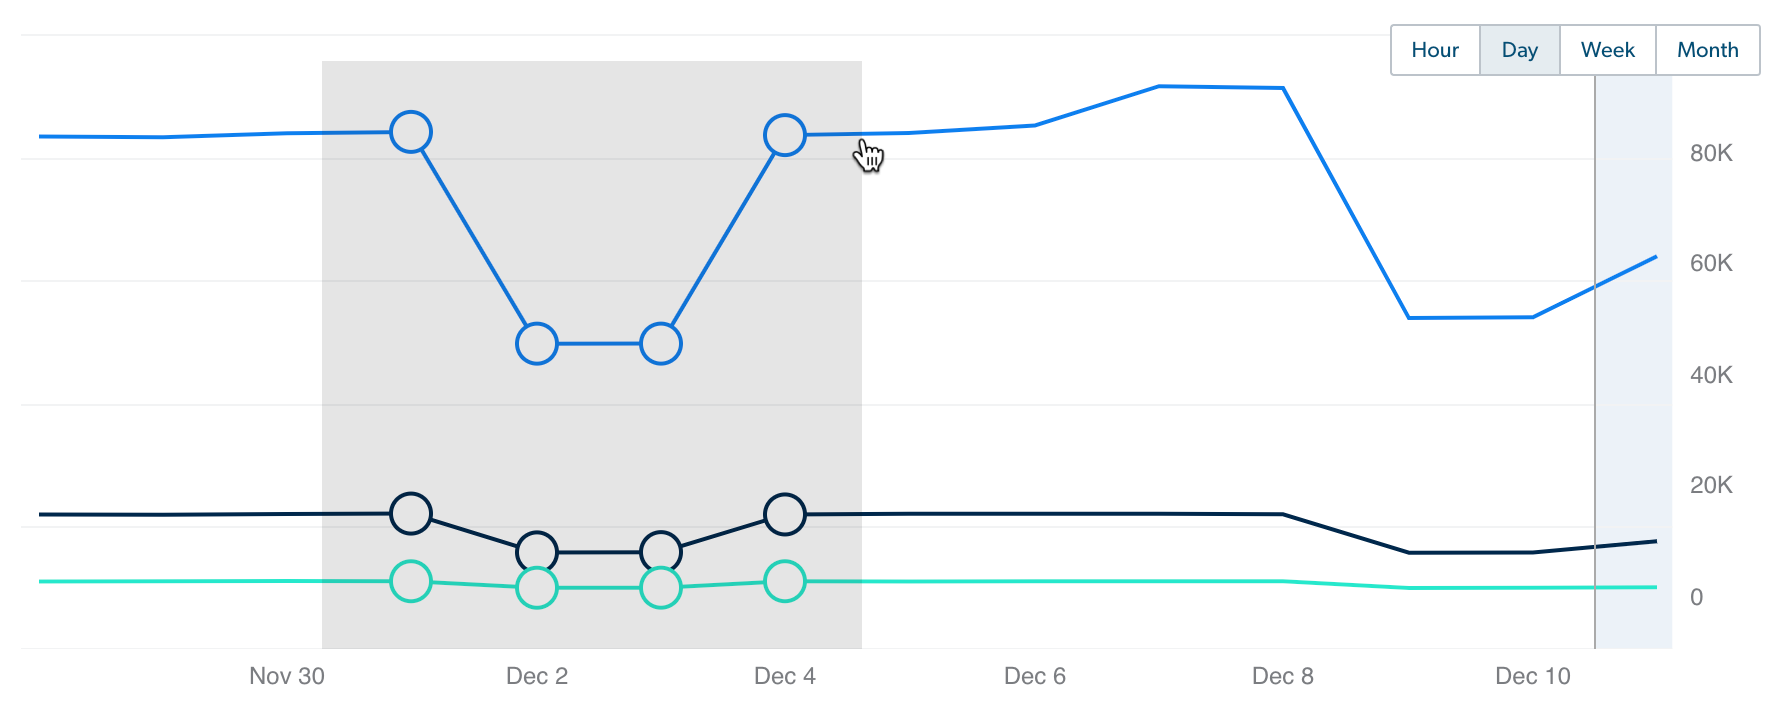
Method 1: Select a diagram area
In any time series card, click and hover over an area. All the data shown in the report will match the selected period.
This feature is useful when you notice a period where there was an unexpected change for one or more metrics.
Method 2: Pick a date range
In the upper-right corner of the window, click the box containing the current date range to access the Report Period dialog, and then select the date range you want to review.
Method 3: Switch date intervals
In the upper-right corner of the window, you can go from the current date interval selected (last week, month…) to the previous period or next period by clicking ![]() and
and ![]() respectively.
respectively.
|
|
Note
You can select a period that’s incomplete (for example, the current month), in which case your date range selection will always include the latest available events until the period ends (for example, the first day of the following month). For example, you’re reviewing data per Month and want to see how statistics are trending for the first two weeks of the current month, so you click |
Add a global dimension filter to refine data
Access the dialog to add global dimension filters by clicking ![]() .
.
Manage global dimension filters
Add a named filter with current global dimension filters
-
At the upper-right corner of the top bar, click
 , and then select Save filters as….
 -
In the Save as a Named Filter dialog, enter a Filter name.
-
Click Save. The named filter is now applied to the report.
Edit a global filter configuration
-
On the top bar, click the global filter label.
-
Make your changes.
-
Click Save.
Enable and disable global filters
Next to the global filter label, click ![]() , and then select Enable or Disable.
, and then select Enable or Disable.
Reverse the global filter operator
Next to the global filter label, click ![]() , and then select Reverse operator.
, and then select Reverse operator.
Remove a global filter
Next to the global filter label, click ![]() , and then select Remove.
, and then select Remove.
Remove all global filters
At the upper-right corner of the top bar, click ![]() , and then select Delete all filters.
, and then select Delete all filters.
Manage dashboards
Export and import a complete dashboard configuration
-
At the upper-right corner, click
 , and then select Copy to clipboard.
 Notes
Notes-
The Copy to clipboard option is only available outside of Edit mode.
-
This feature is useful when you want to export your dashboard configurations from your staging environment to production without having to recreate all your dashboards manually.
-
The configuration is exported in JSON format.
-
-
Copy the dashboard configuration.
Depending on your browser compatibility with the copy/cut feature of the
execCommandmethod:-
When your browser supports the feature, the configuration is automatically copied in your clipboard.
-
When your browser doesn’t support the feature, in the Export a Report Configuration panel that appears, copy the configuration.
-
-
In your actual Coveo organization or in another one (for example, your Coveo organization in production), in the navigation bar on the left, under Analytics, select Reports.
-
On the Reports (platform-ca | platform-eu | platform-au) page, click Add, and then select Blank dashboard.
-
On the dashboard:
-
In Edit mode, click
in the upper-right corner, and then select Paste JSON configuration. -
In the Import a Report Configuration panel that appears, paste the configuration, and then click Import and Save.
-
Click Save in the upper-right corner.
The dashboard looks exactly the same as the one you exported. The only possible difference could be the analytics data if you imported a dashboard configuration from another Coveo organization.
-
Edit a dashboard configuration
|
|
Note
This feature is useful when you’re more comfortable editing dashboards in JSON than directly in the dashboards themselves. |
-
Click
in the upper-right corner, and then select Edit JSON configuration. -
In the Edit a Report JSON Configuration panel that appears, do one of the following:
-
Make your modifications, and then click Save.
-
Locate and select the configuration part that you want to import in another dashboard, copy your selection, and then click Apply.
-
-
If you’re importing a configuration, in the navigation bar on the left, under Analytics, select Reports.
-
On the Reports (platform-ca | platform-eu | platform-au) page, access or create a dashboard.
-
On the dashboard:
-
In the upper-right corner, click
, and then select Edit JSON configuration. -
In the Import a Report Configuration panel that appears, locate the place where you want to put the dashboard part you copied, and then paste the JSON code.
-
Click Import and Save.
-
-
Export and import a part of a dashboard
|
|
Note
This feature is useful when you want to export and import only a section or a card of a dashboard, and not the complete configuration. |
-
In Edit mode, click
in the upper-right corner, and then select Edit JSON configuration. -
In the Edit a Report JSON Configuration panel that appears:
-
Locate and select the configuration part that you want to import in another dashboard, and then copy your selection.
-
Click Save.
-
-
In your actual Coveo organization or in another one (for example, your Coveo organization in production), in the navigation bar on the left, under Analytics, select Reports.
-
On the Reports (platform-ca | platform-eu | platform-au) page, access an existing dashboard by clicking a dashboard, and then clicking Open in the Action bar.
-
On the dashboard:
-
In Edit mode, click
in the upper-right corner, and then select Edit JSON configuration. -
In the Edit a Report JSON Configuration panel that appears, locate the place where you want to put the dashboard part you copied, and then paste the JSON code.
-
Click Save.
-
Manage the access to the dashboard
In Edit mode, access the Manage Report Access dialog (click ![]() in the upper-right corner, and then select Manage report access), and then define who has access to the dashboard.
in the upper-right corner, and then select Manage report access), and then define who has access to the dashboard.
|
|
Notes
|
Apply a template to a dashboard
-
In Edit mode, click
in the upper-right corner, and then select Apply template. -
In the Select a Template panel:
-
Click Select Template.
-
If you selected Case Creation Page Metrics, on the Add Case Creation Page Metrics Report panel that appears:
-
Under Select a case creation page, click the dropdown menu, and then select the page you want to analyze.
-
Under Select Submit case custom event, click the dropdown menu, and then select the name of the custom event that’s logged when a user creates a case.
-
Under Select Cancel case custom event, click the dropdown menu, and then select the name of the custom event that’s logged when a user cancels their case creation or select None when your page doesn’t contain a cancel button.
-
Click Add Report.
A report named Case Creation Page Metrics appears.
-
-
If you selected General Search Interface Metrics, in the Add General Search Interface Metrics Report panel that appears:
-
Under Select search interface, click the dropdown menu, and then select the search interface you want to analyze.
-
Click Add Report.
A report named General Search Interface Metrics appears.
-
-
If you selected Detailed Summary, in the Add Detailed Summary Report panel that appears:
-
Under Select search interface (Origin level 1), click the dropdown menu, and then select the search interface you want to analyze.
-
Click Add Report.
A report named Detailed Summary appears.
-
-
If you selected Support Agents, in the Add Support Agents Report panel that appears:
-
In the first input, enter the Total number of agents in your organization.
-
In the Custom dimension name (unique case identifier) input, enter the name of the dimension that uniquely identifies your support cases.
NoteWhen you don’t already have a dimension that covers this use case, ask a developer to set up the dimension, and then add it in the Administration Console (see Send your own events and Add dimension on custom metadata). Otherwise, some metric cards on the report won’t load.
-
Click Add Report.
A report named Support Agents appears.
-
-
If you selected A/B Testing, in the Add an A/B Test Report panel that appears:
NoteYour Coveo organization must contain at least two query pipelines associated with an active A/B Test, and usage analytics data must be available for at least one of the two pipelines. Otherwise, you’ll get the
Missing Required Usage Analytics Dataerror message when adding the report.-
Under Select test, click the dropdown menu, and then select one of the available test sets.
NoteThe dropdown menu lists all test sets available for your Coveo organization, not only the A/B tests created in the Coveo Administration Console (see Manage A/B tests).
-
In the Item A and Item B dropdown menu, select the two items (not necessarily pipelines) in the selected test set that you want to compare.
-
Click Add Test.
A report named A/B Testing appears.
-
Remove a dashboard
-
In Edit mode, click
in the upper-right corner, and then select Delete. -
In the Delete Report confirmation prompt that appears, click Delete.
Add a section
Dashboards contain an empty section template that only appears in Edit mode.
-
Click Add card to section to officially create the section.
-
In the upper-left corner, in the input, enter a meaningful section title, such as
User Adoption.
Notes-
Sections without cards are deleted after saving the dashboard.
-
You can also duplicate an existing section with the Duplicate button and then only modify what needs to be different.
-
Add a card
In Edit mode, in a section, click Add card to section, and then select one of the following Coveo Analytics card types:
Values
Graphs
Others
Manage sections and cards
In Edit mode:
Edit a section or a card title
-
Click the section or card title.
-
Edit the title.
NoteIn Edit mode, all automatically generated card titles (which occurs if the title box is empty before saving the dashboard) are shown as Enter a card title.
-
Click outside the title box to validate the change.
Resize a section or a card
-
Hover over a section or a card and
 appears at the lower right of the section or the card.
 -
Click and hold
, and then move the mouse to resize the card or graph at the desired width and height. -
When you’re done, release the left mouse button.
Replace a section or a card
-
Click and hold
 in the upper-left corner of a card or in the upper-left corner of a section, and then move the mouse to replace the section or the card at the desired position.
Note
in the upper-left corner of a card or in the upper-left corner of a section, and then move the mouse to replace the section or the card at the desired position.
NoteYou can move cards from a dashboard section to another and you can place dashboard sections side-by-side.
-
When you’re done, release the left mouse button.
Move a card or a section from one tab to another
-
Click and hold
in the upper-left corner of a card or in the upper-left corner of a section, and then hover over the label of the desired tab or the Add Tab label. -
When you’re done, release the left mouse button.
|
|
Note
When you release the mouse button over the Add Tab, a new tab is created with the moved card or section. |
Explore the data behind each card
In the upper-right corner of a card, click ![]() (see Review content behind dashboard cards).
(see Review content behind dashboard cards).
|
|
Note
This feature is ONLY available outside of Edit mode. |
Manage tabs
|
|
Notes
|
In Edit mode:
Add a tab
Under the filter toolbar, next to Tab [n], click Add Tab.
The first time you proceed, a tab named Tab 2 appears next to Tab 1.
|
|
Note
Instead of creating a dashboard per user, you can create one dashboard in which you assign a tab per user. |
Rename a tab
Click the tab label, and then edit the original name.
Re-order tabs
To re-order tabs, click ![]() next to the tab label and drag it to the location of your choice.
next to the tab label and drag it to the location of your choice.
|
|
Note
For a tab to be the first starting from the left, you have to move the desired tab in second place, and then move the first tab in second place. |
Move content from one dashboard to another
-
In Edit mode, depending on the report container you want to move:
NoteTo copy a card, section, or tab from a dashboard to another, you have to duplicate the report element, and then proceed with the following procedure.
-
For a tab or a card:
In the upper-left corner of a card or next to the tab label, click and hold
. -
For a section:
In the upper-left corner, click and hold
.
-
-
Move the mouse to the middle right of the report where the word "Move" appears, and then release the left mouse button.
-
In the Select the Location to Move the Content dialog, select the dashboard Name checkbox in which you want to move the content.
Notes-
By default, the content is moved to the first tab of the selected dashboard.
-
When your organization has many reports, use the Filter box to find a dashboard more easily.
-
You can only move content to dashboards you have access to.
-
-
Click Move.
-
In the Content Moved dialog, click Save and Go to save the current report and reach the new content location or click Stay on this Report.
Change the time series card interval
In Edit mode, select one of the following intervals in the upper-right corner of a time series card to set how data is grouped in the graph: Hour, Day, Week, and Month.
When you review the search usage data of last week and you select Day, each point in the graph represents a day.
Review dashboard activity
As part of your duties, you may need to review activities related to dashboards for investigation or troubleshooting purposes.
To do so, in the upper-right corner of the Reports (platform-ca | platform-eu | platform-au) page, click ![]() .
.
See Review resource activity for details on activities and alternative ways to access this information.
Required privileges
The following table indicates the required privileges to view and edit dashboards from the Reports (platform-ca | platform-eu | platform-au) page and associated panels (see Manage privileges and Privilege reference).
|
|
Note
Access to dashboards or part of their content may be further restricted as a function of the member (see Manage access to reports and Manage permission filters). |
| Action | Service - Domain | Required access level |
|---|---|---|
View dashboards |
Analytics - Analytics data |
View |
Edit dashboards |
Analytics - Analytics data |
View |
Analytics - Data exports |
Edit |
|
Analytics - Administrate |
Allowed |
|
Access the Activity Browser and view all organization activities |
Organization - Activity |
View |
|
|
A member with the View access level on the Activities domain can access the Activity Browser. This member can therefore see all activities taking place in the organization, including those from Coveo Administration Console pages that they can’t access. |