Review and manage explorers
Review and manage explorers
- View or edit an explorer
- Manage graphical and numerical metrics
- Set the date interval
- Manage filters to refine data
- Manage dimensions in an explorer
- See which items were opened following a user query
- Report on custom events
- Export the content of an explorer
- Export data based on your current filters
- Manage access to the explorer
- Apply a template to an explorer
- Rename an explorer
- Remove an explorer
- Share an explorer
- Project association prompts
- Required privileges
Once you’ve created an explorer, you can review and manage it to better understand your organization data. The various explorers templates as well as the blank explorers contain two report cards: the Metric time series card and the Table card.
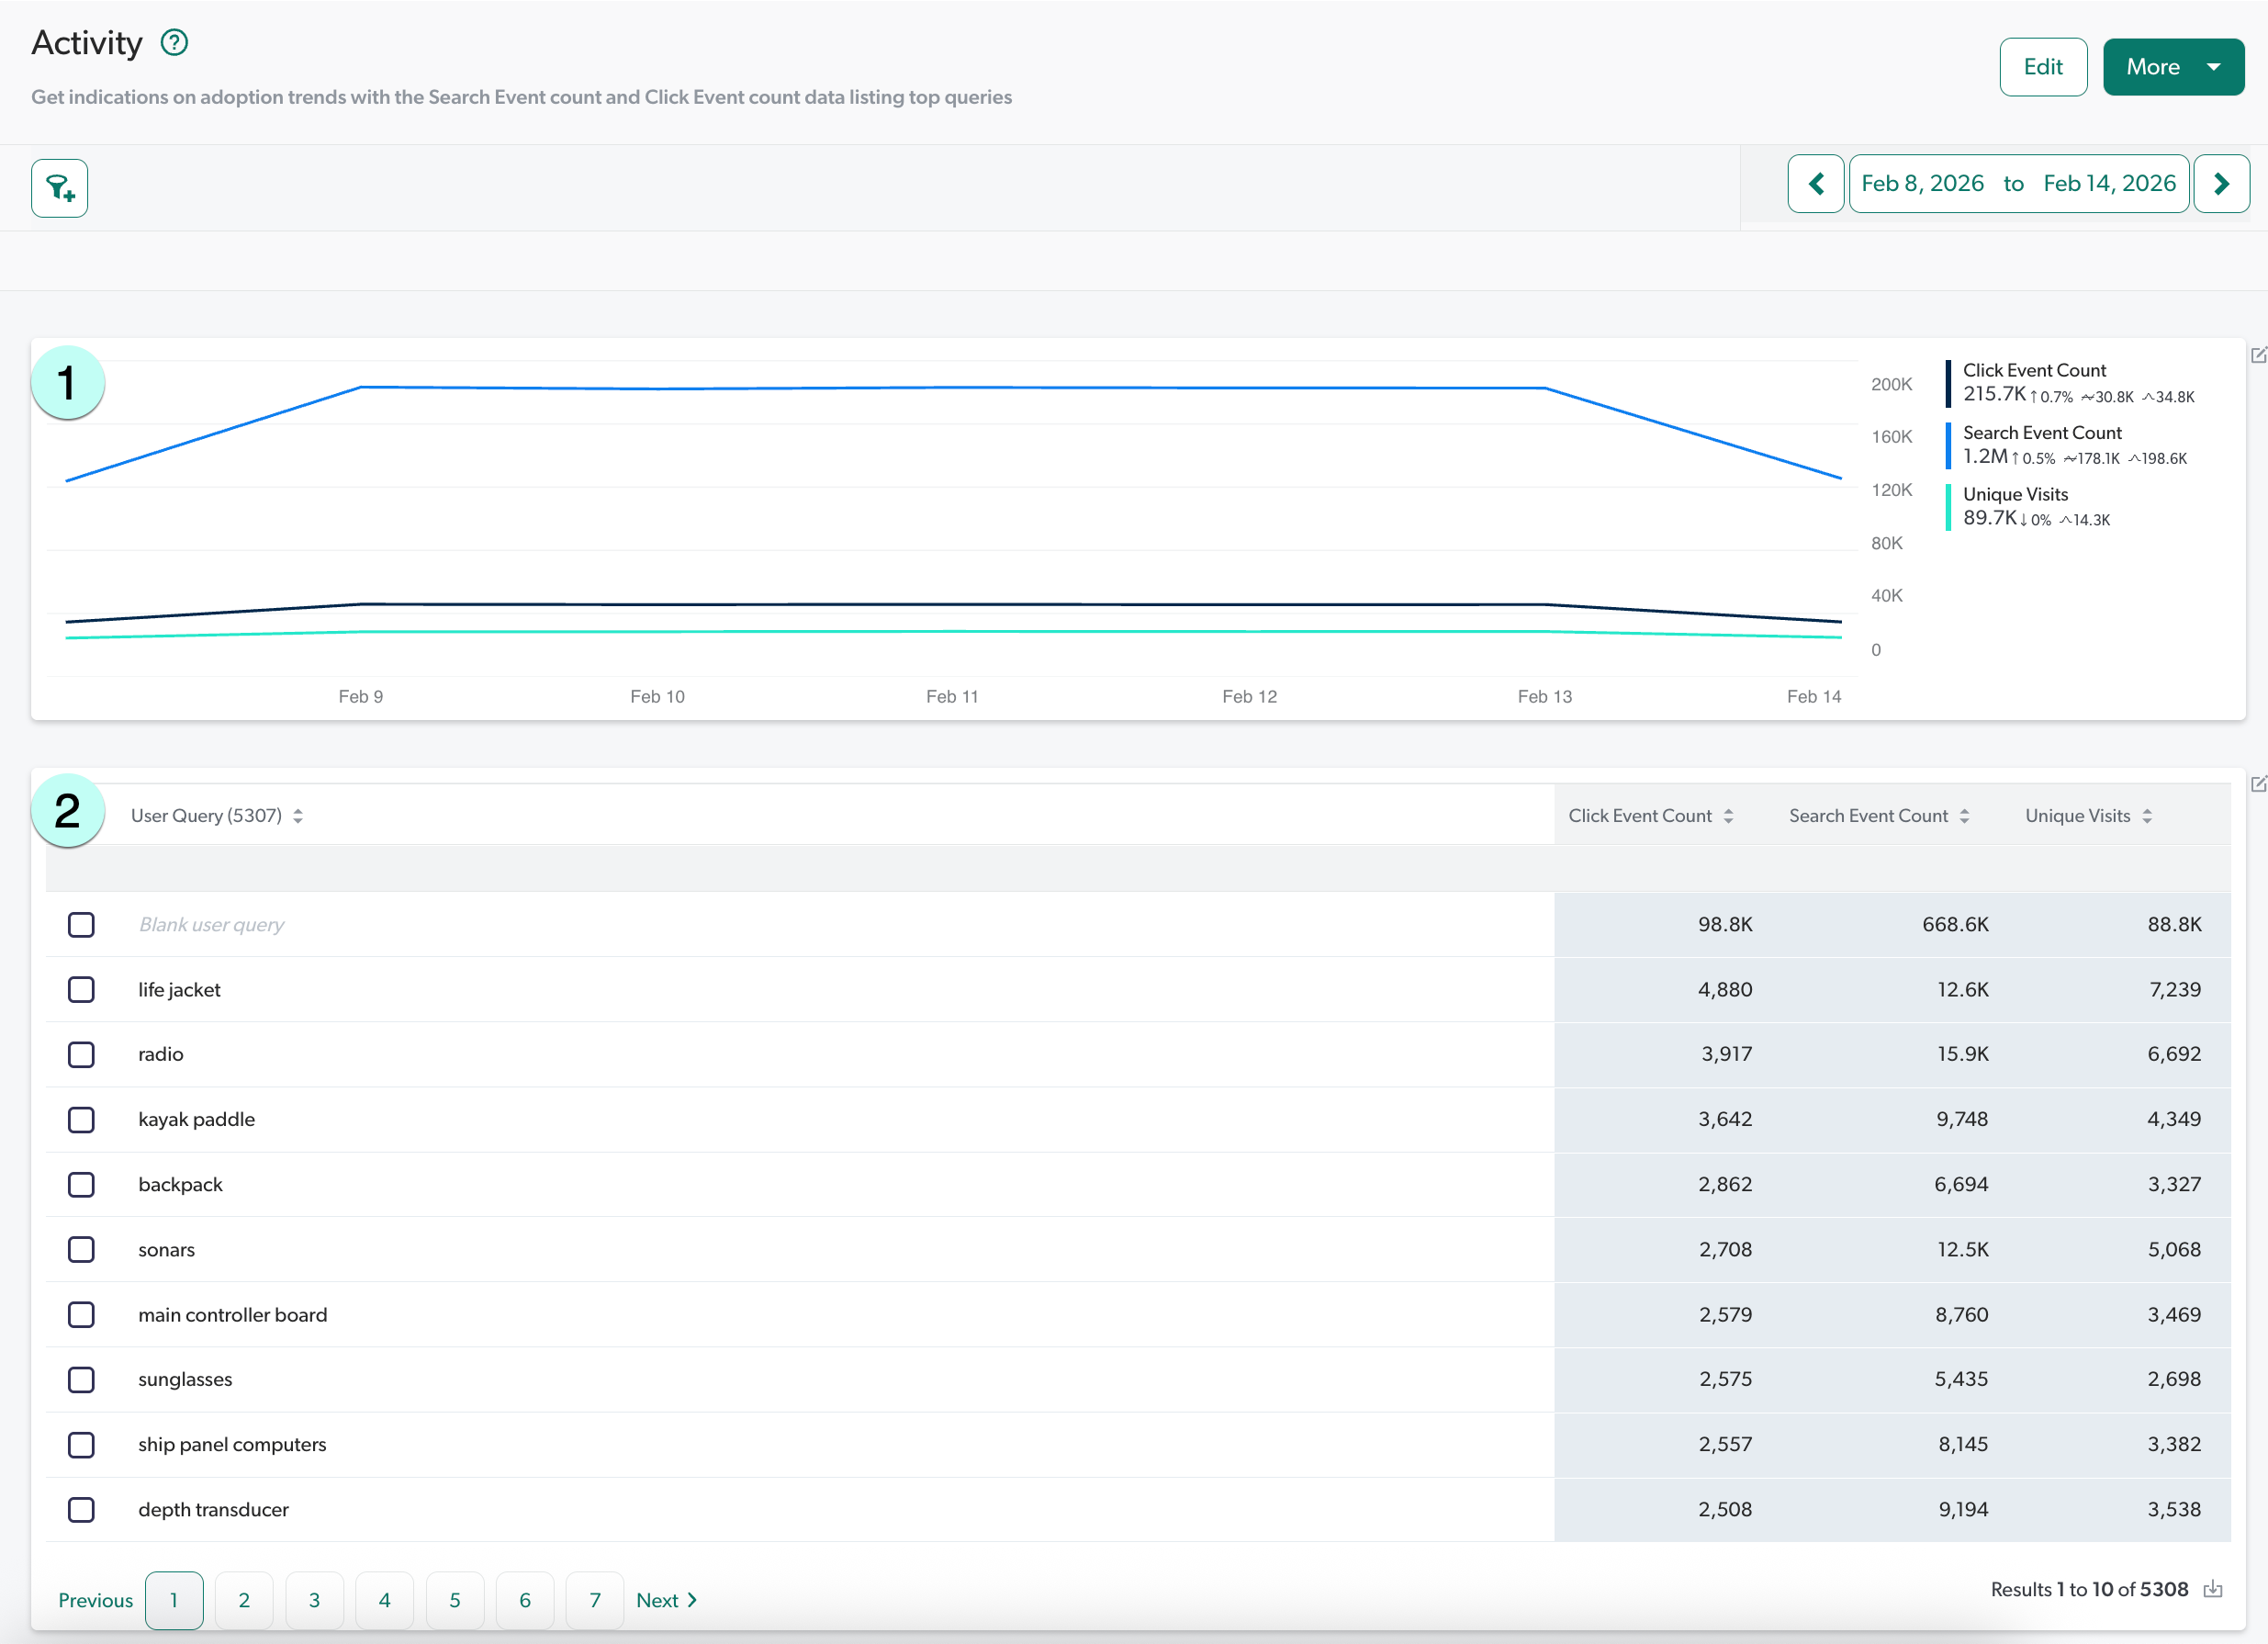
1 Metric time series card: Shows the evolution of the selected metrics over time.
2 Table card: Shows the selected dimensions and metrics in a table format.
Depending on the explorer template you selected, the cards will contain different metrics and dimensions. You can add alternate metrics and dimensions to the cards to better evaluate your search solution. If you added a blank explorer, you’ll need to add the desired metrics and dimensions to the cards.
|
|
Notes
|
View or edit an explorer
To better understand your Coveo Analytics data, you can view or edit an explorer:
-
On the Reports (platform-ca | platform-eu | platform-au) page, click the explorer that you want to open, and then click Open in the Action bar.
-
Click Edit in the upper-right corner.

In explorers, the Time series card at the top and the Table card at the bottom are independent entities, meaning that changes in either card don’t affect the other.
Manage graphical and numerical metrics
On a given explorer, you can add or remove graphical and numerical metrics to better analyze your data.
Review the graphical and numerical metrics
The graphical and numerical metrics available depends on the explorer template you selected. The following table shows the metrics available in the Activity, Content Gaps, and Search Relevance explorer templates.
| Metric | Activity explorer | Content Gaps explorer | Search Relevance explorer |
|---|---|---|---|
Average Click Rank |
|
|
|
Click Event Count |
|
|
|
Click Rank |
|
|
|
Relevance Index (Legacy) |
|
|
|
Search Event Clickthrough (%) |
|
|
|
Search Event Count |
|
|
|
Search Events with Clicks |
|
|
|
Unique Visits |
|
|
|
Add graphical and numerical metrics
You can add different metrics to the cards to better analyze your data.
-
In Edit mode, click
 next to one of the report cards.
 -
Select one or more metrics to be shown in the time series and in the metrics box:
-
Click the links (Search, Click, and Custom) to browse metrics by event type, and then select the ones of your choice.
 Note
NoteCustom data can only be leveraged when using the UA Protocol. If your Coveo implementation uses the Event Protocol, custom dimensions and metrics shouldn’t be added to a report since they won’t function as expected.
-
-
Under Metrics, drag each metric to the place of your choice.
-
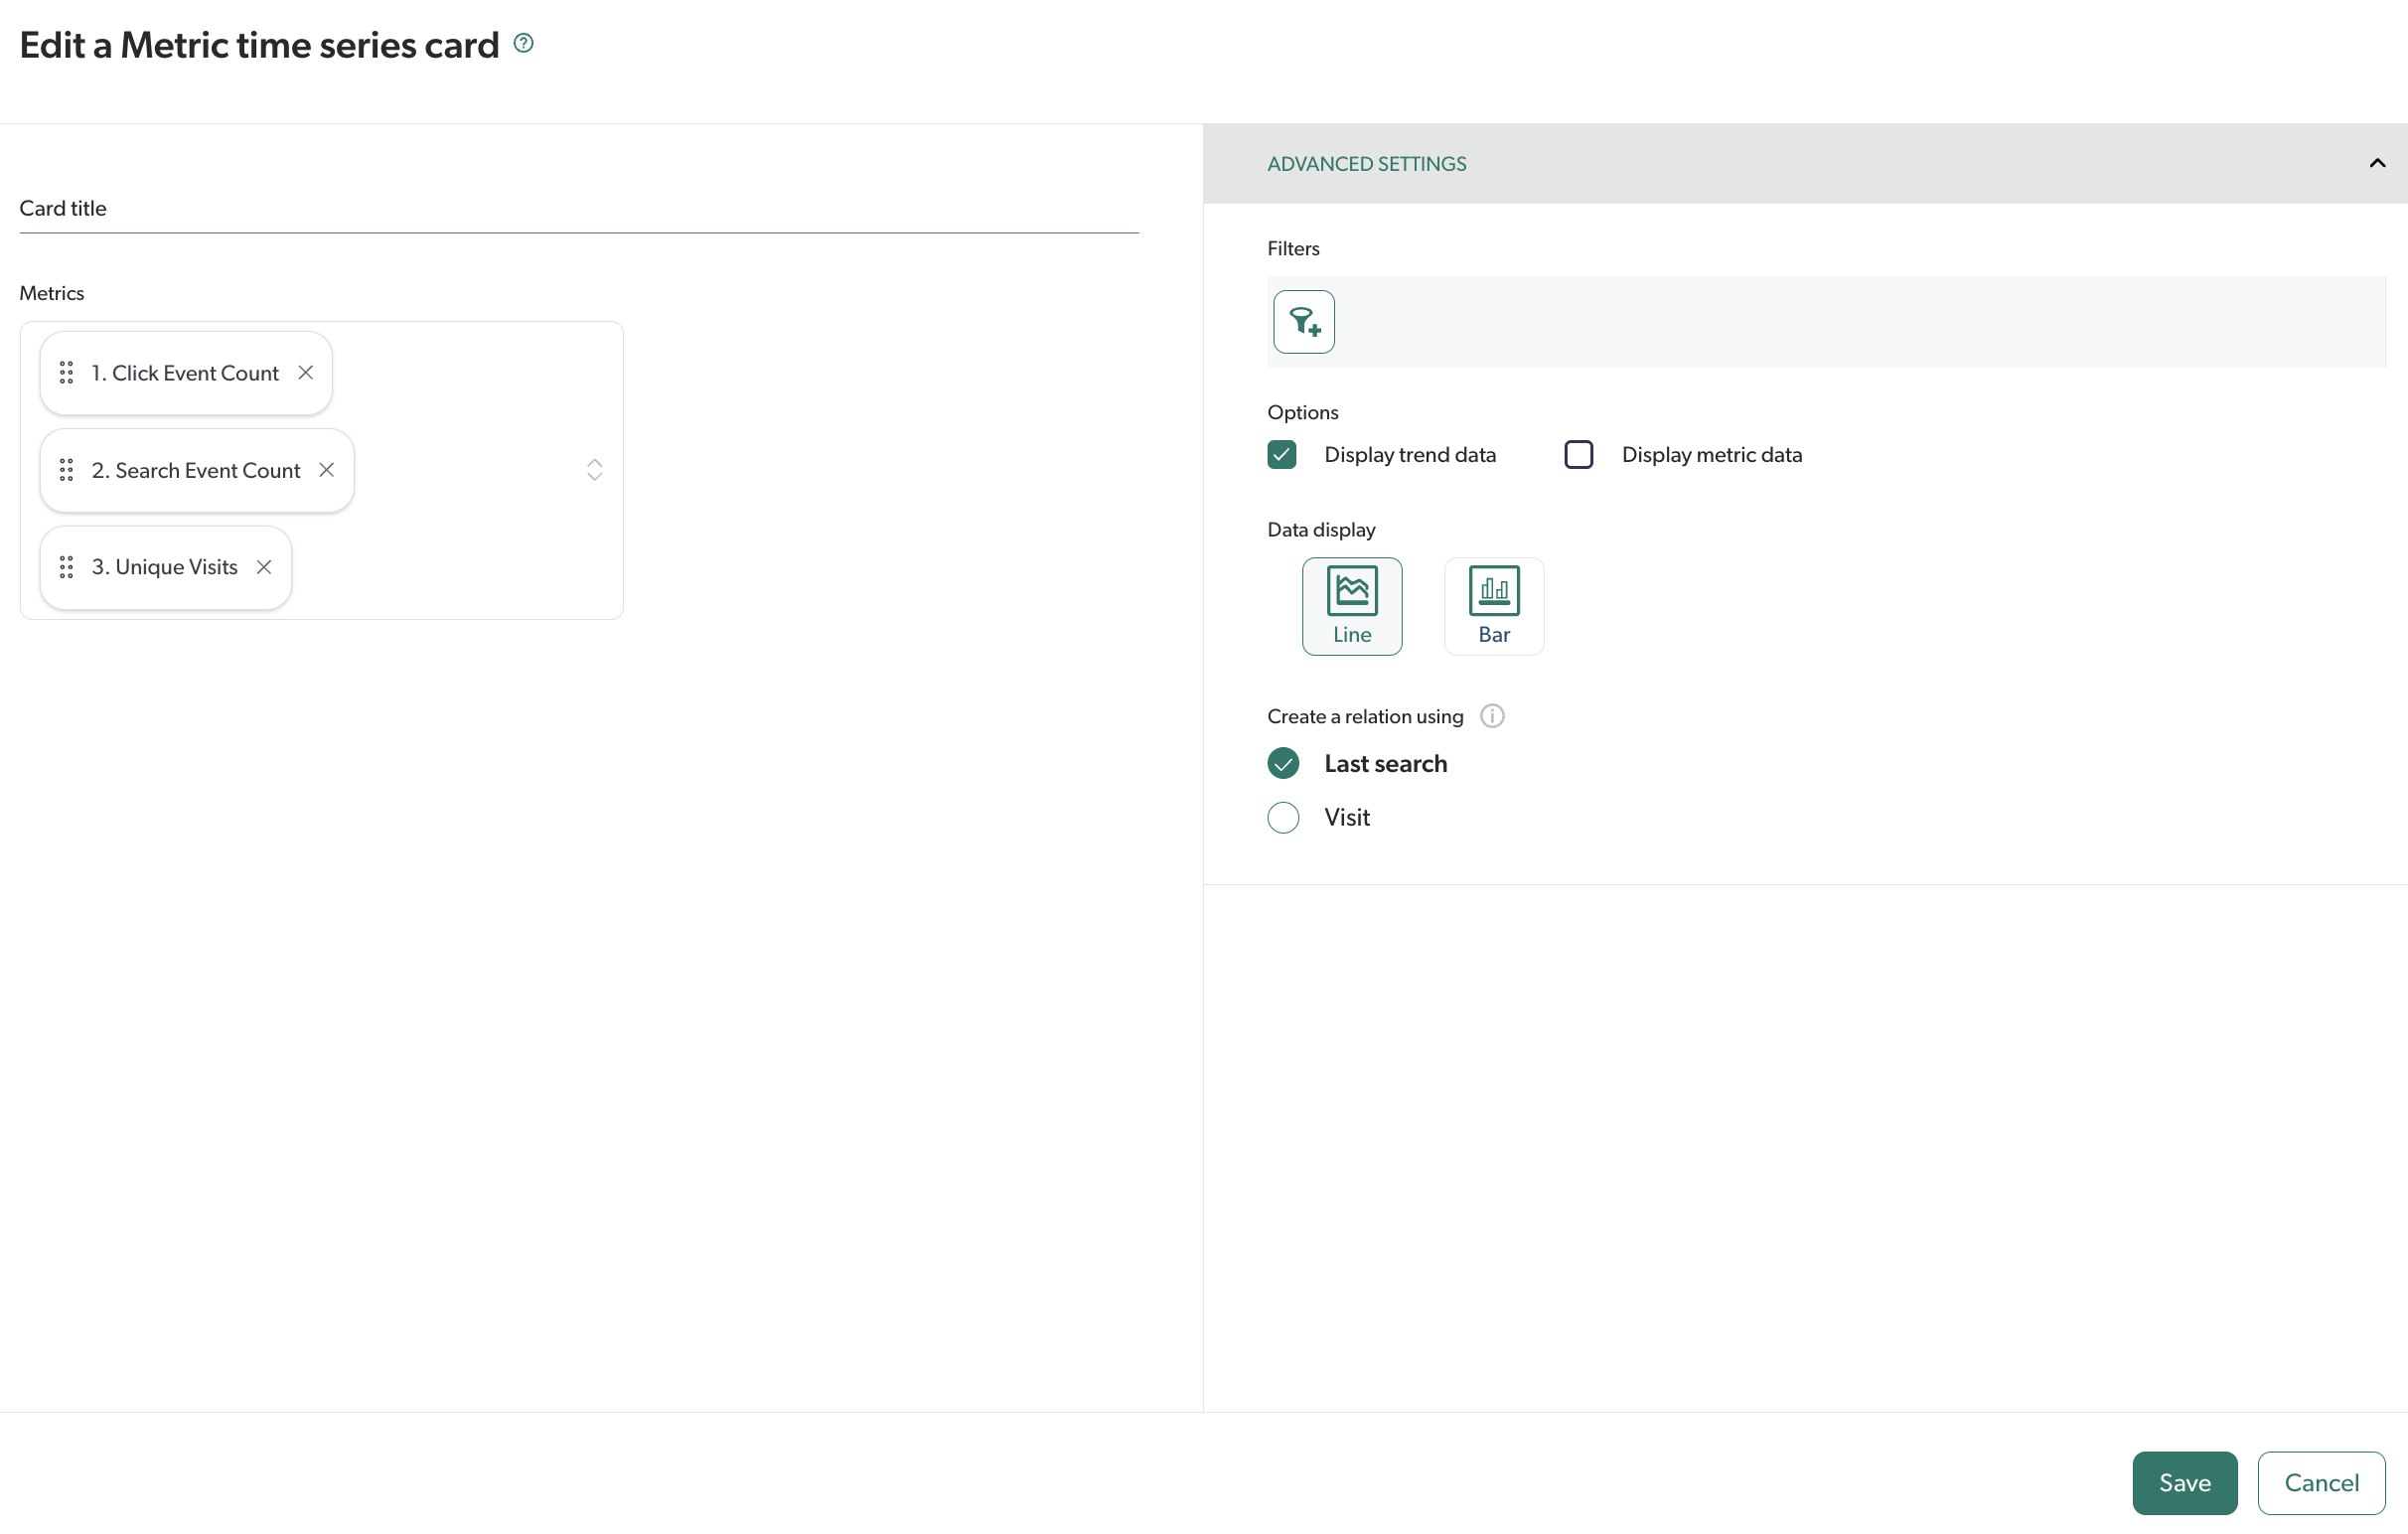
In the Advanced settings section:
-
Under Filters, add the appropriate filters as needed.
-
Under options, when you want to see metric trends over the selected period, select Display trend data.
-
When you want to see metric values on top of every time series points, select the Display metric data option.
-
Under Data display, select the time series to be shown using Line or Bar charts.
-
Under Create a relation using, select Last search or Visit if you’re reporting on a custom event and on a search or click event at the same time, or on an all event category metric or dimension (for example, Unique User IP and Browser).
Notes-
Last search links each custom event to the user query immediately preceding (if any) and Visit links each custom event to all queries performed during the user visit in which the custom event happened.
-
The Create a relation using parameter has no effect when you report only on search and click events.
-
-
-
Click Save.
-
(If you’ve modified the Metric time series card) Back on the explorer, click anywhere on the Metric time series card, and then hover the cursor over the graph to select one of the following interval values: Hour, Day, Week, or Month.
 Leading practice
A mix of this feature with the date interval selection offers more possibilities.
For example, you want to investigate hour by hour what happened during an activity drop that occurred on October 30, 2023.
-
In the upper-right corner, click the box containing the actual date range to access the Report Period dialog, and then select October 30, 2023 (see Set the period to review data).
-
Click
. -
Select the Hour interval.
-
Click Apply.
For each hour, you can see the hourly total value of each metric you selected to be shown in the time series. This way you can pinpoint when the drop started.
-
|
|
Note
(If you selected the Display trend data option) When available and selected to be displayed, the trend indicator (up or down arrow) shows the percentage of increase or decrease for a metric in comparison with the same selected period that preceded (week, month, year…).
|
Remove graphical and numerical metrics
You can remove metrics from the cards as needed.
-
In Edit mode, click
next to an explorer card. -
Under Metrics, click
 next to the metrics you want to remove.
 -
Click Save.
Set the date interval
On the explorer, you can set the date interval over which you want to review Coveo Analytics data. In Edit mode, you can do the following:
-
In the upper-right corner, you can go from the actual date interval selected (last week, month…) to the previous period or next period by clicking
 and
and  respectively.
 -
You can click the date picker to access the Report Period dialog, and then select the date range you want to review (see Set the period to review data).
NoteYou can select a period that’s incomplete (for example, the current month), in which case your date range selection will always include the latest available events until the period ends (for example, the first day of the following month).
For example, you’re reviewing data per Month and want to see how statistics are trending for the first two weeks of the current month, so you click
. -
You can compare specific data from a prior period to determine trends in explorers.
For trends to be shown on the explorer, select the Display trend data option.
-
On the explorer, in Edit mode, click the date picker in the upper-right corner.
-
In the Report Period panel that appears, in the Compare to section, click the Previous Period, Previous Month, Previous Year, or Custom Period link to set the period to compare the current selected data with.
The trends in report cards are automatically updated based on your selection.
NoteBy default, the Previous Period is used to compare.
-
Click Save in the upper-right corner.
-
|
|
Note
By modifying the date range in Edit mode and then saving your changes, the explorer remembers your date range selection so you don’t have to set it each time you open the report. However, if you aren’t in Edit mode and you modify the date range, your changes will be lost once you leave the explorer. |
Manage filters to refine data
Filters allow you to further refine the data you’re analyzing in explorers. On the explorer, in Edit mode, do one of the following:
-
Click
 to add global dimension or named filters.
The selected filters appear in the top bar.
-
Click
next to one of the report cards.-
In the card that opens, in the Advanced settings section, under Filters, click
to add global dimension or named filters. -
Click Save.
-
-
To remove a filter, click
next to the filter label directly on the explorer or in a report card. -
To edit a filter, click the filter label to edit as needed, and then click Save.
Once you’re satisfied with your changes, click Save in the upper-right corner of the explorer.
Manage dimensions in an explorer
On the explorer, you can add or hide dimensions, exclude or include dimension values, or drill down on certain dimension values for further analysis.
-
To hide a dimension: on the Metric time series card, hover over the dimension you want to hide, and then click
 .
. -
Hover over a dimension value in the Table card, and then click
 to exclude or
  to narrow the dimension.
 -
(Only on User Query and Keyword dimension values) Hover over a dimension value in the Table card, and then click
 to view the search results related to the dimension value on the Content Browser (platform-ca | platform-eu | platform-au) page.
Note
to view the search results related to the dimension value on the Content Browser (platform-ca | platform-eu | platform-au) page.
NoteThe search results related to the selected dimension value aren’t completely identical to every user since no one has the same permissions.
Add dimensions or metrics to the Table card
You can choose which dimensions and metrics will be displayed in the Table card of the explorer to further analyze your data.
-
On the explorer, in Edit mode, click
next to the Table card. -
In the Dimensions and Metrics lists, do one of the following to select one or more dimensions and/or metrics to be shown in the table:
-
Click the links (Search, Click, and Custom) to browse dimensions and metrics by event type, and then select the ones of your choice.
NoteCustom data can only be leveraged when using the UA Protocol. If your Coveo implementation uses the Event Protocol, custom dimensions and metrics shouldn’t be added to a report since they won’t function as expected.
-
Click All, and then use the Filter box to find and select the dimensions and metrics of your choice.
ExampleCountry and Search Event Count
-
-
-
In the Advanced settings section:
-
(Optional) Click
, and then create one or more metric filters (see Add dimension and metric filters in cards).
Metric filters are only applied to the Table card. Therefore, numerical metric counts (Click Event Count, Search Event Count, etc.) next to the line graph in the Metric time series card won’t be affected by the filters.
For example, you only want to know the user IDs that have 100 clicks or less, so you add the following filter:
Click Event Count is lower than or equal to 100. Therefore, the click event count in the Metric time series card (250.1K) won’t be the same as the sum of the click event counts in the Table card.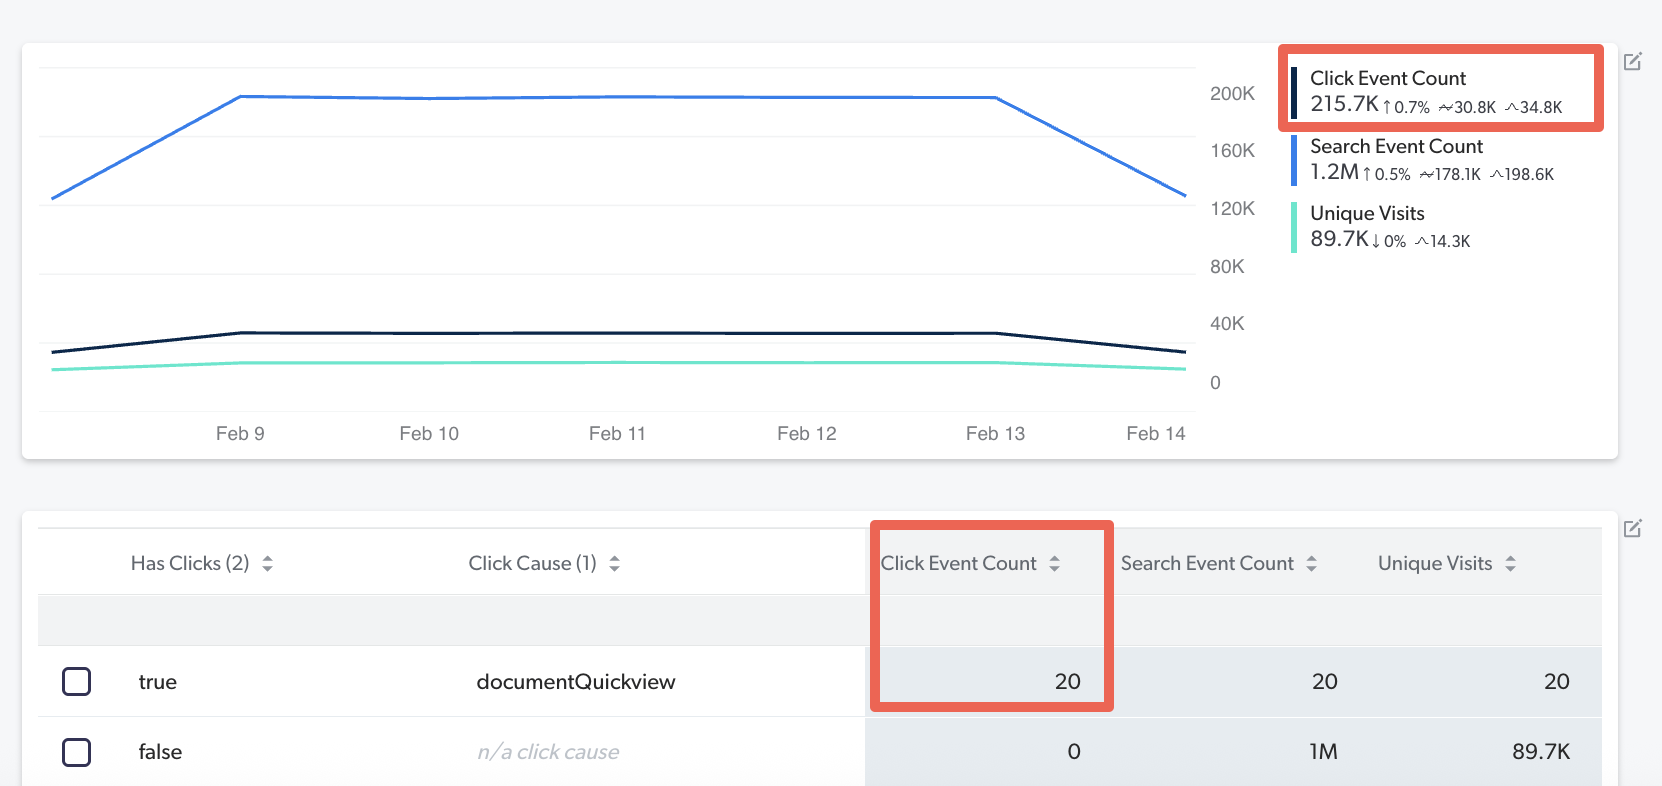
-
Under Options, select the Row count column checkbox if you want to display the row count in the table.
-
Under Sort direction, decide the metric value sort order, by selecting Ascending or Descending.
-
Set the number of rows per page in the table.
-
In the Value destination link box, set destination links when clicking table values.
-
-
Click Save.
The table is updated to add a column for the selected dimension or metric.
ExampleIf you first select the Country dimension, the table displays metric values for United States, Canada, etc. You narrow down on the data by adding the Device dimension to get all Country and Device combinations such as United States using Firefox, United States using Chrome, Canada using Chrome, etc. If you then remove Country, the table only shows the metric values for the various devices.
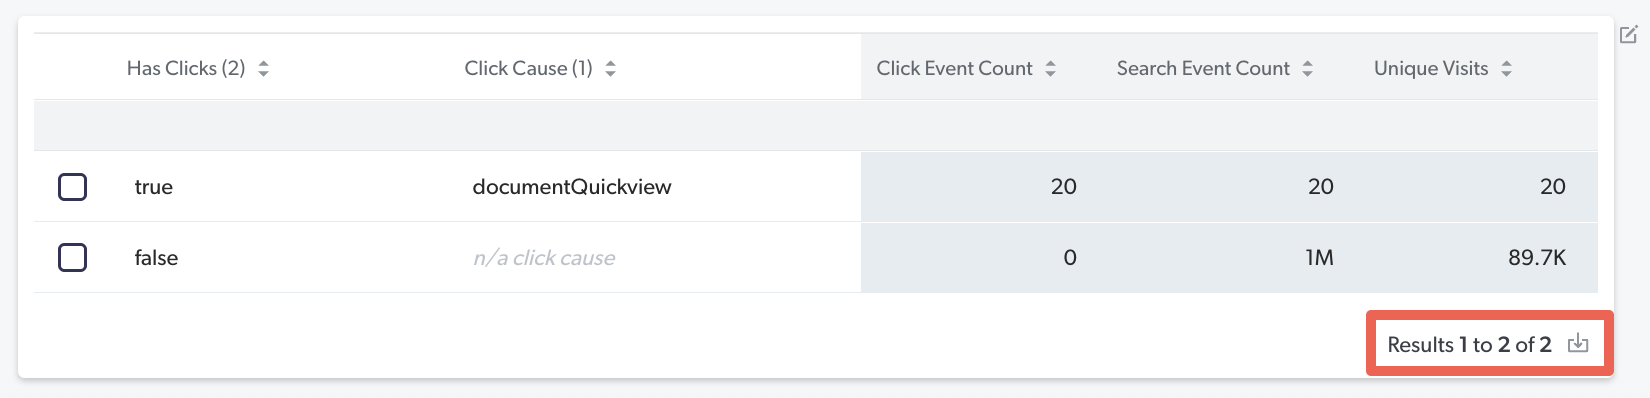
See which items were opened following a user query
On the explorer, click ![]() next to a Keyword or User Query dimension value.
next to a Keyword or User Query dimension value.
|
|
Note
The Search Relevance explorer opens in a new browser tab with a filter on the query or keyword value (for example, |
Report on custom events
On the explorer, you can report on queries related to custom events.
-
In Edit mode, click
next to the table header. -
Search and select User Query and one or more custom dimensions or metrics related to custom events to display (for example, Event type, Unique Event Value, Custom Event Count…).
-
Under Create a relation using, select Last search to link each event to the search event immediately preceding (if any) or select Visit to link each event to all queries performed during the user visit in which the event happened.
NoteSelect Last search when the last query performed by the user is the reason for the custom event.
For example, in Salesforce, when agents attached a result to a case (
caseAttach), the last query they made gave them the results they used to do the custom event.On the other hand, select Visit in situations where none of the queries performed by the user during the visit resolved their matter.
For example, when one of your clients creates a case (
caseCreate), they, more often than not, tried to get the information they needed by querying on the subject of their matter before doing the custom event. You can then use these queries to create knowledge base articles and therefore fill the content gap. -
Click Save.
-
Create a filter on a dimension value.
ExampleCustom Event Value is caseCreate.
Export the content of an explorer
On the explorer, at the lower-right corner of each data table in explorers, click ![]() to export the table content as a CSV file.
to export the table content as a CSV file.
Export data based on your current filters
-
On the explorer, click
 in the upper-right corner, and then select Export raw data using current filters.
Note
in the upper-right corner, and then select Export raw data using current filters.
NoteThis function exports all the data of your Coveo organization (not only the dimensions and metrics appearing on the page) that meets the criteria (date interval and other filters). When you only want to download the content of the Table card, use the other export feature (see Export the content of an explorer and Data exports).
-
On the Data Exports (platform-ca | platform-eu | platform-au) page, download the newly created export (ZIP file) to your local drive.
Manage access to the explorer
To manage who can access the explorer:
-
Click
in the upper-right corner, and then select Manage report access. -
In the Manage Report Access panel, define who has access to the explorer. For more information, see Manage access to reports.
|
|
Notes
|
Apply a template to an explorer
-
On the explorer, click
in the upper-right corner, and then select Apply template. -
In the Select a Template panel that appears, select the template of your choice, and then click Select Template.
-
Click Save in the upper-right corner.
|
|
Note
This option is useful if you’ve deleted one of the three pre-configured explorers in the Reports (platform-ca | platform-eu | platform-au) page, or if you began with a blank explorer and want to use a template instead. |
Rename an explorer
-
On the explorer, in Edit mode, change the explorer name by clicking and editing the original name in the upper-left corner.
ExampleYou want to analyze the workflow of anonymous and authenticated users so you changed the Audience Copy page name to Users Workflow.
-
Optionally, enter an explorer description.
-
Click Save in the upper-right corner.
Remove an explorer
To remove an explorer from your list of reports:
-
On the explorer, click
in the upper-right corner, and then select Delete. -
In the Delete Report dialog that appears, click Delete to confirm.
|
|
Note
If you inadvertently delete one of the pre-configured explorers, you can recreate them by applying the related template to an explorer. |
Share an explorer
You may want to share an explorer with other members of your Coveo organization.
-
On the explorer, click Edit
-
In your browser address bar, copy the URL and share the link to any colleagues who have the required privileges to review explorers.
|
|
Notes
|
Project association prompts
An explorer is a resource you can associate with a project. Resources associated with a project can require confirmation when you modify them. These confirmation prompts help prevent accidental changes that could affect a Coveo implementation.
|
|
Note
For dashboards and explorers, confirmation prompts appear only when using the Edit JSON configuration feature. |
Deleting a resource always requires confirmation, whether it’s associated with a project or not. When the resource is associated with projects, the confirmation prompt lists those projects.
Required privileges
The following table indicates the required privileges to view and edit explorers from the Reports (platform-ca | platform-eu | platform-au) page and associated panels (see Manage privileges and Privilege reference).
|
|
Note
Access to explorers or part of their content may be further restricted as a function of the member (see Manage access to reports and Manage permission filters). |
| Action | Service | Domain | Required access level |
|---|---|---|---|
View explorers |
Analytics |
Analytics data |
View |
Dimensions |
View |
||
Named filters |
View |
||
Permission filters |
View |
||
Reports |
View |
||
Organization |
Organization |
View |
|
Edit explorers |
Analytics |
Administrate |
Allowed |
Analytics data |
View |
||
Data exports |
Edit |
||
Dimensions |
View |
||
Named filters |
View |
||
Permission filters |
View |
||
Reports |
Edit |
||
Organization |
Organization |
View |