Coveo Administration Console reports
Coveo Administration Console reports
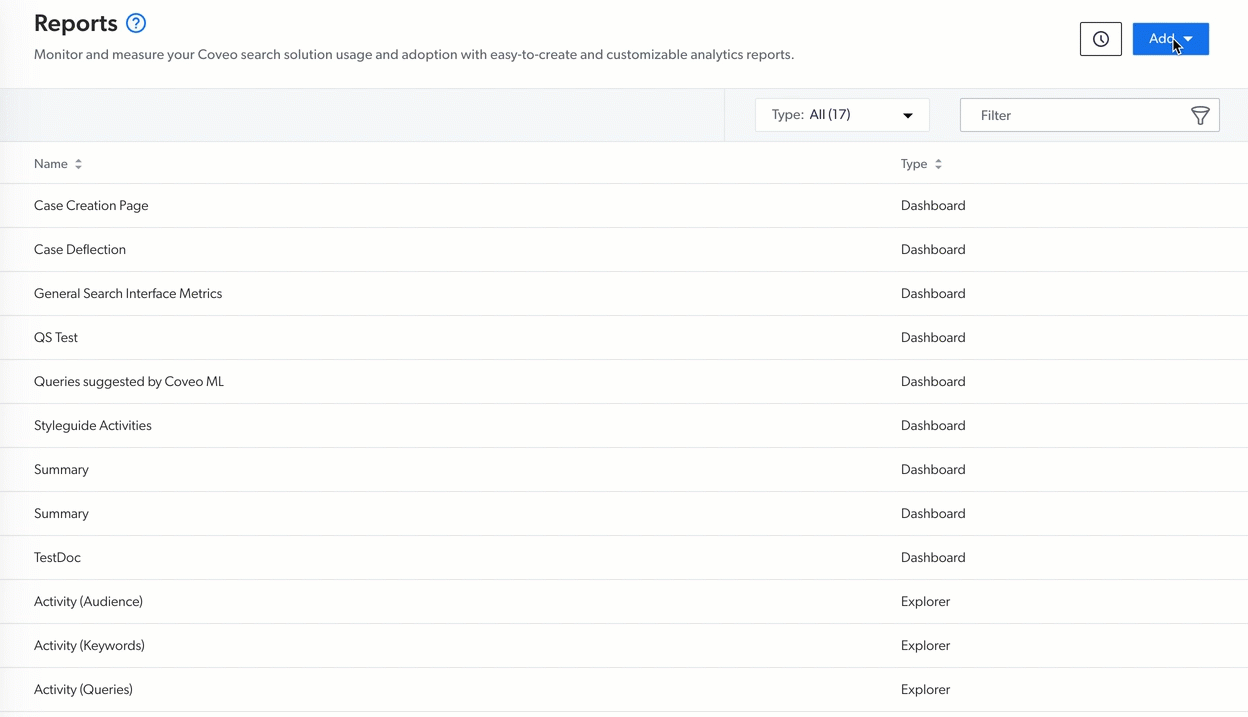
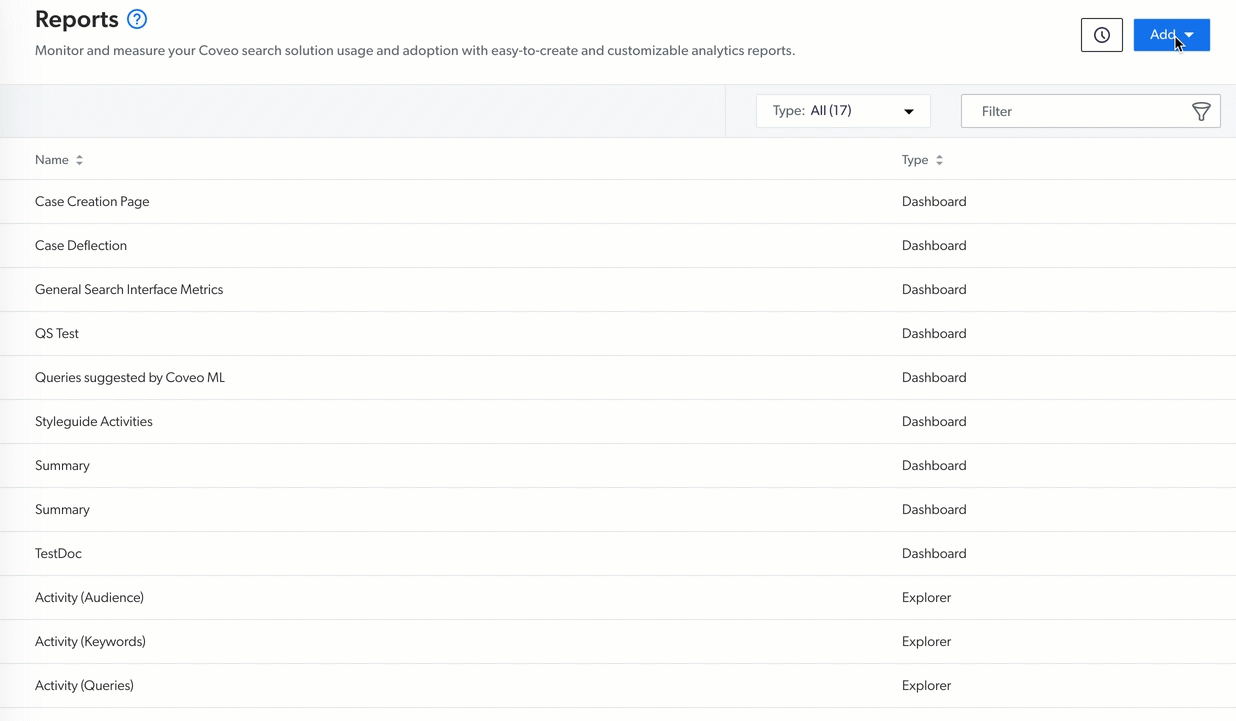
The Reports (platform-ca | platform-eu | platform-au) page in the Analytics section of the Coveo Administration Console lets you create and manage reports based on the data collected by Coveo Analytics.
A report is a customizable interface that displays data through visually impactful cards that help you monitor and measure the usage of your Coveo-powered search solution. Depending on your privileges, you can access and modify these reports, add or remove filters, metrics, and dimensions, and then save the dashboard or explorer modifications as a new report.
The Coveo Administration Console offers two types of reports: dashboards and explorers.
-
Dashboards are easy-to-read user interfaces that help you monitor your Coveo organization's search usage. They offer flexibility and convenience as they’re divided into sections that can each contain every report card available. You can create easy-to-read dashboards from a template, a duplicate of an existing dashboard, or from a blank dashboard.
All organizations come with a default Summary dashboard that shows a graphical presentation of the current status and historical trends of search metrics and key indicators relevant to the organization.
-
Explorers are subsets of dashboards designed to help you focus on a specific aspect of your Coveo Analytics data. The Coveo Administration Console offers a way to create explorers starting from a template, from a duplicate of an existing explorer, or from a blank explorer.
All organizations come with three pre-configured explorers: Activity, Content Gaps, and Relevance. You can build on these explorers and customize them depending on your organizational needs, or create new ones from the same templates. Every explorer contains a time series card and a data table that are both customizable.
Dashboard templates
On the Reports (platform-ca | platform-eu | platform-au) page, you can use a pre-configured Dashboard. This helps you highlight specific Coveo Analytics data aspects.
The dashboards templates are:
All Search Interfaces
This dashboard evaluates the performance of all your search interfaces with metrics such as Search Event Clickthrough (%), Average Click Rank, and Relevance Index.
General Search Interface Metrics
This dashboard provides an analysis of the performance metric trends over time of your primary search interface. This report contains a target average for each displayed metric and tips from our customer success manager team.
Summary
This dashboard provides an overview of your search interface usage by listing the most popular queries, the most active authenticated users, and the search events without results, and by showing the search relevance over time among other things (see Review trends from the Summary dashboard).
Trending Documents
This dashboard provides an analysis of the top trending and top documents of your search interface based on the number of times they were clicked. You can then ensure that the most popular documents are the desired ones and that their ranking modifier is Reveal ART (when Coveo ML is enabled), meaning that your model has learned the relevance of those items, and promotes them accordingly.
Generative Answering Performance
This dashboard lets you analyze the performance of your Relevance Generative Answering (RGA) implementation. The template creates a report with three tabs:
-
Search Metrics: Contains report cards that show metrics such as the number of generated answers, click-through rate, and top queries with and without generated answers.
-
User Feedback: Displays data collected through the RGA feedback modal.
 Note
NoteIf your RGA-enabled search interface is associated with an answer configuration in the Knowledge Hub, you must use the Knowledge Hub to view the answer feedback data. In this case, the user feedback data won’t appear in reports that are generated using the Generative Answering Performance template.
-
Self Service: Lets you see the impact of RGA on case submission, and by extension on self-service success, if you’re logging a custom event when a user submits a case during the same visit when accessing the RGA-enabled search interface.
|
|
Note
This report uses custom data, and therefore only works with the UA Protocol. If your Coveo implementation uses the Event Protocol, this report won’t function as expected. |
Machine Learning Query Suggestions
This dashboard helps you enable the Query Suggestion (QS) feature with a step-by-step guide, ensure enough data was gathered to take advantage of Coveo ML, and analyze the effect of the suggestions on your search interface performance metrics.
Smart Snippets Report Template
This dashboard lets you analyze user interaction with Smart Snippets.
Case Deflection Performance
This dashboard tracks case deflection, case submissions, and search performance in your case creation form or in your Case Assist experience. The template creates a report with two tabs:
-
Performance: Contains report cards that show the number of visits on your case creation page, visits that result in case submissions or deflection, cost savings, and other performance data.
-
Metrics: Contains report cards with metrics such as the visit clickthrough rate, the most clicked documents from visits that ended in a case submission, clicks on results powered by Coveo Machine Learning, and other insights.
Self-Service and Case Deflection
The dashboard helps evaluate the effectiveness of your case creation and support search pages (see Review your company self-service usage). After a quick look at the report, you know the number of case deflections versus case creations and the total number of visits in which at least a search and a click happen among other things.
Search Performance
Support Agents
This dashboard provides an overview of your agent and Insight Panel performances. The report also analyzes the level of adoption of your panel by measuring the number of agents performing key actions such as using the Full Search page and attaching search results to cases.
|
|
Note
This report uses custom data, and therefore only works with the UA Protocol. If your Coveo implementation uses the Event Protocol, this report won’t function as expected. |
A/B Testing
This dashboard helps evaluate the effectiveness of your recent search engine optimization (SEO) changes by analyzing the performance between two query pipelines (see Analyze the performance of pipeline A vs pipeline B). With the performance results in hand, you can confidently decide whether you officially apply your search optimization changes.
Explorer templates
On the Reports (platform-ca | platform-eu | platform-au) page, there are three Explorers templates to help you highlight specific data aspects.
The explorer templates are:
Activity
This explorer helps evaluate the level of adoption of the search solution by presenting Click Event Count and Search Event Count data and listing the top user queries (see Measure user adoption). Therefore, the report is useful to identify what users are looking for the most.
Content Gaps
This explorer highlights frequent queries with no results to help you identify potential content gaps, which is content that doesn’t exist yet (see Identify content gaps).
Relevance
This explorer helps identify relevance issues by highlighting the most frequent queries with the poorest Relevance Index based on the Click Event Count and Average Click Rank to help you focus on top occurrences that don’t return relevant results first (see Identify relevance issues).