Use Case: Create a dashboard linking to the Visit Browser
Use Case: Create a dashboard linking to the Visit Browser
You can use the Reports (platform-ca | platform-eu | platform-au) page of the Coveo Administration Console to create a custom dashboard that shows the case deflection trend inside your Coveo organization and links to the Visit Browser (platform-ca | platform-eu | platform-au) page to analyze visits where cases weren’t deflected.
By analyzing the exact queries that precede a case creation and browsing the user visits in which they were performed, an analytics manager can add content (such as Knowledge Base articles) to the website of their organization to improve case deflection and customer satisfaction (see Report on custom events). Once all the necessary changes are made, the analytics manager can assess if they impacted the case deflection trend. This article covers a way to do just that and describes one of the infinite possibilities you can achieve with custom dashboards.
|
|
Note
Before building this particular dashboard, you should get familiar with adding a custom dashboard and the Visit Browser features. |
Add a dashboard
Dashboards are divided into sections that can each contain any Coveo Analytics cards available in the Coveo Administration Console.
-
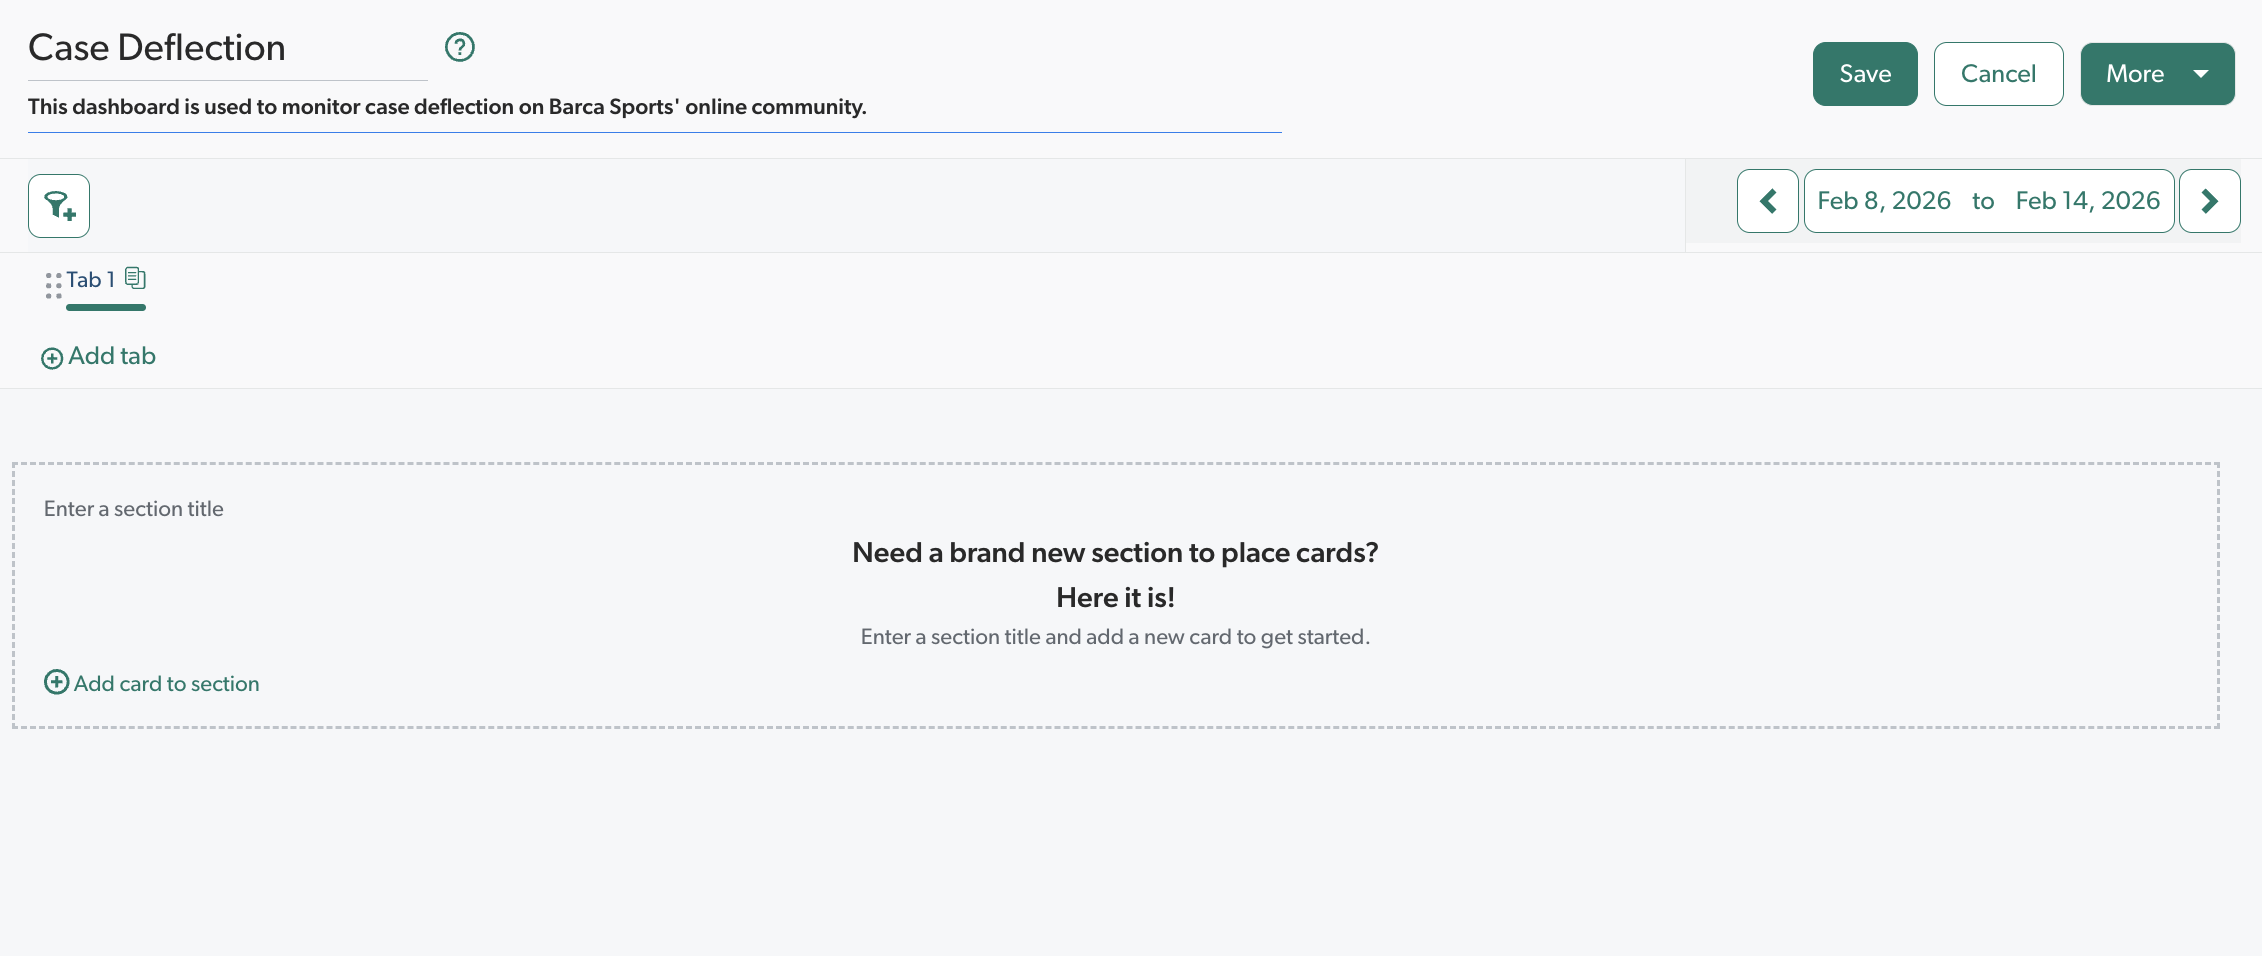
On the Reports (platform-ca | platform-eu | platform-au) page of the Administration Console, click Add, and then select Blank dashboard.
-
In the dashboard panel, enter a dashboard title, for example
Case Deflection. -
Enter a dashboard description that reflects its purposes.
ExampleThis dashboard is used to monitor case deflection on Barca Sports' online community. -
Click the time span on the right to select the time period for which you want to review the case deflection trend.
-
Click Save.
Add a Case Deflections section
-
Now that you’ve created your dashboard, click Edit to create a section.
-
Enter a section title, for example,
Case Deflections. -
Now that the section is created, add the necessary cards:
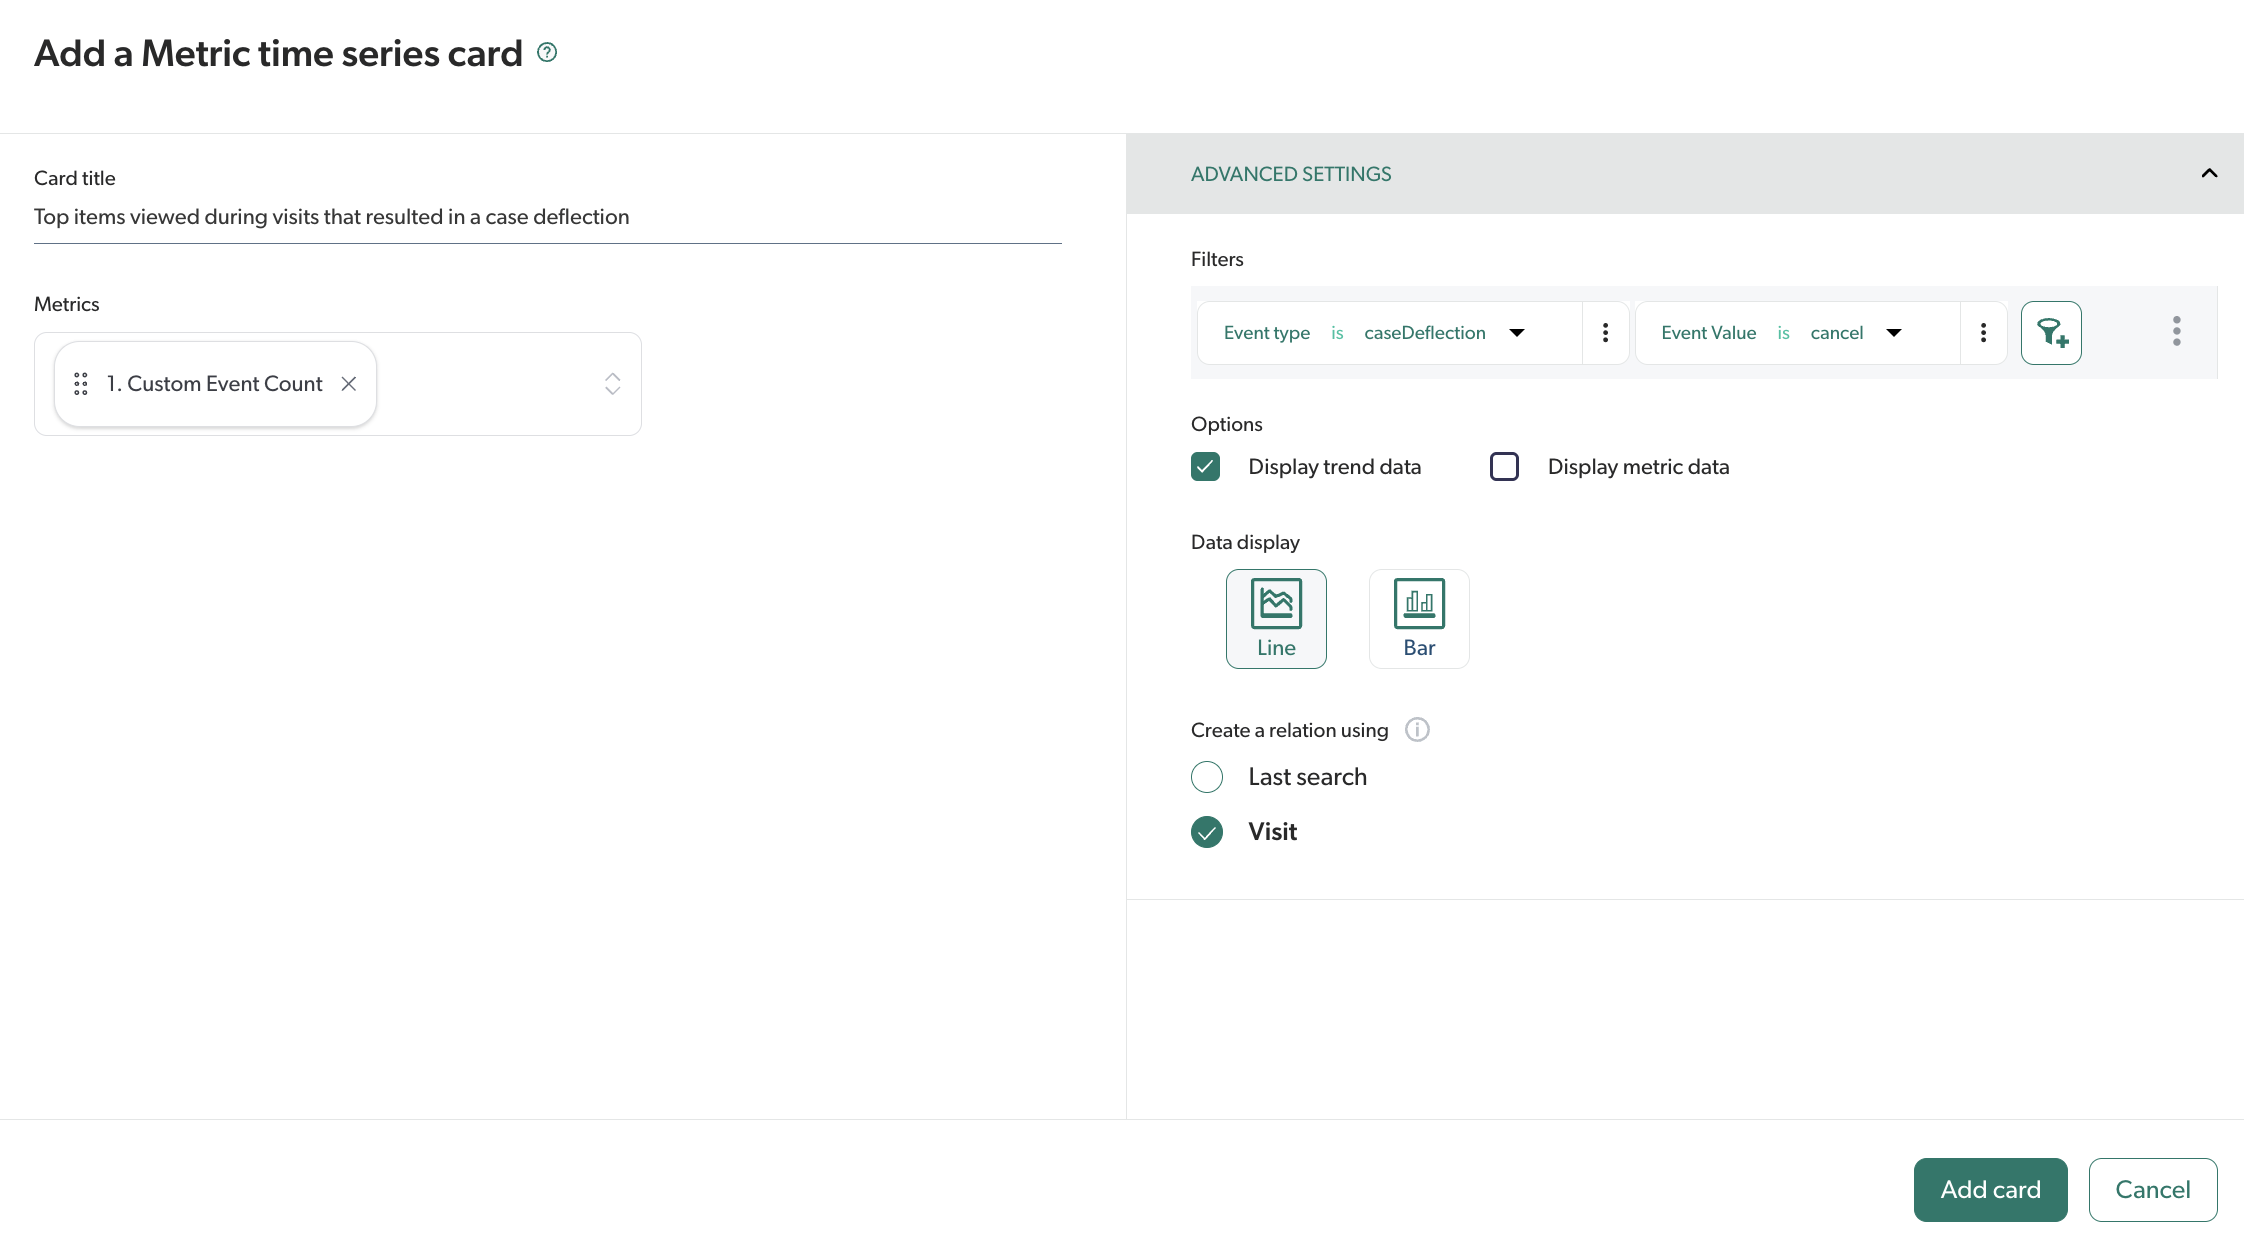
Add a Metric time series for case deflections
Add a time series that only shows the number of deflected cases in your organization over time.
-
In the Case Deflections section, click Add card to section.
-
In the Add a card panel, select Metric time series.
-
In the Add a Metric time series card panel, enter a card title, for example,
Case deflections over time. -
Under Metrics, select All.
-
Type
Custom Event Countto locate the required metric, or select Custom Event Count by scrolling the list of available metrics. -
In the Advanced settings section:
-
Add the following filters: Event Type is
caseDeflectionand Event Value iscancel. -
(Optional) Under Options, select Display trend data or Display metric data.
-
Under Data display, select Line.
-
Under Create a relation using, select Visit.
-
-
Click Add card.
-
Resize the graph to be able to see Average and Peak.
Add a Table for items viewed during a case deflection
Add a table that shows the viewed items which helped the user and they didn’t need to create a case.
-
In the Case Deflections section, click Add card to section.
-
In the Add a card panel, select Table.
-
In the Add a Table card panel, enter a card title.
-
Under Dimensions, select All.
-
In the search box, type
Document Titleto locate the required dimension, or select Document Title by scrolling the list.
-
-
Under Metrics, select All.
-
In the search box, type
Custom Event Countto locate the required metric, or select Custom Event Count by scrolling the list.
-
-
In the Advanced settings section:
-
Add the following filters: Document Title is not
n/aand Event Value iscancel. -
Under Sort direction, select Descending.
-
Under Create a relation using, select Visit.
-
-
Click Add card.
Add a Table for submitted queries
Add a table that shows the queries that were submitted during a visit where a case deflection occurred.
-
In the Case Deflections section, click Add card to section.
-
In the Add a card dialog, select Table.
-
In the Add a Table card panel, enter a card title.
-
Under Dimensions:
-
Select All.
-
In the search box, type
User Queryto locate the required dimension, or select User Query by scrolling the list.
-
-
Under Metrics:
-
Select All.
-
In the search box, type
Custom Event Countto locate the required metric, or select Custom Event Count by scrolling the list.
-
-
In the Advanced settings section:
-
Add the following filter: User Query is not
blankorn/a. -
Under Sort direction, select Descending.
-
Under Create a relation using, select Visit.
-
-
Click Add card.
Add an items viewed Metrics card
Create a metrics card that shows the number of items viewed in a visit in which a case was deflected.
-
In the Case Deflections section, click Add card to section.
-
In the Add a card dialog, select Metric to create a metrics card that shows the number of items viewed in a visit in which a case was deflected.
-
In the Add a Metric Card dialog, enter a card title.
-
Under Metric:
-
Select All.
-
In the search box, type
Click Event Countto locate the required metric, or select Click Event Count by scrolling the list.
-
-
In the Advanced settings section:
-
Add the following filter: Event Value is
cancel. -
(Optional) Under Option, select Display trend data.
-
Under Create a relation using, select Visit.
-
-
Click Add card.
Add a submitted queries Metric card
Create a metrics card that shows the number of queries submitted in a visit in which a case was deflected.
-
In the Case Deflections section, click Add card to section.
-
In the Add a card dialog, select Metric.
-
In the Add a Metric Card dialog, enter a card title.
-
Under Metric:
-
Select All.
-
In the search box, type
Search Event Countto locate the required metric, or select Search Event Count by scrolling the list.
-
-
In the Advanced settings section:
-
Add the following filter: Event Value is
cancel. -
(Optional) Under Option, select Display trend data.
-
Under Create a relation using, select Last search.
-
-
Click Add card.
Add a Case Creations section
Now that you’ve added your last card in the Case Deflections section, you can add a section to monitor case creations.
-
Create a new section by entering the title
Case Creation. -
Now that the section is created, add the necessary cards:
Add a Metric time series for case creation
Create a time series that shows the number of created cases in your organization over time.
-
In the Case creation section, click Add card to section.
-
In the Add a card panel, select Metric time series.
-
In the Add a Metric time series card panel, enter a card title.
-
Under Metrics, select All.
-
Type
Custom Event Countto locate the required metric, or select Custom Event Count by scrolling the list. -
In the Advanced settings section:
-
Add the following filter: Event Type is
all. -
Add the following filter: Event Value is
caseCreate. -
(Optional) Under Options, select Display trend data.
-
Under Data display, select Line.
-
Under Create a relation using, select Visit.
-
-
Click Add card.
-
Resize the graph to be able to see Average and Peak.
-
Select Day from the available time intervals on the graph.
Add a Table for submitted queries during a case creation
Add a table that shows the queries that were submitted the most during a visit where a case creation occurred.
-
In the Case creation section, click Add card to section.
-
In the Add a card dialog, select Table.
-
In the Add a Table card panel, enter a card title.
-
Under Dimensions:
-
Select All.
-
In the search box, type
User Queryto locate the required dimension, or select User Query by scrolling the list.
-
-
Under Metrics:
-
Select All.
-
In the search box, type
Custom Event Countto locate the required metric, or select Custom Event Count by scrolling the list. -
In the same search box, type
Unique User IDto locate the required metric, or select Unique User ID by scrolling the list.
-
-
In the Advanced settings section:
-
Add the following filters: Event Value is
caseCreateand User Query is notblankorn/a. -
In Value destination link, add the following URL and complete the date interval (start date and end date) parameter in
dd-mm-yyyyformat:https://platform.cloud.coveo.com/#usage/visit?from=<StartDate>&to=<EndDate>&f=%28customEventType%3D%3D%27Search%27%29AND%28queryexpression%3D~%27{value}%27%29&f=%28customevent.value%21%3Dnull%29AND%28customeventvalue%3D%3D%27caseCreate%27%29 Note
NoteClicking a table value opens the Visit Browser with the following two filters:
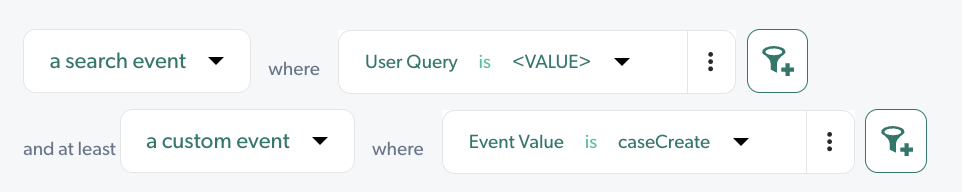
where
<VALUE>is replaced with the clicked value in the table, allowing you to browse all user visits that match these two criteria. -
Under Sort direction, select Descending.
-
Under Create a relation using, select Last search.
-
-
Click Add card.
-
Click Save to save the dashboard.
Required privileges
The following table indicates the required privileges to view and edit dashboards from the Reports (platform-ca | platform-eu | platform-au) page and associated panels. Learn more about the Privilege reference or how to manage privileges.
|
|
Note
Access to dashboards or part of their content may be further restricted as a function of the member. See how you can manage access to reports and manage permission filters. |
| Action | Service | Domain | Required access level |
|---|---|---|---|
View dashboards |
Analytics |
Analytics data |
View |
Dimensions |
View |
||
Named filters |
View |
||
Permission filters |
View |
||
Reports |
View |
||
Organization |
Organization |
View |
|
Edit dashboards |
Analytics |
Administrate |
Allowed |
Analytics data |
View |
||
Data exports |
Edit |
||
Dimensions |
View |
||
Named filters |
View |
||
Permission filters |
View |
||
Reports |
Edit |
||
Organization |
Organization |
View |