Add dashboards
Add dashboards
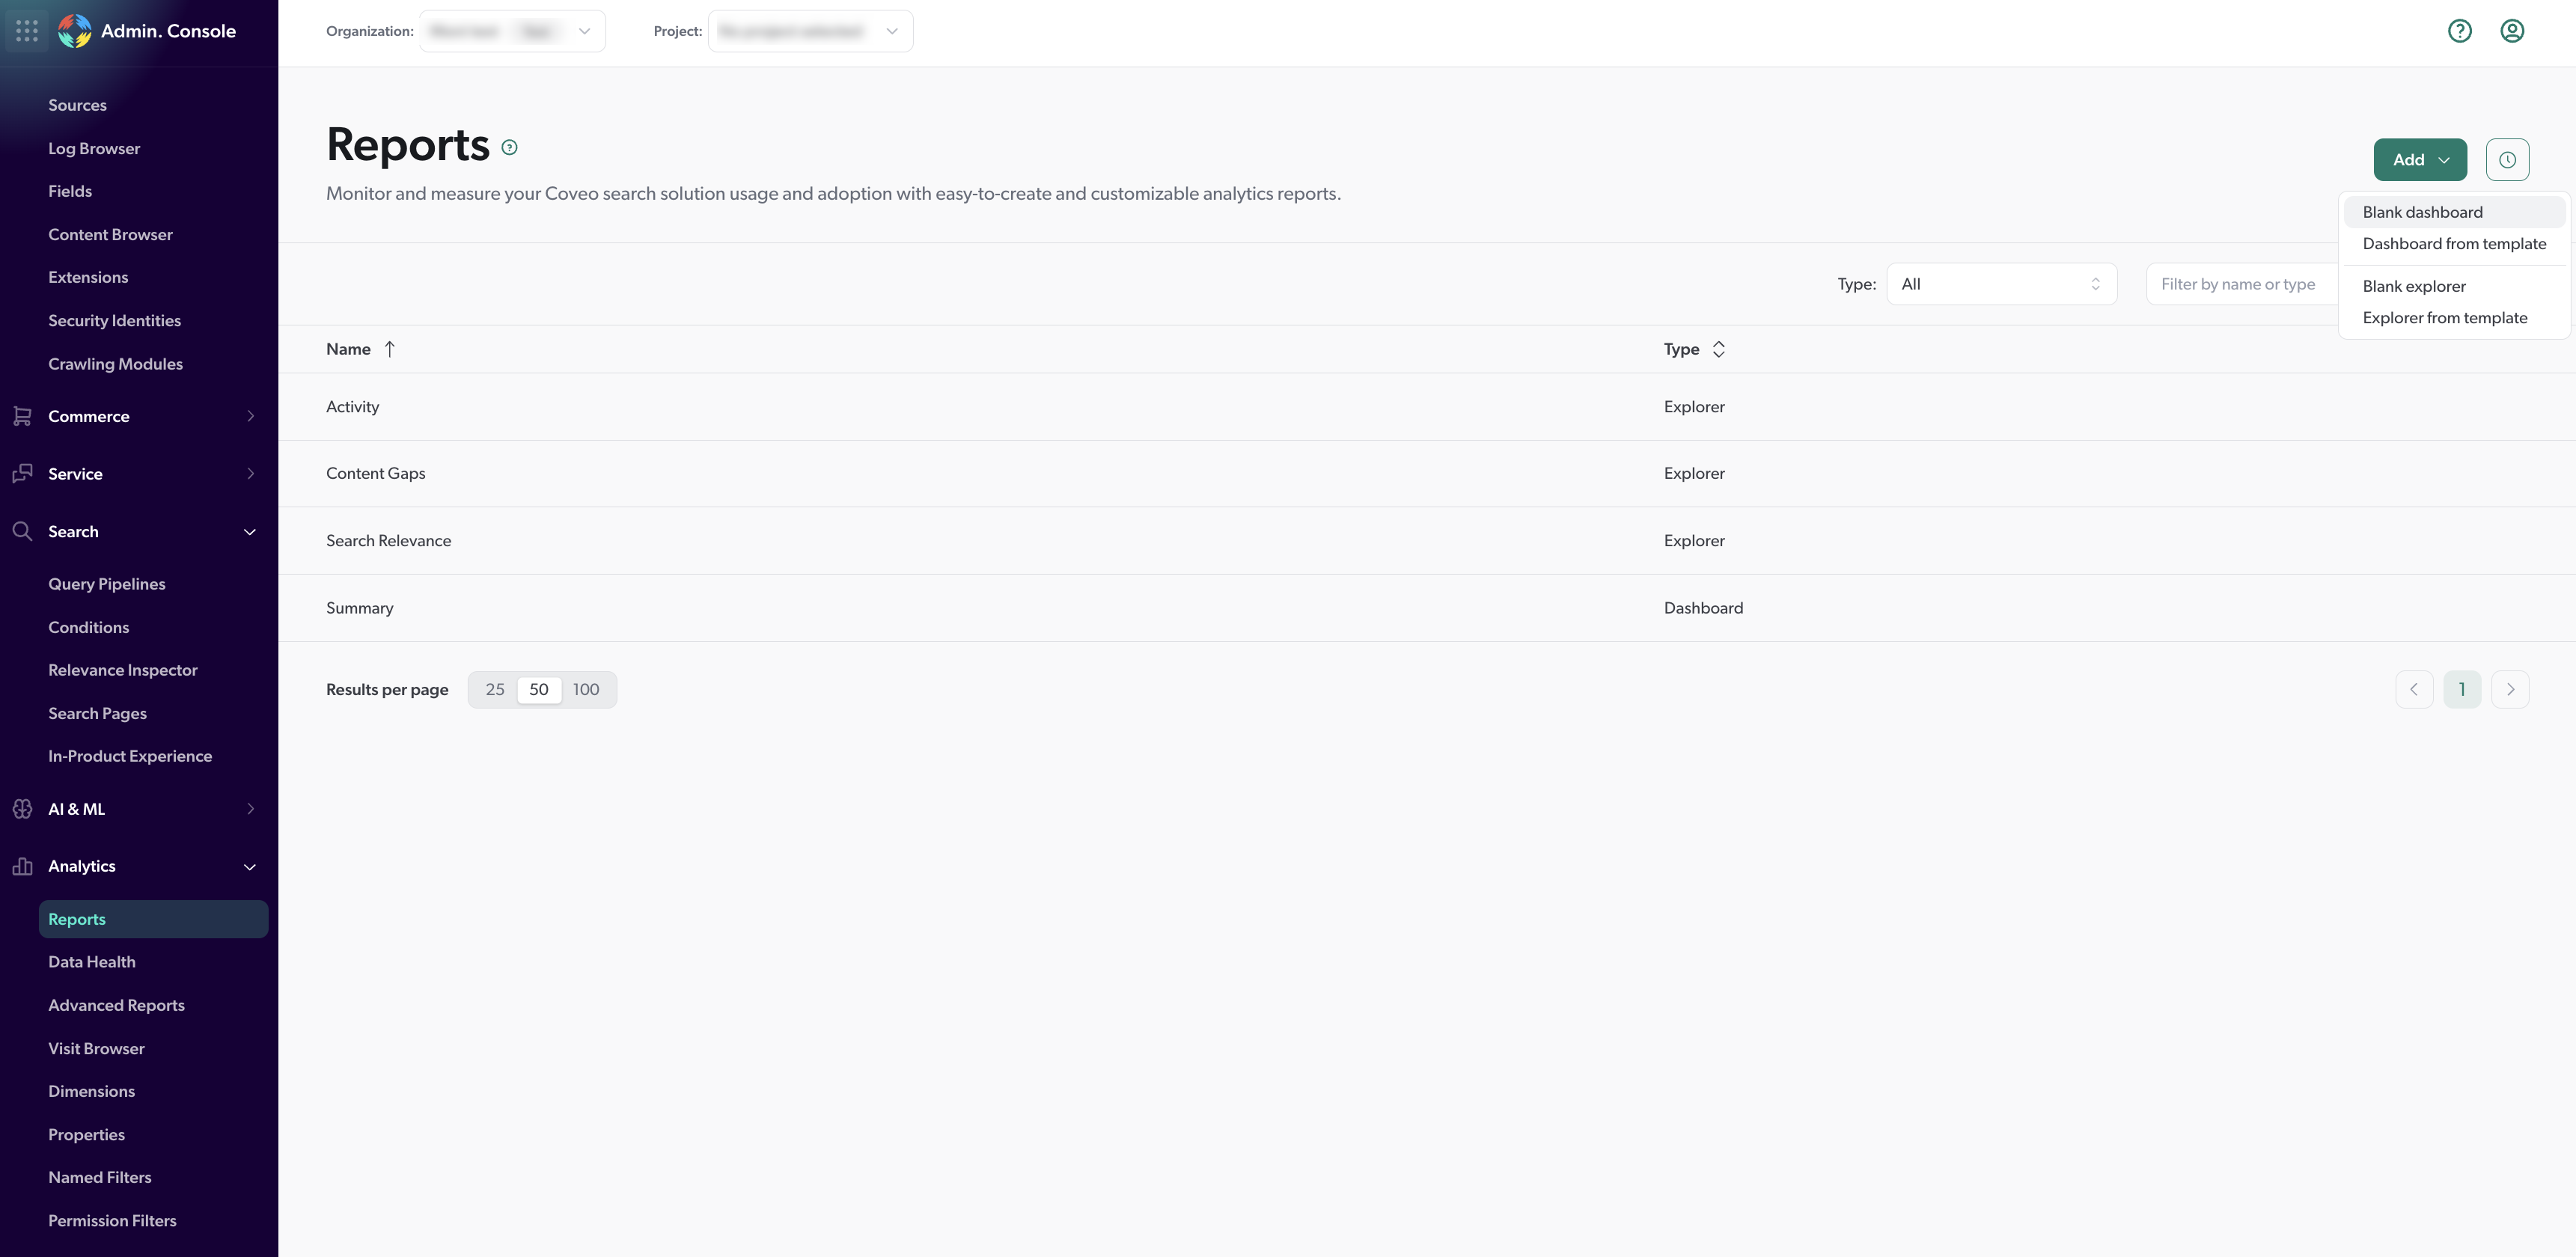
Members with the required privileges can use the Reports (platform-ca | platform-eu | platform-au) page of the Analytics section of the Coveo Administration Console to create custom dashboards.
These dashboards can be used to focus on trends and anomalies that aren’t normally found in the default Summary dashboard.
|
|
Note
By default, members of the Administrators and Analytics Managers groups of your organization have access to all dashboards. Dashboards can also be shared with specific members or saved for your own personal use (see Manage the Access to the Dashboard). |
Add a dashboard
-
On the Reports (platform-ca | platform-eu | platform-au) page, do one of the following:
-
To duplicate an existing dashboard, click the dashboard you want to copy, and then click Duplicate in the Action bar.
-
To create a blank dashboard, click Add, and then select Blank dashboard.
-
To create a dashboard using a preconfigured template:
-
Click Add, and then select Dashboard from template.
-
In the Select a Template panel, select one of the available templates.
-
Click Select Template.
-
If using one of the following templates, specify the template settings:
-
-
-
In the upper-left corner of the report, enter or edit the name and description for the dashboard.
-
Click Save.
-
Add, remove, or modify filters, tabs, sections, and cards as required (see Review and manage dashboards).
|
|
Group this report and your other implementation resources together in a project. See Manage projects. |
Templates requiring configuration
"General Search Interface Metrics" template
In the Add General Search Interface Metrics Report panel:
-
Under Search interface, click the dropdown menu, and then select the search interface you want to analyze.
-
Click Add report.
"Generative Answering Performance" template
This template is designed to analyze the performance of a generative answering implementation using Relevance Generative Answering.
|
|
Notes
|
In the Add Generative Answering Performance Report panel:
-
Under Select the search hub interface (Origin level 1) where Relevance Generative Answering is deployed, select the search interface that you want to analyze.
-
Under Select the answer generated custom dimension name, select the
c_answergeneratedcustom dimension that you created for the Search Agent or RGA. -
(Optional) Under Select the Case Submission custom event value, select the custom event value that’s logged when a user submits a case during the same search interface visit. This data is used to populate the report cards in the dashboard’s Self Service tab, and lets you see the impact of generative answering on case submission, and by extension on self-service success.
-
Click Add report.
"Search Agent Performance" template
This template is designed to analyze the performance of a Coveo Search Agent implementation and the conversational search experience it delivers.
|
|
Notes
|
In the Add Search Agent Performance Report panel:
-
Under Search Hub (Origin level 1), select the search hub where the Search Agent is deployed.
-
(Optional) Under Select the Case Submission custom event type, select the custom event type that’s logged when a user submits a case during the same visit. This data is used to populate the report cards in the dashboard’s Self Service tab, and lets you see the impact of the Search Agent on self-service success.
-
Click Add report.
"Case Deflection Performance Dashboard" template
In the Add Case Deflection Performance Dashboard Report panel:
-
Under Average Cost per Support Incident, enter your organization’s average cost per support incident. This value helps calculate the cost savings from case deflection.
-
Under Case creation search hub, select the search hub for the Case Assist experience you want to analyze.

The search hub value must match the name of your Case Assist configuration.
-
Under Select your case submission event type, select the event type for the case submission event you want to analyze (for example,
ticket_create). -
Under Select your case submission event value, select the event value for the case submission event you want to analyze. Leave this field empty if you selected
ticket_createin the previous step. -
Click Add report.
For more information about the available metrics, see Generate Case Assist reports.
"Self-Service and Case Deflection" template
In the Self-Service and Case Deflection Report panel:
-
Under Average Cost per Support Incident, enter your organization’s average cost per support incident. This value helps calculate the cost savings from case deflection.
-
Under Self-service portal search hub, select the search hub for the self-service portal you want to analyze.
-
Under Select the knowledge or problem resolution source, select the knowledge or problem resolution source you want to analyze.
This is typically a source of content which helps answer questions that would otherwise lead to a case submission.
-
-
Under Case creation search hub, select the search hub for the Case Creation page you want to analyze.
-
Under Select your case submission event type, select the event type for the case submission event you want to analyze (for example,
ticket_create). -
Under Select your case submission event value, select the event value for the case submission event you want to analyze. Leave this field empty if you selected
ticket_createin the previous step.
-
-
Click Add report.
For more information about the available metrics, see Review your company self-usage.
"Search Performance" template
In the Add Search Performance Report panel:
-
Under Select search interface (Origin level 1), click the dropdown menu, and then select the search interface you want to analyze.
-
Click Add report.
"Support Agents Adoption" template
|
|
Note
This report uses custom data, and therefore only works with the UA Protocol. If your Coveo implementation uses the Event Protocol, this report won’t function as expected. |
In the Add Support Agents Report panel:
-
In the first input, enter the Total number of agents in your organization.
-
In the Select custom dimension name (unique case identifier) input, enter the name of the dimension that uniquely identifies your support cases.
-
Under Select agent side panel (Origin level 1), click the dropdown menu, and then select the search interface you want to analyze.
-
Under Select agent full search page (Origin level 1), click the dropdown menu, and then select the search interface you want to analyze.
-
Click Add report.
 Note
NoteWhen you don’t already have a dimension that covers this use case, ask a developer to set up the dimension, and then add it in the Administration Console (see Send your own events and Add dimension on custom metadata). Otherwise, some metric cards on the report won’t load.
"A/B Testing" template
|
|
Note
Your Coveo organization must contain at least two query pipelines associated with an active A/B Test, and usage analytics data must be available for at least one of the two pipelines.
Otherwise, you’ll get the |
In the Add A/B Testing Report panel:
-
Under Select A/B test, click the dropdown menu, and then select one of the available test sets.
NoteThe dropdown menu lists all test sets available for your Coveo organization, not only the A/B tests created in the Coveo Administration Console.
-
In the Select item A and Select item B dropdown menu, select the two items (not necessarily pipelines) in the selected test set that you want to compare.
-
Click Add report.
Required privileges
The following table indicates the required privileges to view and edit dashboards from the Reports (platform-ca | platform-eu | platform-au) page and associated panels (see Manage privileges and Privilege reference).
|
|
Note
Access to dashboards or part of their content may be further restricted as a function of the member (see Manage access to reports and Manage permission filters). |
| Action | Service | Domain | Required access level |
|---|---|---|---|
View dashboards |
Analytics |
Analytics data |
View |
Reports |
View |
||
Organization |
Organization |
View |
|
Edit dashboards |
Analytics |
Administrate |
Allowed |
Analytics data |
View |
||
Reports |
Edit |
||
Organization |
Organization |
View |