Relevance Generative Answering (RGA) reports and UA events
Relevance Generative Answering (RGA) reports and UA events
To track the usage of Relevance Generative Answering (RGA), Coveo Analytics logs events for actions performed on the RGA component in your search interface.
This article provides instructions on how to create a report to view the performance of your RGA implementation, and provides a reference for the RGA Coveo Analytics events that are tracked by Coveo UA.
Add custom dimensions
To be able to create a report to view data on the RGA custom UA events, you must add the following custom dimensions to your Coveo organization:
-
c_answergenerated -
To view event data collected from the RGA feedback modal:
-
c_helpful -
c_readable -
c_documented -
c_correctTopic -
c_hallucinationFree -
c_details -
c_documentUrl
-
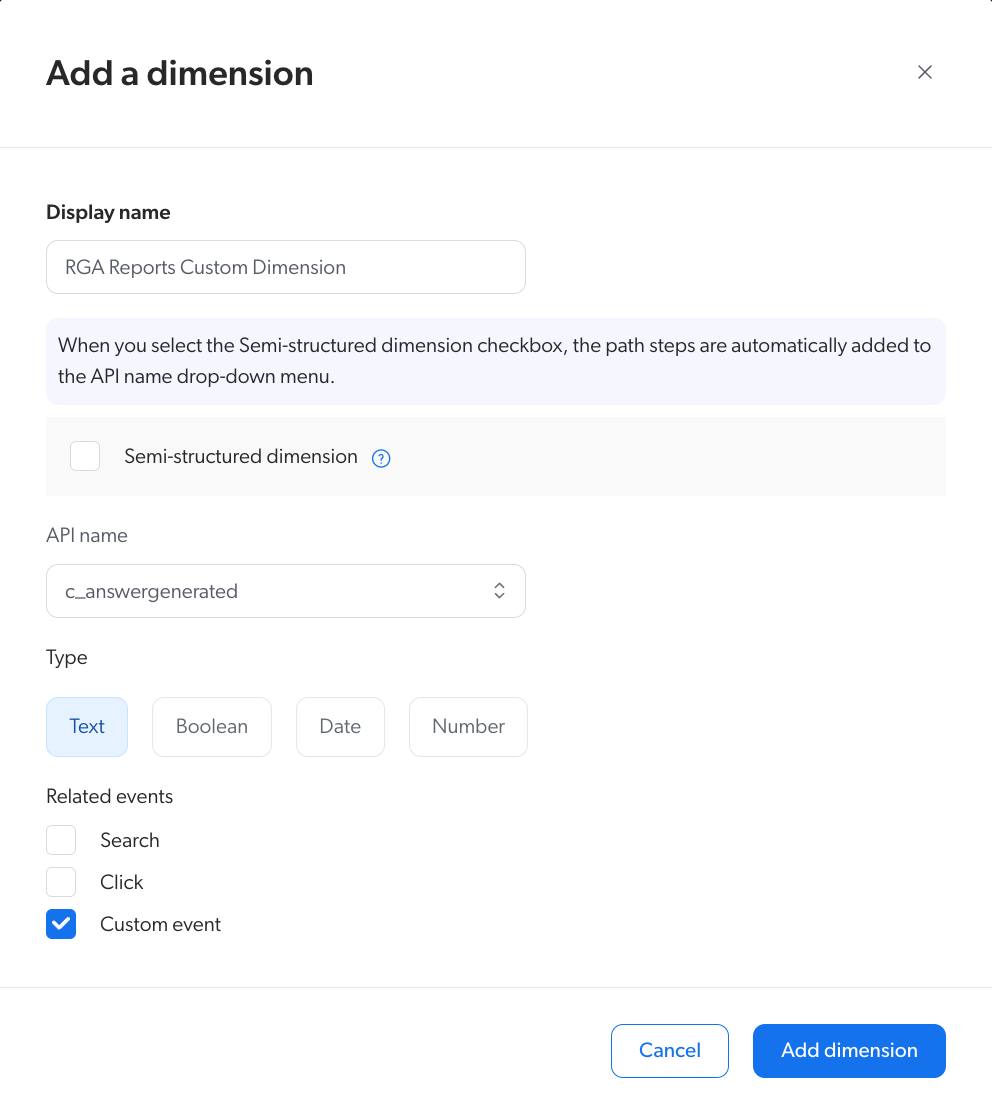
To add a custom dimension for RGA
Add a dimension using the following criteria:
-
For each of the custom dimensions, API name is the name of the dimension. For example, when creating the
c_answergenerateddimension, API name isc_answergenerated. -
For each of the custom dimensions, Related events must be set to Custom event.
To create the c_answergenerated dimension, the settings are as follows:
Create an RGA report
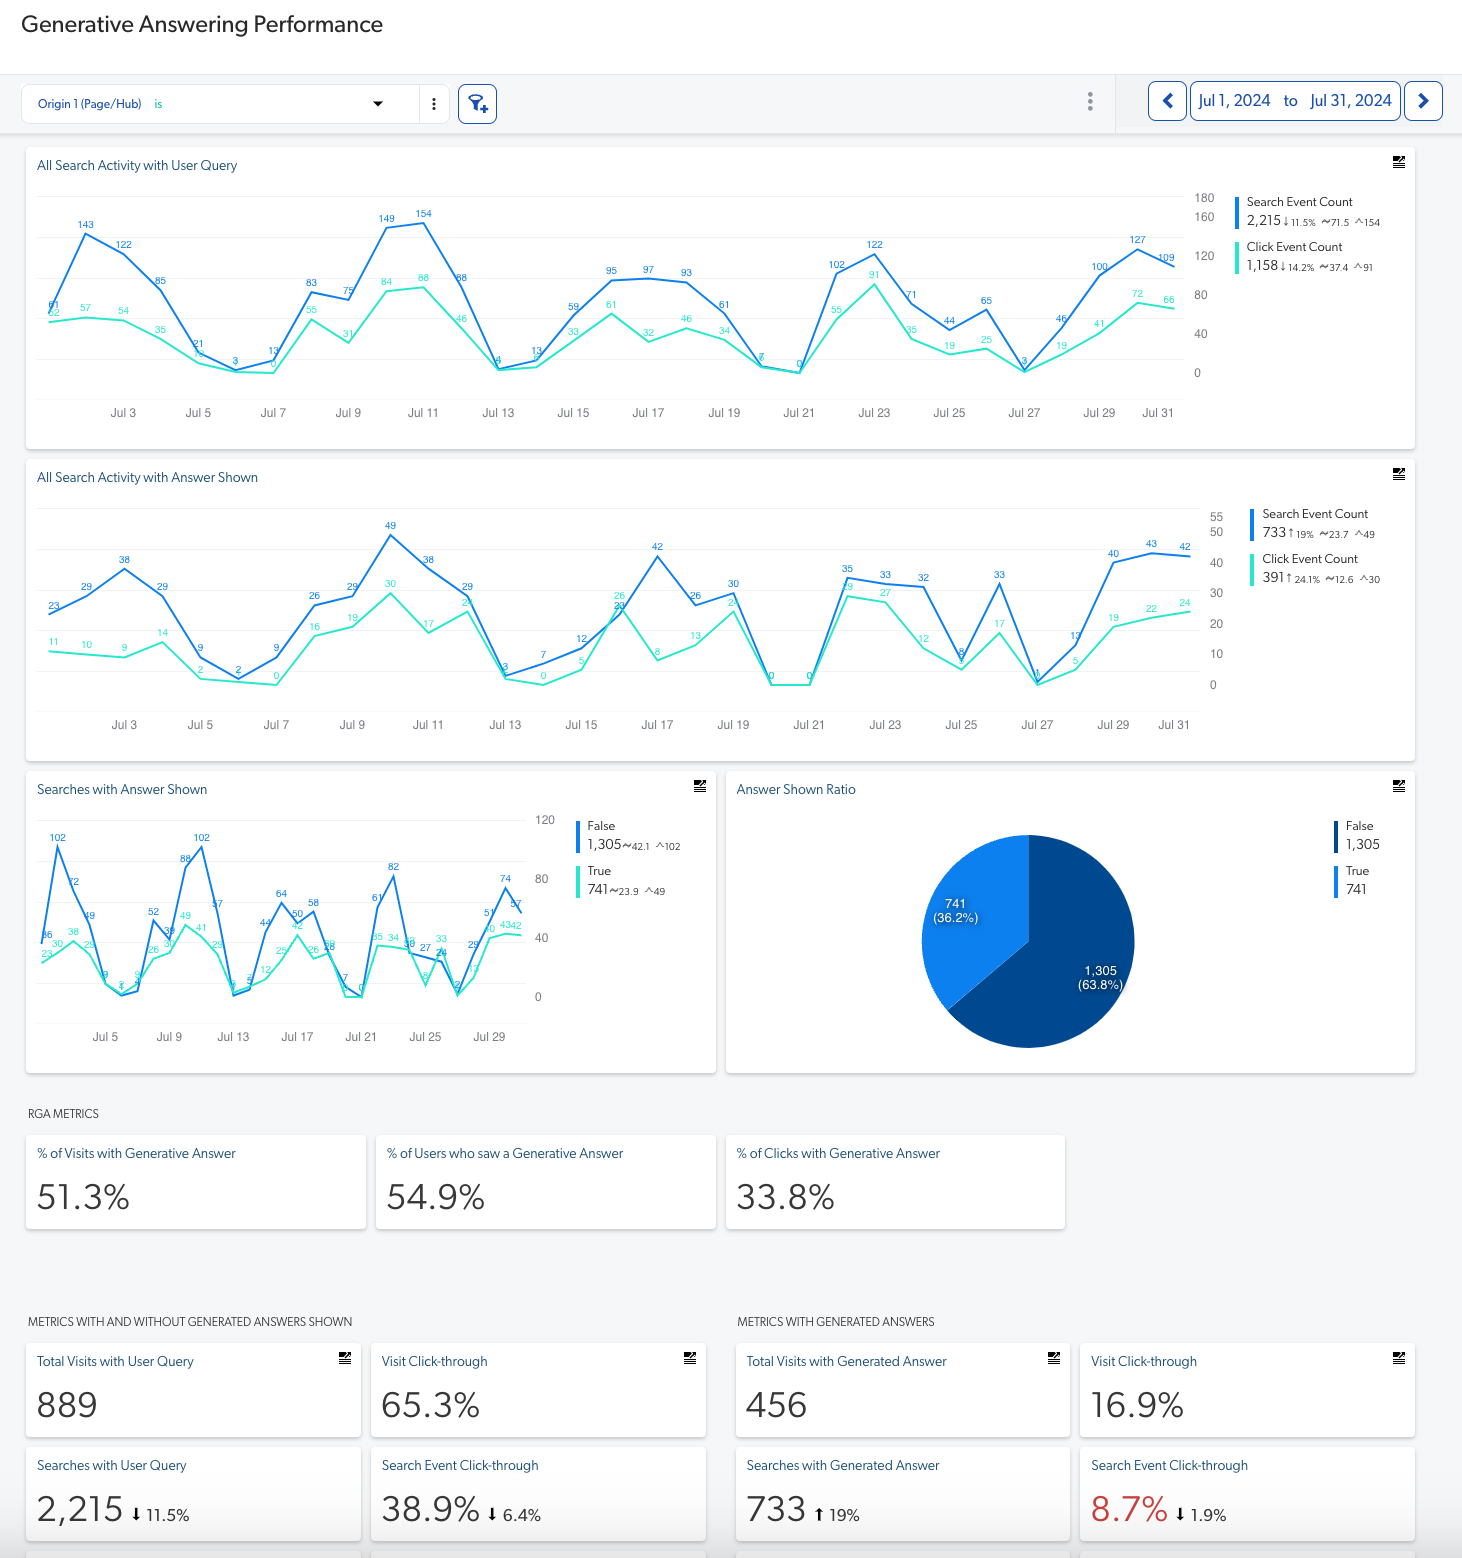
You can quickly create a report to analyze the performance of your Relevance Generative Answering (RGA) implementation by using the preconfigured Generative Answering Performance Coveo Analytics dashboard template.
The template creates a report with three tabs:
-
Search Metrics: Contains report cards that show metrics such as the number of generated answers, click-through rate, and top queries with and without generated answers.
-
User Feedback: Displays data collected through the RGA feedback modal.
 Note
NoteIf your RGA-enabled search interface is associated with an answer configuration in the Knowledge Hub, you must use the Knowledge Hub to view the answer feedback data. In this case, the user feedback data won’t appear in reports that are generated using the Generative Answering Performance template.
-
Self Service: Lets you see the impact of RGA on case submission, and by extension on self-service success, if you’re logging a custom event when a user submits a case during the same visit when accessing the RGA-enabled search interface.
-
If you haven’t done so already, add the custom dimensions to your Coveo organization.
-
Add a dashboard using the Generative Answering Performance template.
RGA usage analytics events
This section lists the custom usage analytics events for RGA.
| Value | Event | ||
|---|---|---|---|
|
The answer was successfully streamed in the search interface. This event won’t be logged if the user initiates another search while the answer is being generated. |
||
In customData: |
An answer was successfully generated for the query. |
||
In customData: |
An answer wasn’t generated for the query because there wasn’t enough relevant information to generate an answer.
|
||
|
A citation link was clicked.
|
||
|
A user hovered over a citation link. |
||
|
A user clicked the thumbs-up icon to provide positive feedback for the generated answer. |
||
|
A user clicked the thumbs-down icon to provide negative feedback for the generated answer. |
||
|
If the thumbs-up or thumbs-down icon is clicked, the user submits feedback details using the RGA feedback modal. |
||
|
A user clicked the copy button to copy the generated answer to their clipboard. |
||
|
A user closed (hid) the RGA component. |
||
|
A user opened (showed) the RGA component. |
||
|
A user expanded the generated answer using Show more.
|
||
|
A user collapsed the generated answer using Show less.
|
Inspect your search page
Use your browser developer tools to retrieve what’s being tracked:
-
Open a Coveo-powered search interface with RGA enabled.
-
Open your web browser’s developer tools.
NoteThe examples in this article use the Google Chrome developer tools. For browser-specific information, see:
-
Select the Network tab.
-
On the search page, perform a query that will generate an answer.
-
Back in the developer tools window, under the Name column, click the latest
customcall to Coveo UA. -
Select the Payload tab. You should now see the tracked Coveo Analytics event.