Analyze RGA data in Snowflake
Analyze RGA data in Snowflake
Snowflake is a cloud-based data platform in which Coveo data is stored and managed. This includes a broad range of data related to Coveo Relevance Generative Answering (RGA).
You can use Snowflake to analyze the question-answer pairs for your RGA implementation and gain a deeper understanding of the relationship between user queries and generated answers. For more information, see Why use Snowflake to analyze RGA data.
To analyze RGA data in Snowflake, you must do the following:
Why use Snowflake to analyze RGA data?
In the context of RGA data, analyzing the different question-answer pairs can be complex. Therefore, exploring your RGA data in Snowflake can provide valuable insights into the performance of your generated answers. This closer look not only sheds light on the specific needs and concerns of your audience but also highlights the effectiveness of current responses.
For example, after creating an RGA report in the Coveo Administration Console, you retrieve key metrics such as the number of generated answers, click-through rate, and more. You also note the collection of user feedback through thumbs-up and thumbs-down responses.
However, you want to understand the context of these interactions and feedback by examining the actual questions and answers. By analyzing the question-answer pairs in Snowflake, you enhance your knowledge of the most common user queries.
Gain access to RGA data in Snowflake
To analyze RGA data in Snowflake, you can run SQL queries in the Snowflake console. To get started, you must first have access to the QUESTION_ANSWERING schema in the Snowflake console.
You can access the schema by using one of the following methods:
-
The Snowflake reader account
The reader account is created for an individual Coveo organization and is managed in the Raw Data (platform-ca | platform-eu | platform-au) page of the Coveo Administration Console.
-
If you already have a reader account, go to the Reader Account (platform-ca | platform-eu | platform-au) subtab, and click Access Snowflake. This takes you to the Snowflake console, where you can access your data.
-
If you don’t have a reader account, create one by following the steps in the Manage Snowflake reader account article.
-
-
The Snowflake Data Share feature
When you have your own Snowflake account, you can use the Snowflake Data Share feature. This feature is managed through the Data Share (platform-ca | platform-eu | platform-au) page on the Coveo Administration Console. Once you’ve initiated the data share and retrieved the corresponding shares within Snowflake, you can access the QUESTION_ANSWERING schema.
|
|
Note
Before using either method, Snowflake access must be enabled for your Coveo organization. |
SQL query examples for RGA data
This section provides examples of SQL queries you can run in Snowflake to analyze RGA data.
-
Retrieves all generated answers for a specific date range and search hub.
-
Retrieves answers with feedback for a specific date range and search hub.
-
Retrieves all answer variations for a specific query over time.
-
Search performance (CTR) query
Analyzes the impact of generated answers on click-through rates (CTR).
You can run these queries in a worksheet in the Snowflake console.
|
|
Notes
|
All answers query
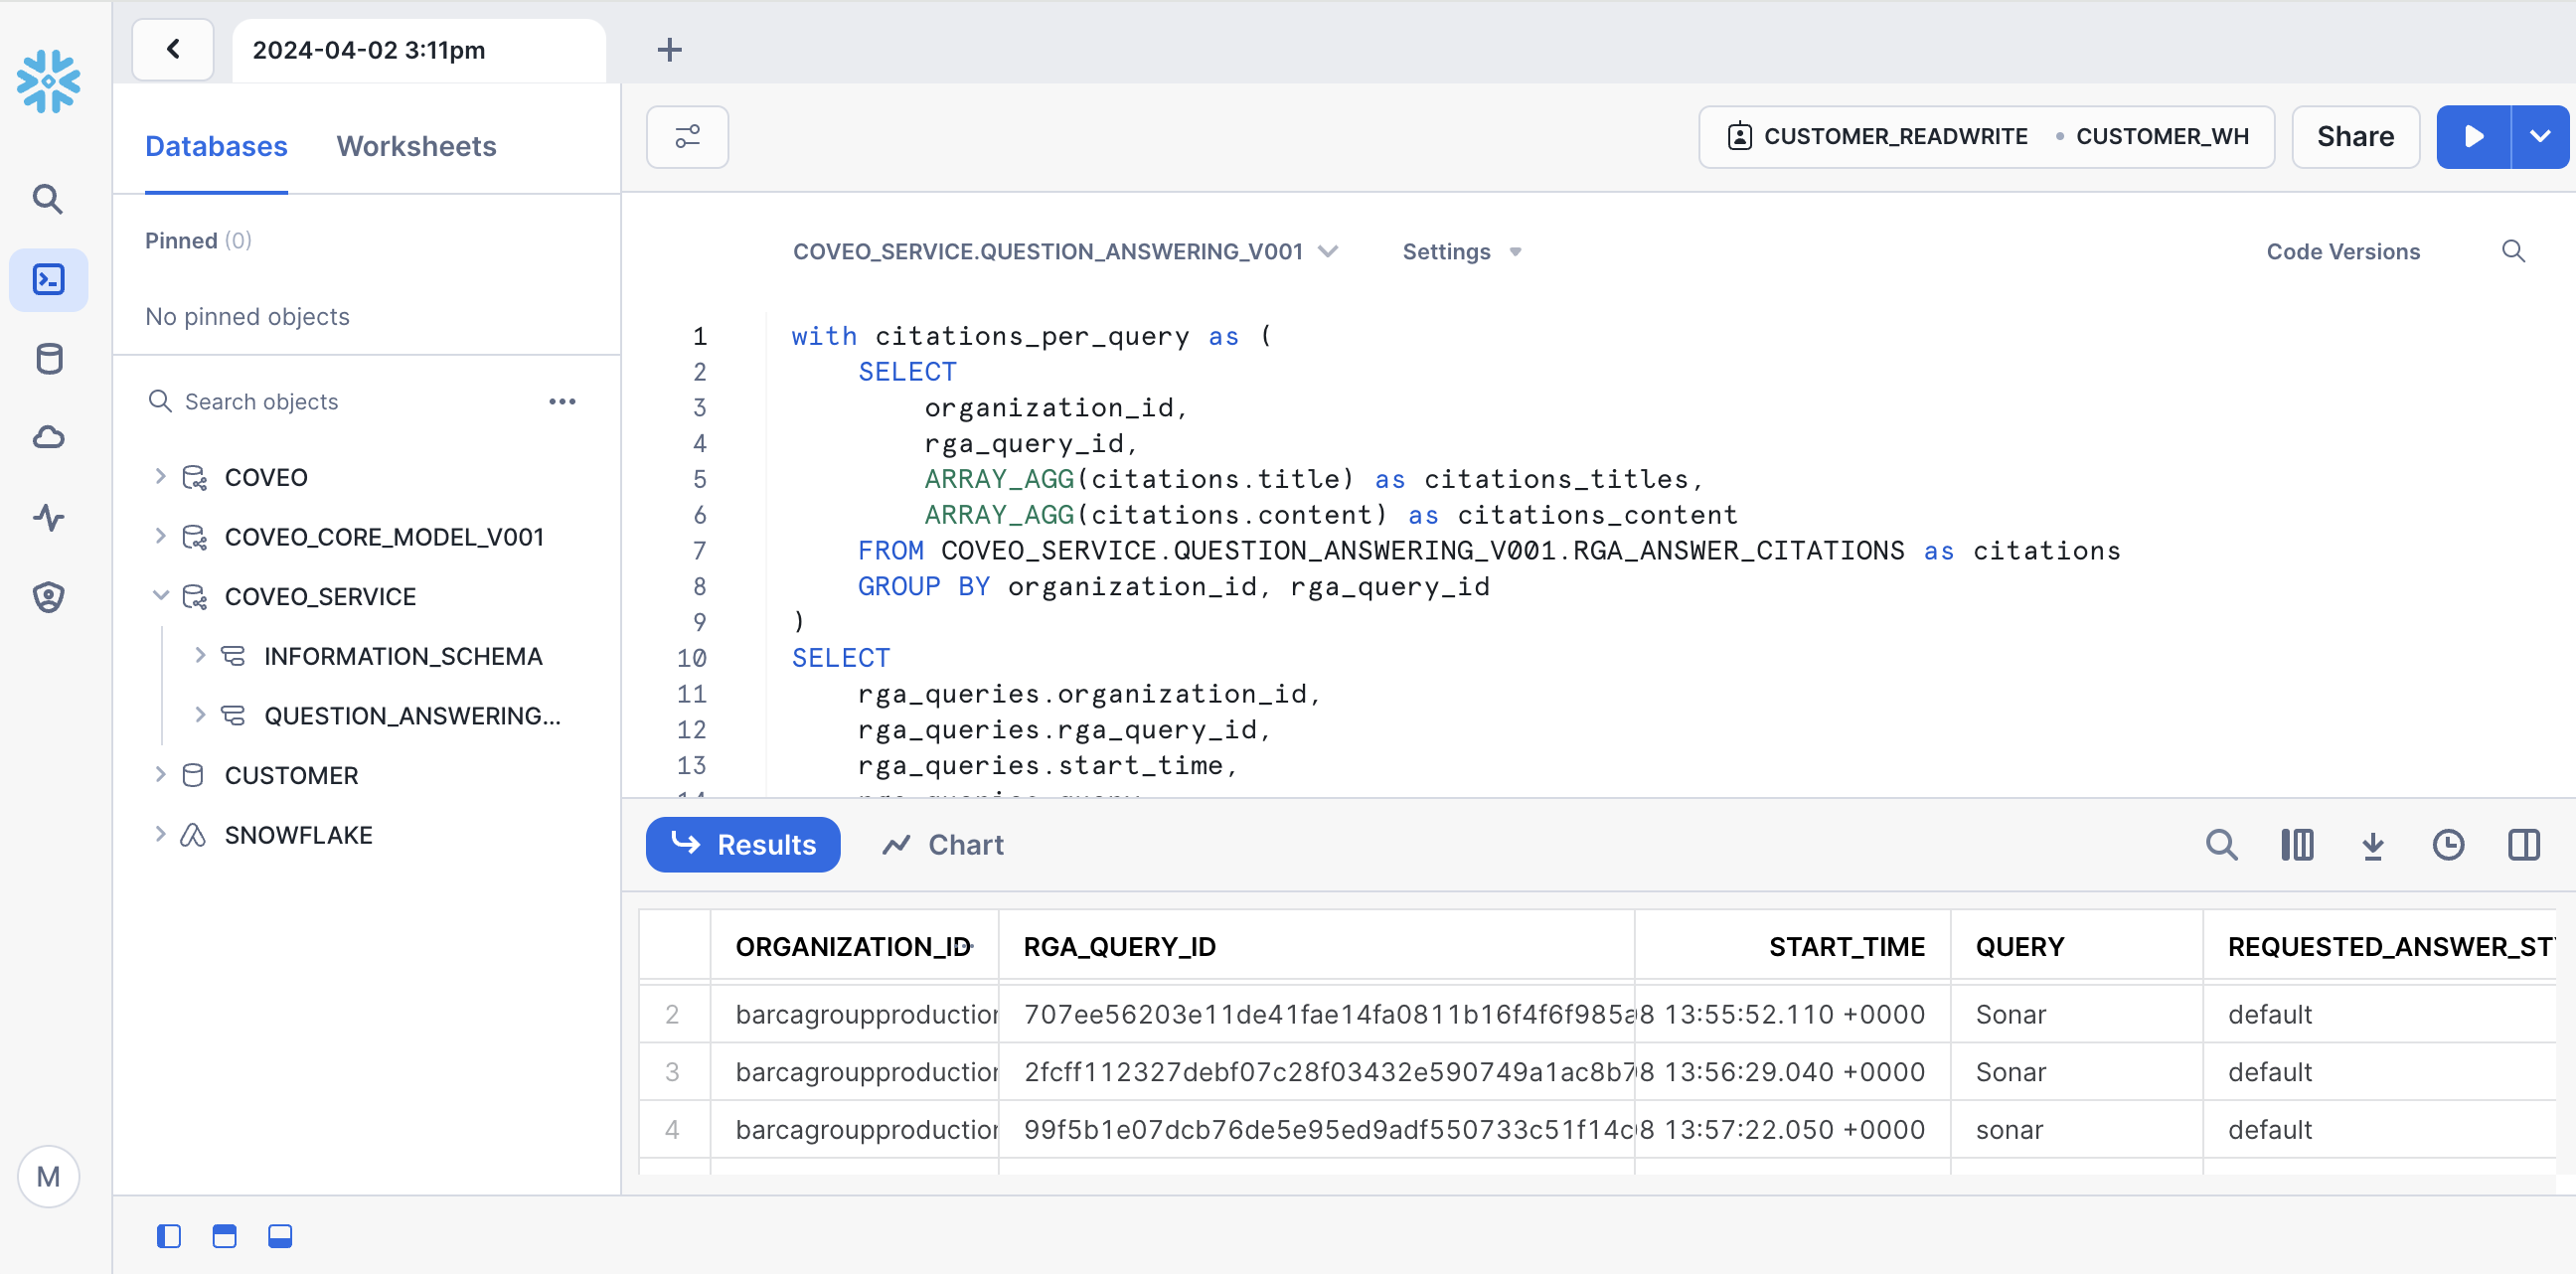
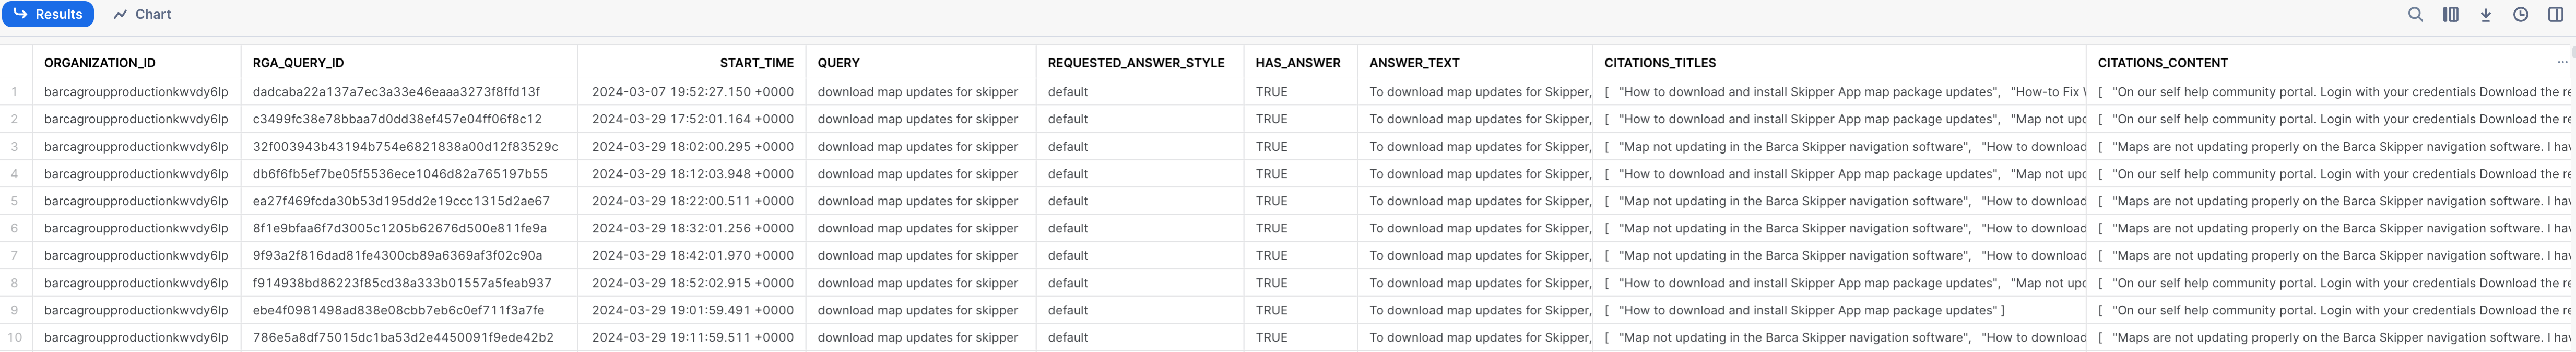
To view all generated answers, run the following SQL query:
with citations_per_query as (
    SELECT
        organization_id,
        rga_query_id,
        ARRAY_AGG(citations.title) as citations_titles,
        ARRAY_AGG(citations.content) as citations_content
    FROM COVEO_SERVICE.QUESTION_ANSWERING_V001.RGA_ANSWER_CITATIONS as citations
    GROUP BY organization_id, rga_query_id
)
SELECT
    rga_queries.organization_id,
    rga_queries.rga_query_id,
    rga_queries.start_time,
    rga_queries.query,
    rga_queries.requested_answer_style,
    rga_queries.has_answer,
    rga_queries.answer_text,
    citations_titles,
    citations_content
FROM COVEO_SERVICE.QUESTION_ANSWERING_V001.RGA_QUERIES as rga_queries
JOIN COVEO."ua"."searches_shared" as searches
    ON rga_queries.organization_id = searches."account_id"
    AND rga_queries.insight_xid = searches."search_id"
LEFT JOIN citations_per_query as citations
ON rga_queries.organization_id = citations.organization_id
AND rga_queries.rga_query_id = citations.rga_query_id
WHERE to_date(rga_queries.start_time) BETWEEN '<YYYY-MM-DD>' AND '<YYYY-MM-DD>'
AND has_answer
AND searches."origin_level_1" = '<YOUR SEARCH HUB>';
Where you replace:
-
<YOUR SEARCH HUB>with the name of your search hub. -
occurrences of
<YYYY-MM-DD>with the date range you want to analyze.
After running the query, here’s an example of what the SQL results table in the Snowflake console should look like:
Answers with feedback query
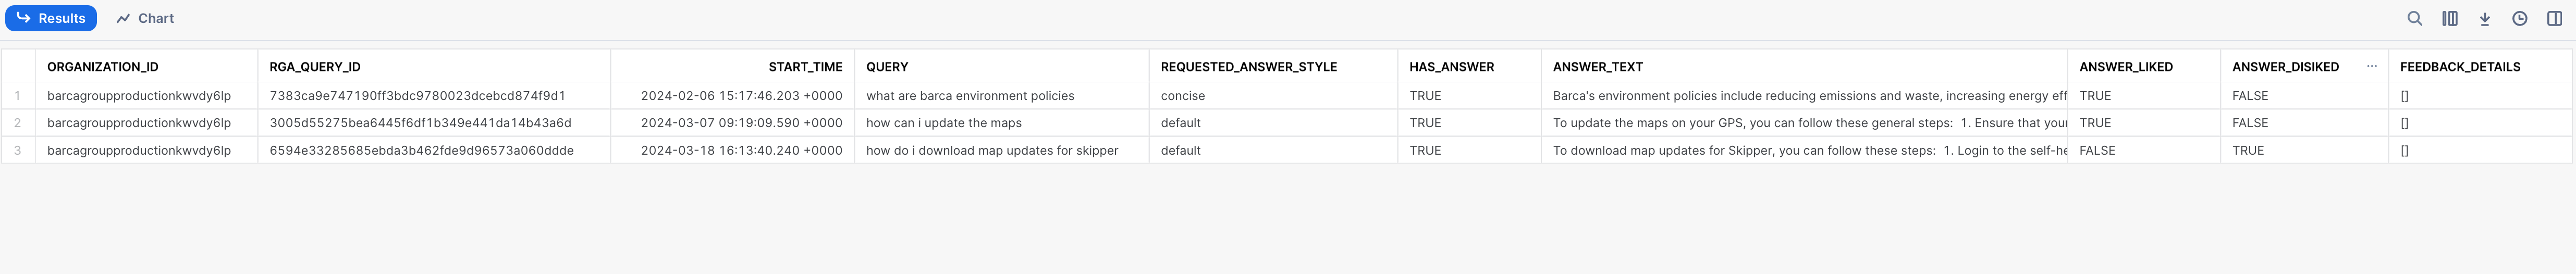
To view answers with feedback, run the following SQL query:
with feedback_per_search_id as (
    SELECT
        "account_id" as organization_id,
        "last_search_id" as search_id,
        COUNT_IF("event_value" = 'likeGeneratedAnswer') > 0 as answer_liked,
COUNT_IF("event_value" = 'dislikeGeneratedAnswer') > 0 as answer_disliked,
        ARRAY_AGG(
            IFF(
                "event_value" = 'generatedAnswerFeedbackSubmitV2',
                "custom_datas",
                NULL
            )
        ) as feedback_details
    FROM COVEO."ua"."custom_events_shared"
    WHERE "event_type" = 'generatedAnswer'
    GROUP BY organization_id, search_id
)

SELECT
    rga_queries.organization_id,
    rga_queries.rga_query_id,
    rga_queries.start_time,
    rga_queries.query,
    rga_queries.requested_answer_style,
    rga_queries.has_answer,
    rga_queries.answer_text,
    COALESCE(feedback.answer_liked, FALSE) as answer_liked,
    COALESCE(feedback.answer_disliked, FALSE) as answer_disliked,
    COALESCE(feedback_details, []) as feedback_details
FROM COVEO_SERVICE.QUESTION_ANSWERING_V001.RGA_QUERIES as rga_queries
JOIN COVEO."ua"."searches_shared" as searches
    ON rga_queries.organization_id = searches."account_id"
    AND rga_queries.insight_xid = searches."search_id"
LEFT JOIN feedback_per_search_id as feedback
    ON rga_queries.organization_id = feedback.organization_id
    AND rga_queries.insight_xid = feedback.search_id
WHERE to_date(rga_queries.start_time) BETWEEN '<YYYY-MM-DD>' AND '<YYYY-MM-DD>'
AND has_answer
AND searches."origin_level_1" = '<YOUR SEARCH HUB>'
AND (ARRAY_SIZE(feedback_details) > 0 OR answer_liked OR answer_disliked);
Where you replace:
-
<YOUR SEARCH HUB>with the name of your search hub. -
occurrences of
<YYYY-MM-DD>with the date range you want to analyze.
After running the query, here’s an example of what the SQL results table in the Snowflake console should look like:
Answer variations query
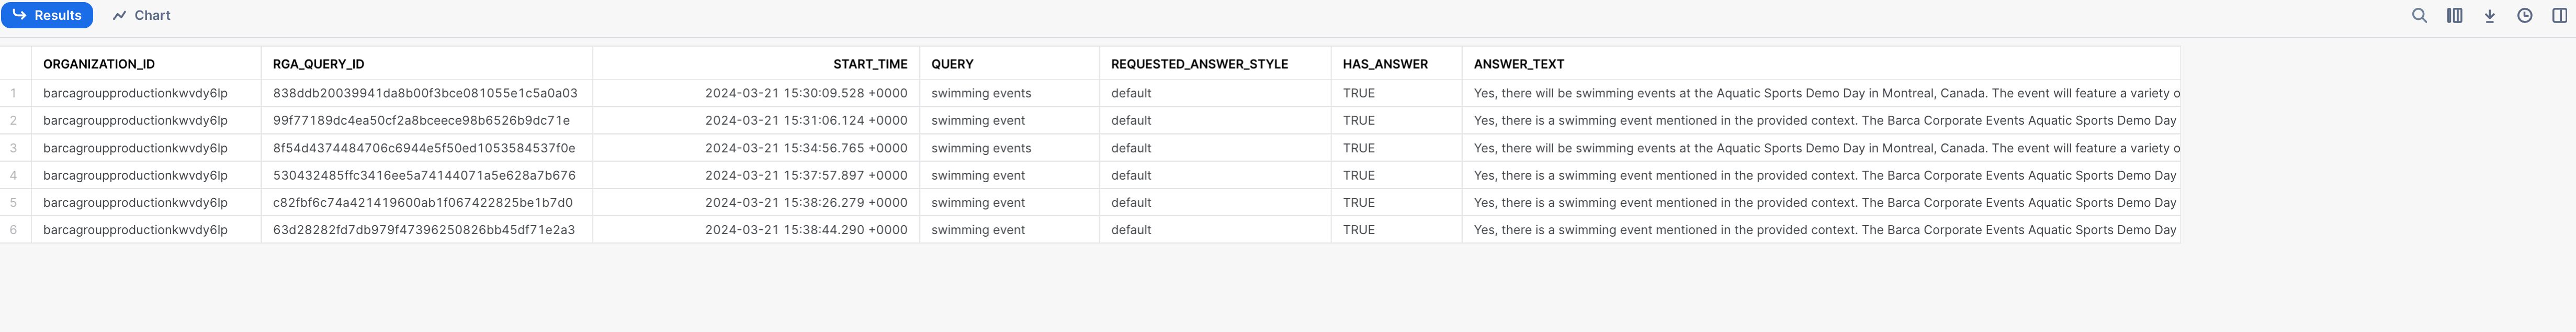
To view all answer variations for a query over time, run the following SQL query:
SELECT
    rga_queries.organization_id,
    rga_queries.rga_query_id,
    rga_queries.start_time,
    rga_queries.query,
    rga_queries.requested_answer_style,
    rga_queries.has_answer,
    rga_queries.answer_text
FROM COVEO_SERVICE.QUESTION_ANSWERING_V001.RGA_QUERIES as rga_queries
JOIN COVEO."ua"."searches_shared" as searches
    ON rga_queries.organization_id = searches."account_id"
    AND rga_queries.insight_xid = searches."search_id"
WHERE to_date(rga_queries.start_time) BETWEEN '<YYYY-MM-DD>' AND '<YYYY-MM-DD>'
AND has_answer
AND searches."origin_level_1" = '<YOUR SEARCH HUB>'
AND rga_queries.answer_text LIKE trim(lower('% <YOUR QUERY> %'));
Where you replace:
-
<YOUR SEARCH HUB>with the name of your search hub. -
occurrences of
<YYYY-MM-DD>with the date range you want to analyze. -
<YOUR QUERY>with the query you want to analyze.
After running the query, here’s an example of what the SQL results table in the Snowflake console should look like:
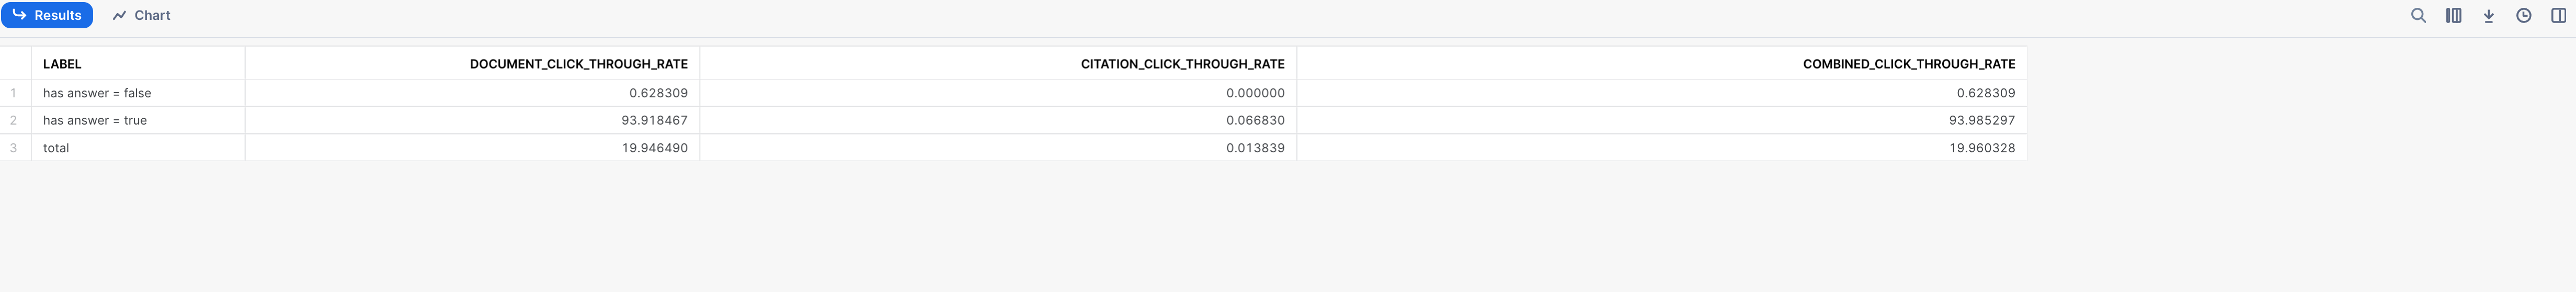
Search performance (CTR) query
To analyze the impact of generated answers on click-through rates (CTR), run the following SQL query:
|
|
Note
This computes the document CTR for searches and the citation CTR with and without answers. |
with searches_with_document_clicks as (
    SELECT DISTINCT
        "account_id" as organization_id,
        "search_id" as search_id
    FROM COVEO."ua"."clicks_shared"
    WHERE "cause2" <> 'generatedAnswerCitationClick'
),
searches_with_answer_clicks as (
    SELECT DISTINCT
        "account_id" as organization_id,
        "last_search_id" as search_id
    FROM COVEO."ua"."all_events_shared"
    WHERE "event_type" IN ('generatedAnswer', 'Click')
    AND ("event_value" IN ('openGeneratedAnswerSource', 'likeGeneratedAnswer', 'generatedAnswerCopyToClipboard') OR "cause2" = 'generatedAnswerCitationClick')
),
per_answer_click as (
    SELECT
        rga_queries.has_answer,
        rga_queries.start_time,
        searches."origin_level_1",
        EXISTS (
            SELECT 1
            FROM searches_with_document_clicks
            WHERE searches_with_document_clicks.organization_id = rga_queries.organization_id
            AND searches_with_document_clicks.search_id = rga_queries.insight_xid
        ) as has_document_click,
        EXISTS (
            SELECT 1
            FROM searches_with_answer_clicks
            WHERE searches_with_answer_clicks.organization_id = rga_queries.organization_id
            AND searches_with_answer_clicks.search_id = rga_queries.insight_xid
        ) as has_citation_click
    FROM COVEO_SERVICE.QUESTION_ANSWERING_V001.RGA_QUERIES as rga_queries
    JOIN COVEO."ua"."searches_shared" as searches
        ON rga_queries.organization_id = searches."account_id"
        AND rga_queries.insight_xid = searches."search_id"
    WHERE to_date(rga_queries.start_time) BETWEEN '<YYYY-MM-DD>' AND '<YYYY-MM-DD>'
    AND searches."origin_level_1" = '<YOUR SEARCH HUB>'
)
, per_has_answer_click_through_rate as (
    SELECT
        has_answer,
        COUNT(*) as total_search_count,
        COUNT_IF(has_document_click) as document_click_through_count,
        COUNT_IF(has_citation_click) as citation_click_through_count,
        COUNT_IF(has_document_click OR has_citation_click) as click_through_count
    FROM per_answer_click
    GROUP BY has_answer
)

SELECT
    IFF(has_answer, 'has answer = true', 'has answer = false') as label,
    100 * document_click_through_count / total_search_count as document_click_through_rate,
    100 * citation_click_through_count / total_search_count as citation_click_through_rate,
    100 * click_through_count / total_search_count as combined_click_through_rate
FROM per_has_answer_click_through_rate
UNION
SELECT
    'total' as label,
    100 * SUM(document_click_through_count) / SUM(total_search_count) as document_click_through_rate,
    100 * SUM(citation_click_through_count) / SUM(total_search_count) as citation_click_through_rate,
    100 * SUM(click_through_count) / SUM(total_search_count) as total_click_through_rate
FROM per_has_answer_click_through_rate;
Where you replace:
-
<YOUR SEARCH HUB>with the name of your search hub. -
occurrences of
<YYYY-MM-DD>with the date range you want to analyze.
After running the query, here’s an example of what the SQL results table in the Snowflake console should look like:
QUESTION_ANSWERING schema reference
The QUESTION_ANSWERING schema contains two distinct views: RGA_QUERIES and RGA_ANSWER_CITATIONS.
RGA_QUERIES
The following table describes the columns in the RGA_QUERIES view:
| Column name | Description | Data type (character maximum) | ||
|---|---|---|---|---|
|
The generated answer text. |
|
||
|
Whether the query has an answer. |
|
||
|
The unique identifier of the search that led to the generated answer.
|
|
||
|
The unique identifier of the organization. |
|
||
|
The query text. |
|
||
|
The requested answer style. |
|
||
|
The unique identifier of the RGA query. |
|
||
|
The start time of the query. |
|
RGA_ANSWER_CITATIONS
The following table describes the columns in the RGA_ANSWER_CITATIONS view:
| Column name | Description | Data type (character maximum) |
|---|---|---|
|
The unique identifier of the organization. |
|
|
The unique identifier of the RGA query. |
|
|
The permanent ID of the item that was used in the citation. |
|
|
The title of the item that was used in the citation. |
|
|
The chunk of text from the item that was used in the citation. |
|