Review user visits with the Visit Browser
Review user visits with the Visit Browser
You can use the Visit Browser (platform-ca | platform-eu | platform-au) page to review user visits for your Coveo search solution. A user visit is also known as a user session, and represents the period in which a user remains active on a site.
You can also use this page for various purposes, including validating an implementation from a quality assurance perspective, or making sure that search, click, and custom events are logged properly. It also provides a way to select visits that meet certain criteria (for example, visits in which a case deflection occurred), and review the events, in order of occurrence, for each visit.
By default, the Visit Browser page shows 50 visits per page and 250 events per visit. However, all events that occurred in the visits are available when you export the visit data (see Data exports).
|
|
Notes
|
Review search usage data by date interval
On the Visit Browser (platform-ca | platform-eu | platform-au) page, you can switch from the current selected date interval (last week, month…) to the previous period or next period by clicking
![]() and
and
![]() respectively in the upper-right corner.
respectively in the upper-right corner.
|
|
Notes
|
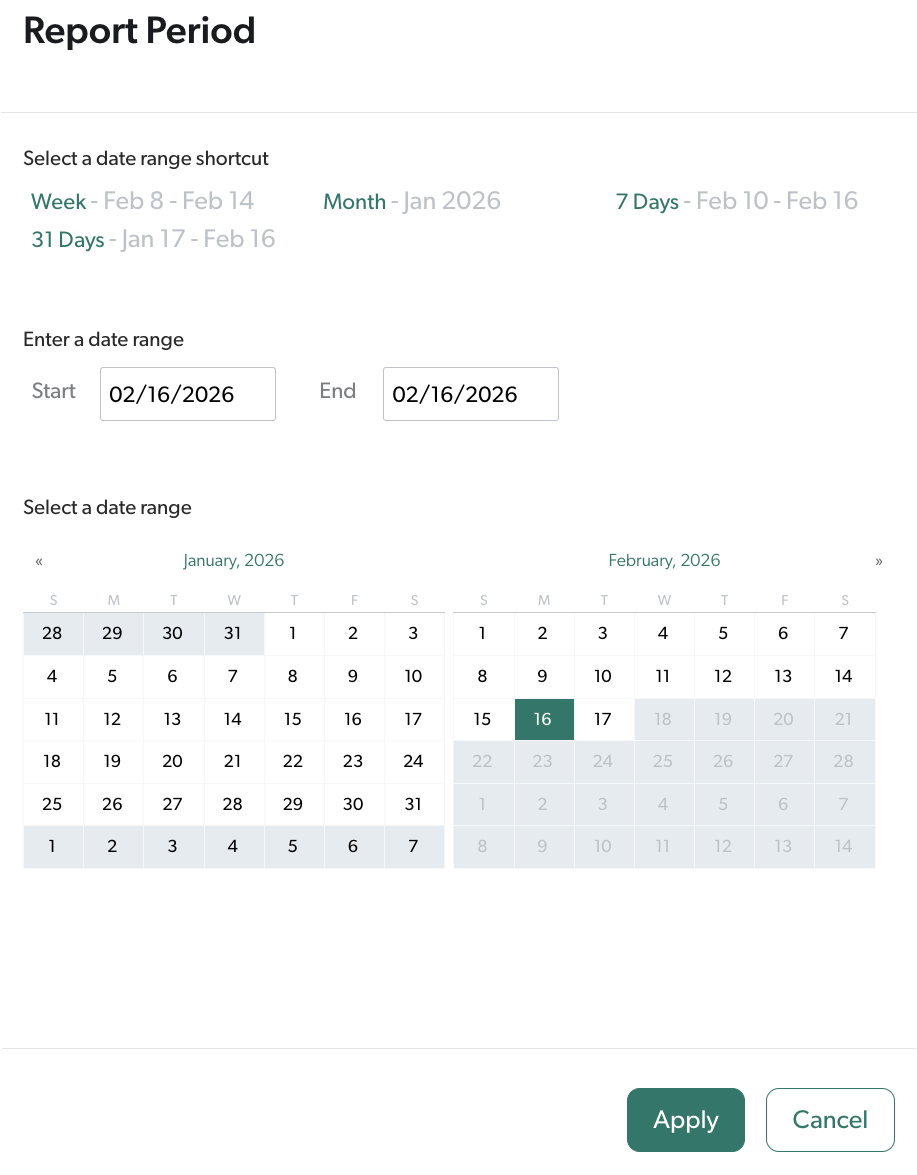
Alternatively, you can click the box containing the actual date range to access the Report Period dialog, and then select the date range you want to review.
Add visit filters
There are several ways to filter out irrelevant visits and to keep only those you want to review. You can add inclusion and exclusion filters, or a combination of both. When you only add exclusion filters, all visits are shown, except those containing an event that meets your criteria.
|
|
Note
permission filters act as inclusion filters if at least one event during a user visit matches the filter. Therefore, it’s not recommended to use permission filters to filter out user visits. For example, the permission filter |
Add inclusion filters
-
On the Visit Browser (platform-ca | platform-eu | platform-au) page, when you want to add an inclusion filter, click an event under Show visits containing, and then select one of four event categories (an event, a search event, a click event, or a custom event).
-
Click
 to access the dialog to add global dimension filters, and then select the criteria you want.
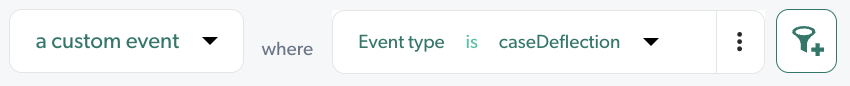
Once created, the filter appears in the top bar under Show visits containing and only the user visits meeting your criteria appear.
|
|
Note
Under Show visits containing, when you add a filter with a negative operator (for example, is not or doesn’t contain), the filter acts as an exclusion filter rather than an inclusion filter. For example, you want to review visits that contains events of users that aren’t from New York with the following filter: |
Add exclusion filters
-
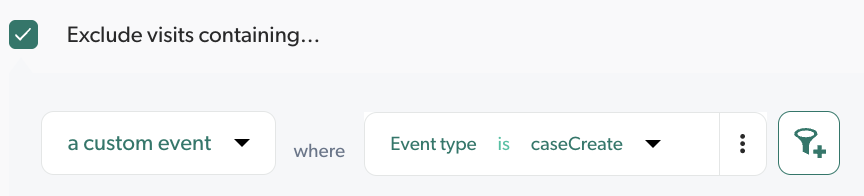
On the Visit Browser (platform-ca | platform-eu | platform-au) page, select the Exclude visits containing checkbox.
-
Click an event, and then select between four event categories (an event, a search event, a click event, or a custom event).
-
Click
to access the dialog to add global dimension filters, and then select the criteria you want.Examples-
To analyze user sessions containing a specific user query that doesn’t contain a support case, select the checkbox to add the following filter:
-
To determine the site visit activities of a user who never uses the search bar, you’ll need to exclude all visits containing a user query.
Once created, the filter appears in the top bar under Exclude visits containing and only the user visits meeting your criteria appear.
-
Add multiple filters
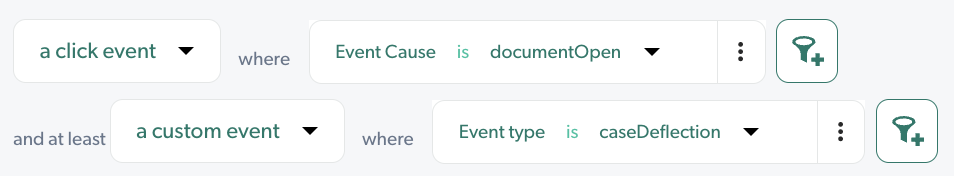
You can add filters to apply on multiple event categories by clicking And at least and following the same steps as adding inclusion or exclusion filters. Once created, the visits that appear will then match the multiple parameters.
You want to browse user visits in which an item was opened and a case deflection occurred.
|
|
Note
When adding multiple filters to a single event category, the |
Hide events
-
When you want to discard events from remaining visits, select the Hide events checkbox, and then click
to add global dimension filters.ExampleYou want to focus solely on search events returning results to see, over a visit, whether users are clicking results. Therefore, you remove search events without results by adding the following filter:
Has Results is False. -
You can add alternative filters by clicking Or where. Events matching one of these filters will be hidden.
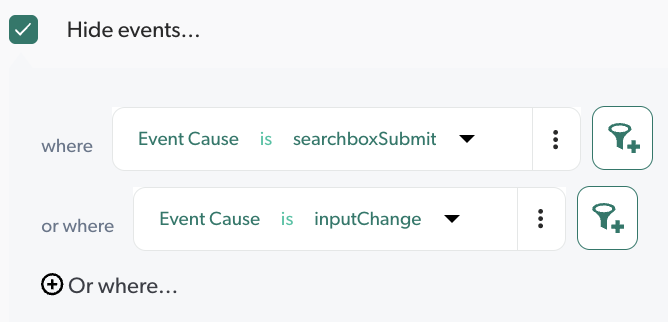
Once created, the filters appears under Hide Events, and the events meeting your criteria are excluded.
|
|
Note
If a visit only has one event and this event is filtered out, the visit will be hidden as well. |
Leading practices
Consider the following leading practices when inspecting visits using the Visit Browser.
Use a short time interval and leverage filters
When you open the Visit Browser, notice it filters the data based on the last day of data. This provides you with a sample of fresh visits to start with.
Before you increase the time interval, narrow down the visits to what you’re looking for by using filters. Once the number of visits are reduced to single digits, start extending the time interval gradually, until you get the required number of visits. Ideally, you should extend it up to a week, as the more you extend the time interval, the longer it takes to get results in the Visit Browser.
If you’re interested in getting more visits, use the calendar arrows to move to the previous or next period. This will provide you with a set of completely different visits.
Bookmark your webpage
Once you’re done establishing filters, you can bookmark the web page, or copy and paste the URL in the place of your choice to be able to later access the same state of the Visit Browser page.
Using named filters
You can add a named filter with the current filters on a line:
-
At the right-end of the bar, click
 , and then select Save filter as or Save filters as.
 -
In the Save as a Named Filter dialog, in the first input, enter a meaningful Filter name, and then click Save.
-
The named filter is now applied to the user visits. For more information, see Manage named filters.
Remove all filters
You can remove all the filters on a line, at the right end of the row, by clicking ![]() , and then selecting Remove filter or Remove all filters.
, and then selecting Remove filter or Remove all filters.
|
|
Note
The Visit Browser is a tool provided to explore the visits and events, without requiring any programming or scripting, hence it comes with its limits. If you have knowledge of programming or scripting languages, it’s possible to explore the same raw events with Snowflake (see Manage raw data). The Build visit cards article explains SQL query patterns used by the Visit Browser to generate the same results. This could be used as starting point, from which you can fully customize your own personal tool. |
Browse user visits
-
On the Visit Browser (platform-ca | platform-eu | platform-au) page, after setting the date interval and adding filters, click a visit row to view all events that occurred in this particular visit.
-
Click an event row to view available information on this event, such as dimension values and the response time (see Dimensions and Reference).
|
|
Notes
|
Export visit data that meet your criteria
-
On the Visit Browser (platform-ca | platform-eu | platform-au) page, click
 in the upper-right corner.
 Note
NoteIf the Export visit data using current filters icon is grayed and unresponsive, you don’t have the required privileges to perform this action.
-
In the Export Estimate dialog that appears and shows the number of events to be contained in the export, click Add data export.
The export is created and available for download on the Data Exports tab of the Raw Data (platform-ca | platform-eu | platform-au) page.
NoteWhen the export contains more than 3 millions events, the events are sorted randomly rather than by date and time.
-
In the navigation bar on the left, under Analytics, select Raw Data, and then select the Data Exports tab.
-
On the Data Exports (platform-ca | platform-eu | platform-au) page, click the newly created export, and then click Download in the Action bar to retrieve the ZIP file.
-
|
|
Note
After the visit data has been exported, the order of the columns may be rearranged in a spreadsheet in which the corresponding CSV file has been imported. |
Review a visit with more than 250 events
To review a single visit containing more than 250 events, you must export the visit data as follows:
-
On the Visit Browser (platform-ca | platform-eu | platform-au) page, click a visit containing more than 250 events.
-
Under the 250th event, click Create.
-
In the Export Estimate dialog that appears, check the Use dimension display name box if you want the export to show the dimension names as they appear in Coveo Analytics reports (for example, "Origin 1 (Page/Hub)").
NoteBy default, exports show the dimension API names, for example,
originLevel1. -
In the navigation bar on the left, under Analytics, select Raw Data, and then select the Data Exports tab.
-
Click the newly created export, and then click Download in the Action bar to retrieve the ZIP file. The export contains all missing events.
Reference
The body of the Visit Browser (platform-ca | platform-eu | platform-au) page is essentially a table listing all the visits that match specific criteria.
|
|
Note
When no values are returned for a given field, |
Start date column
Indicates the date and the hour when the user performed their first event on the search interface.
Visit duration column
Indicates the time between the first and last event performed by a user during a visit (based on the event visit ID).
|
|
Notes
|
User name column
Indicates the user’s display name, if they were authenticated to the search interface when they performed the event.
Location column
Indicates, when available, the country, province/state, and city from which the user performed the event, based on their IP address.
|
|
Note
The location of the user can be |
Browser column
Indicates, when available, the web browser name and version with which the user performed the event. This information is extracted from the HTTP user agent identification.
|
|
Note
The browser of the user can be |
Event count column
Indicates the number of events that occurred in the visit.
Visit row
When expanding a visit row, the All Visit Events table columns indicate general information about each performed event:
Order
Indicates the rank of the event.
Time
Indicates the time at which the event was performed
|
|
Note
In the Visit Browser, events are displayed in your time zone. |
User name
Indicates when the user is authenticated to the search interface, the display name of the user that performed the event
Type
Indicates the type of the event, which can be Click, Search, or the name identifying the custom event or its category
|
|
Note
(For custom events only) You can use the Type values when filtering on the Event Type dimension. |
Cause
Indicates (for click and search events only) the name of the search or click event cause and Search Cause.
Details
-
For search events, the details indicate the query text entered by the user in the search box (if any), or the selected facet value and the underlying advanced query expression.
-
For click events, the details indicate the title and URL of the item on which the user performed the click.
-
For custom events, the details indicate the name of the custom event cause.
|
|
Note
You can use the Details values when filtering on the Event Value dimension. |
Event row
When expanding an event row, you can see all the dimensions and their values passed along with the performed event indicating the context of the recorded event.
Required privileges
The following table indicates the required privileges to view and to edit elements of the Visit Browser (platform-ca | platform-eu | platform-au) page.
| Action | Service | Domain | Required access level |
|---|---|---|---|
View user visits |
Analytics |
Analytics data |
View |
Dimensions |
View |
||
Named filters |
View |
||
Permission filters |
View |
||
Organization |
Organization |
View |
|
Export visit data |
Analytics |
Analytics data |
View |
Data exports |
Edit |
||
Dimensions |
View |
||
Named filters |
View |
||
Permission filters |
View |
||
Organization |
Organization |
View |