Review data health
Review data health
The term data health refers to the quality of your organization data, reflecting its integrity and accuracy. The Data Health (platform-ca | platform-eu | platform-au) page in the Coveo Administration Console provides valuable insights on your data health, which is impacted by the performance of each event type. Errors in those event types are detected are based on data validation criteria applied to specific requirements. You can use this page to identify inconsistencies by inspecting how each event impacts your overall data health.
What is data health?
Data health represents the reliability of your Coveo Analytics data, which plays a crucial role in the effectiveness of your search solution. Not only does it let you measure and monitor search activities within your Coveo-powered search interfaces, but it also feeds Coveo Machine Learning features which can continuously improve the user experience.
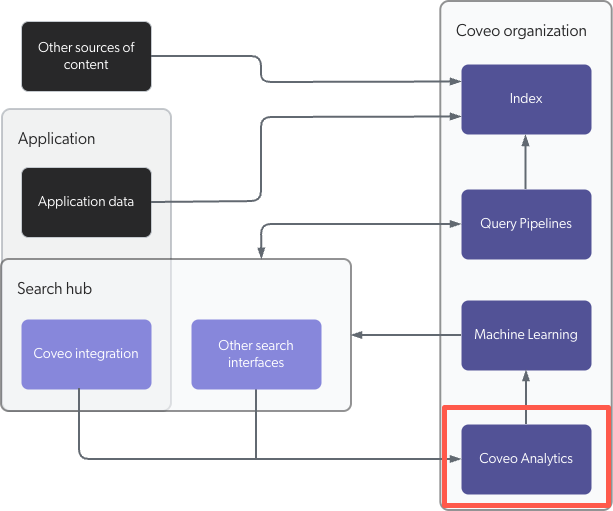
Any issues in data integrity can therefore hinder the efficiency and relevance of your Coveo solutions. Ensuring that your organization data is healthy ensures that your solutions remain tailored to your needs.
|
|
Leading practices
|
Maintaining Coveo Analytics data accuracy and precision isn’t a one-time task, but rather, an ongoing effort which is paramount in ensuring that your Coveo solutions continue to work seamlessly. The Data Health page was created specifically for this purpose. It offers you a clear view of everything that’s working correctly, and also aspects of your data that may need some further investigation and fine-tuning.
The Data Health (platform-ca | platform-eu | platform-au) page includes three tabs:
-
the Overview
-
the Event errors
-
the Event browser
Required privileges
The following table indicates the required privileges to view the Data Health (platform-ca | platform-eu | platform-au) page.
| Action | Service | Domain | Required access level |
|---|---|---|---|
View data health |
Analytics |
Analytics data |
View |
Data health |
View |
||
Dimensions |
View |
||
Organization |
Organization |
View |