Event browser
Event browser
On the Event browser (platform-ca | platform-eu | platform-au) tab of the Data Health page, you can monitor your data performance and health by tracking the latest events sent to Coveo. This is especially useful when you want to focus on specific validation criteria affecting your data health.
The Event browser tab shows a list of the latest events, regardless of their status. It indicates which events passed the validation criteria and highlights those with missing or incorrectly formatted information.
|
|
Note
The Event browser doesn’t detect errors associated to whole sessions or inconsistencies between events. For example, it isn’t possible to see if a click event is associated to a search event that doesn’t exist. |
Event browser features
On the Data Health (platform-ca | platform-eu | platform-au) page, select the Event browser tab.
Click any event listed in the browser. You can then do the following:
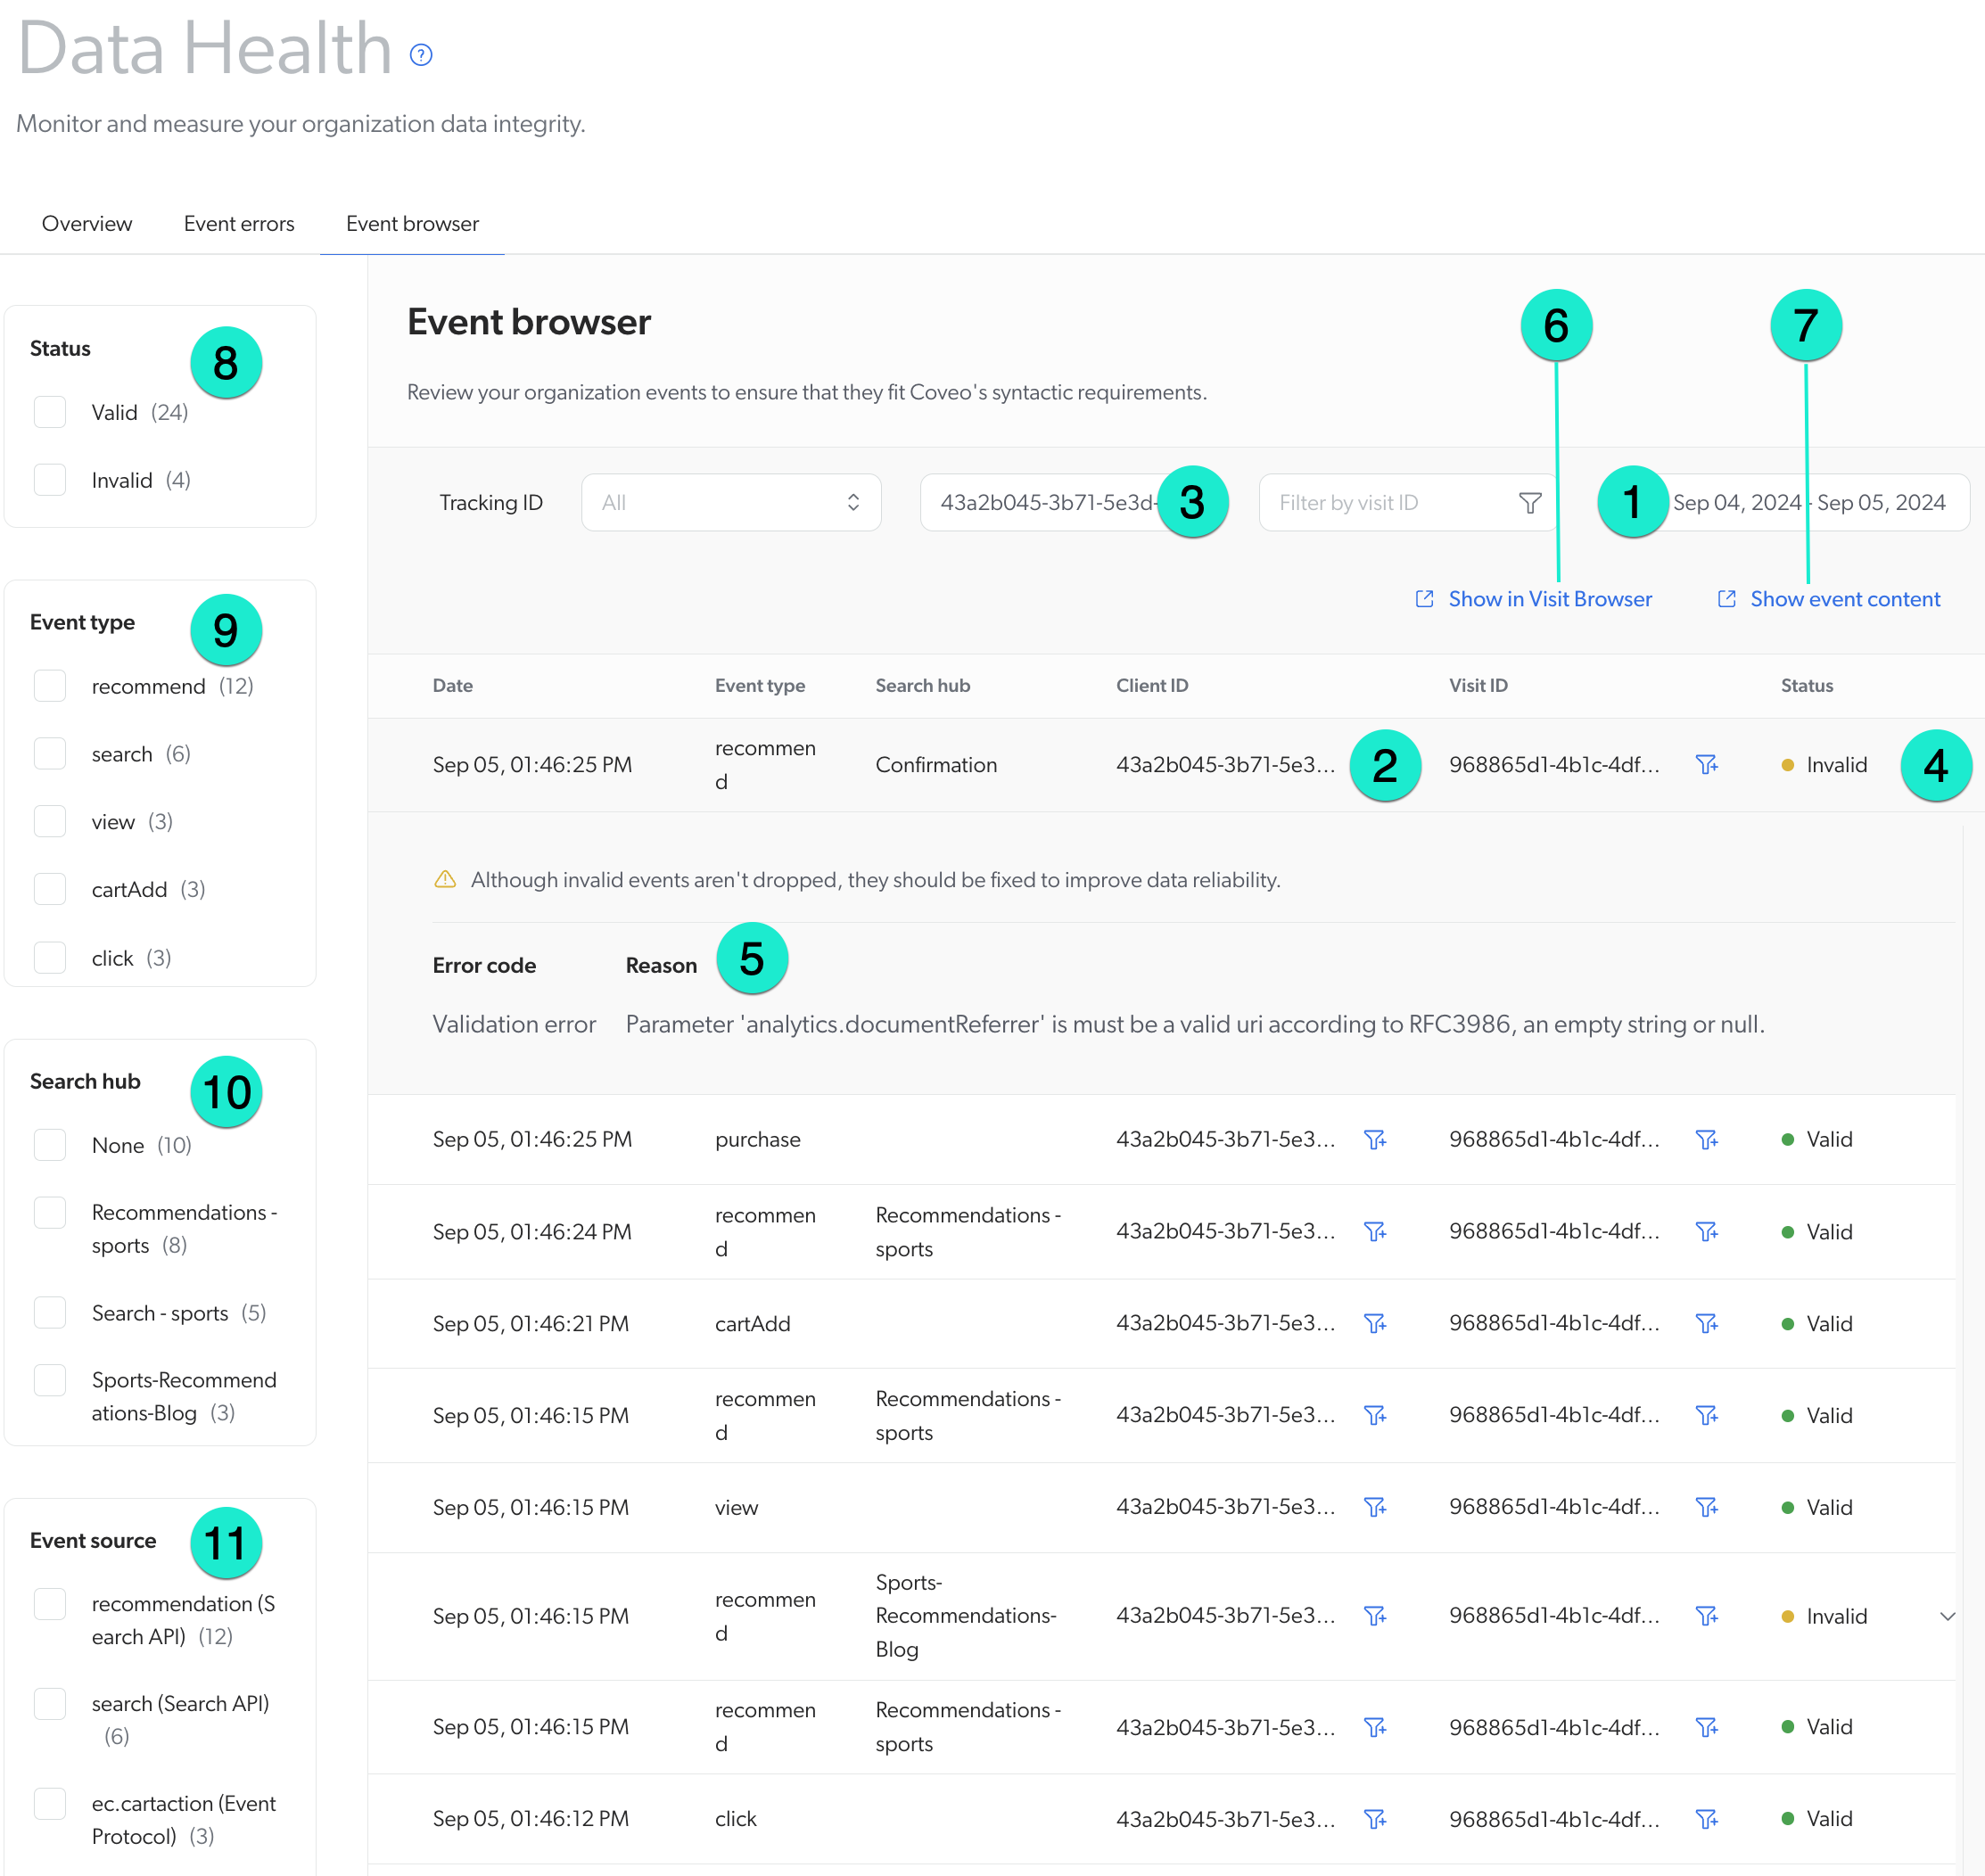
1 Use the date picker to narrow down the events by period.
2 Filter events by client ID or visit ID by clicking the filter icon next to the desired ID.
3 Remove an ID filter by clicking ![]() .
.
4 Expand an event that’s marked as Invalid for more details by clicking the arrow.
5 Assess the error code and reason for the invalid event.
6 Open the Visit Browser page containing that specific event by clicking Show in Visit Browser.
7 View the complete event content on a new dialog by clicking Show event content.
8 Filter events by status.
9 Filter events by type.
|
|
Note
This section includes different event types depending on the use case, such as detail, cardAdd, transaction, search, custom, and more. There are overlaps between event types, since one event type can originate from different event sources, except for the Collect event source, which contains specific event types such as detail, cardAdd, transaction, and pageview. |
10 Select a search hub to view event types from a specific search hub.
11 Select an event source to filter events by source. The source of the event indicates where the event originates (for example, Event Protocol) and helps refine the form the event type takes.