FAQ
FAQ
- How is the Relevance Index calculated?
- What’s a user visit?
- Why are date and time values different in reports and exports?
- What’s the database schema of the different tables that I see when doing an export?
- Why can’t I see some search metrics in my reports?
- Why do I get the
No search statistics/No matching resultserror messages in my report - What’s the
n/a keywordvalue in reports? - What’s the maximum number of custom dimensions that can be used?
- Why are there search event count discrepancies?
- Why are there visit count discrepancies between the Visit Browser and my reports?
This article contains a list of frequently asked questions about Coveo Analytics. If you’re not sure where to begin, see the Get started article.
How is the Relevance Index calculated?
The exact formula for calculating relevance is complex.
In short, several metrics are combined, such as the Search Event Clickthrough ratio, the Average Click Rank (ACR), and the frequency at which an item is queried or a query is submitted.
See Relevance Index Metric for more details.
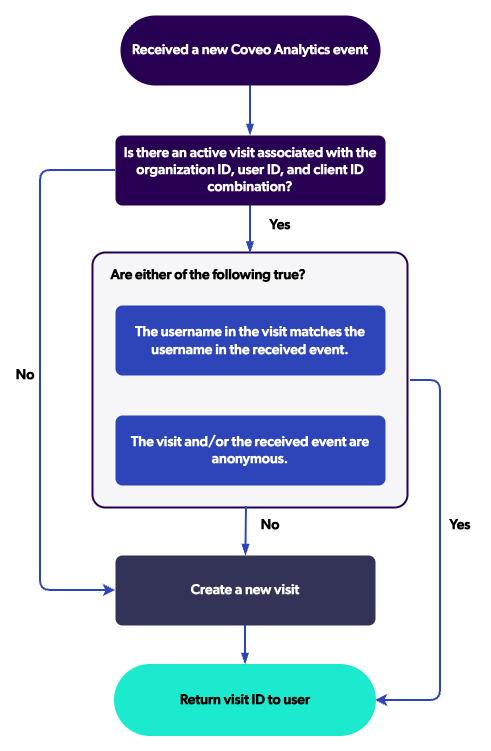
What’s a user visit?
A user visit is the period in which a user is active on a site. Also known as a session, a visit begins when a user with a unique combination of client ID and/or visit ID, organization ID, and user ID accesses a search interface. The visit ends after 30 minutes of inactivity. If the user leaves the site and returns before 30 minutes, the visit remains active.
|
|
Notes
|
The following diagram indicates how Coveo Analytics keeps track of user visits:
Why are date and time values different in reports and exports?
The data displayed in reports or the Visit Browser (platform-ca | platform-eu | platform-au) uses the browser’s time zone. In Coveo Analytics reports, the date and time values that appear on the horizontal axis of graph cards and the values of dimensions such as Day and Hour are automatically converted to the time zone of the user’s browser. Therefore, when your analysts manage data specifically from their time zone, they can review the same reports with filters adapted to their city or country.
However, in data exports performed through the Data Exports (platform-ca | platform-eu | platform-au) and Visit Browser (platform-ca | platform-eu | platform-au) pages, and in the Data Explorer panel, time and date values are always returned in UTC (GMT) time zone.
Consequently:
-
Analysts can see the same data in exports when they review the same date range, regardless of their time zone.
-
Times and dates can be different in the exports and CSV files, but the values still represent the same instant in time.
What’s the database schema of the different tables that I see when doing an export?
This depends on how your implementation was set up to send analytics events to Coveo.
Each search event export can involve many clicks, groups, and keywords.
A user query can be followed by 0 to n clicks, a query can contain 0 to n keywords, and the user submitting a query can belong to 0 to n groups.
Therefore, the SearchId is the link between clicks and searches, between keywords and searches, and between groups and searches.
See Data export tables for details.
Why can’t I see some search metrics in my reports?
Search metrics are calculated from captured events such as searches, clicks, and visits. When certain metrics aren’t showing up in reports, it usually means that the underlying events weren’t captured or were excluded from reporting. Common reasons include:
-
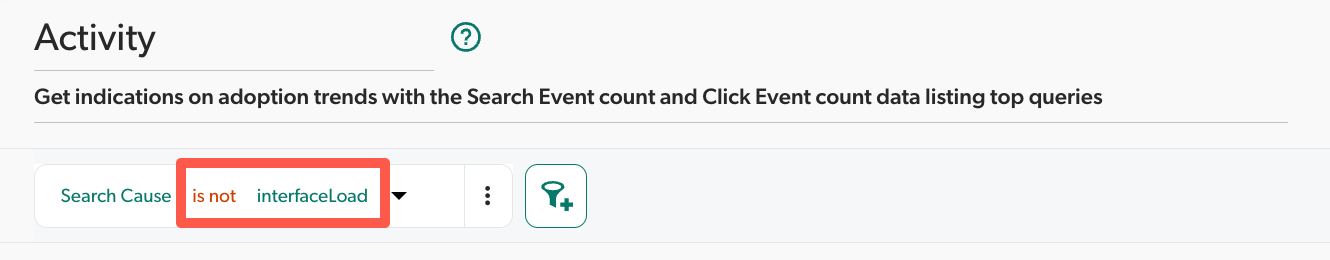
interfaceLoadevents are excluded from most reports. -
The events haven’t finished processing yet.
-
There are too many filters applied to the report, minimizing the dataset.
Why are interfaceLoad events excluded from most reports?
The main purpose of analytics reports is to analyze user activity, queries, and item relevance.
However, not all queries constitute real user activity as some queries aren’t triggered by users.
Some are automatically generated (interfaceLoad events) and are excluded in most reports.
In Coveo for Salesforce, similar cases (results from a Coveo search) can automatically be displayed in the case console when an agent opens a case. Since the user never explicitly interacted with the search system to get the results, these searches aren’t considered real activity.
How long does it take for a new event to be available in reports?
The search analytics service handles events asynchronously. Typically, your events will be available within 15 minutes.
Why do I get the No search statistics/No matching results error messages in my report
Both messages are shown in Coveo Analytics cards when data doesn’t match the query. The filters applied in your report may be too precise or may be filtering out all the data in the cards at issue. More often than not, adjusting the filter or removing dimensions that caused metric values to be diluted in a card resolves the issue.
The more precise the scope of a dimension is, when mixed with other dimensions, the more chances those error messages appear.
What’s the n/a keyword value in reports?
When analyzing dashboards and explorers, n/a keyword can appear as a Keyword dimension value.
-
The n/a keyword* is typically displayed in reports when a user accesses a Coveo-powered search interface with the
allowQueriesWithoutKeywordsoption set totrue. The n/a keyword is also displayed when an end user submits a blank query to your search interface.
Depending on your context, you may want to avoid users obtaining these result items when they first access your search interface (interfaceLoad events) (see Prevent Queries Without Keywords).
To keep these result items being displayed to your users, you can also exclude these queries from your reports.
|
|
If you already disabled empty queries in your search interface after it loads the first time and still have several n/a keyword occurrences in your reports, you may need to further investigate the situation as it might be the result of an implementation issue. |
What’s the maximum number of custom dimensions that can be used?
You can create up to 25 custom dimensions in a Coveo organization.
For Coveo for Salesforce, the number of allowed custom dimensions depends on the edition.
|
|
Note
Custom data can only be leveraged when using the UA Protocol. If your Coveo implementation uses the Event Protocol, custom dimensions and metrics shouldn’t be added to a report since they won’t function as expected. |
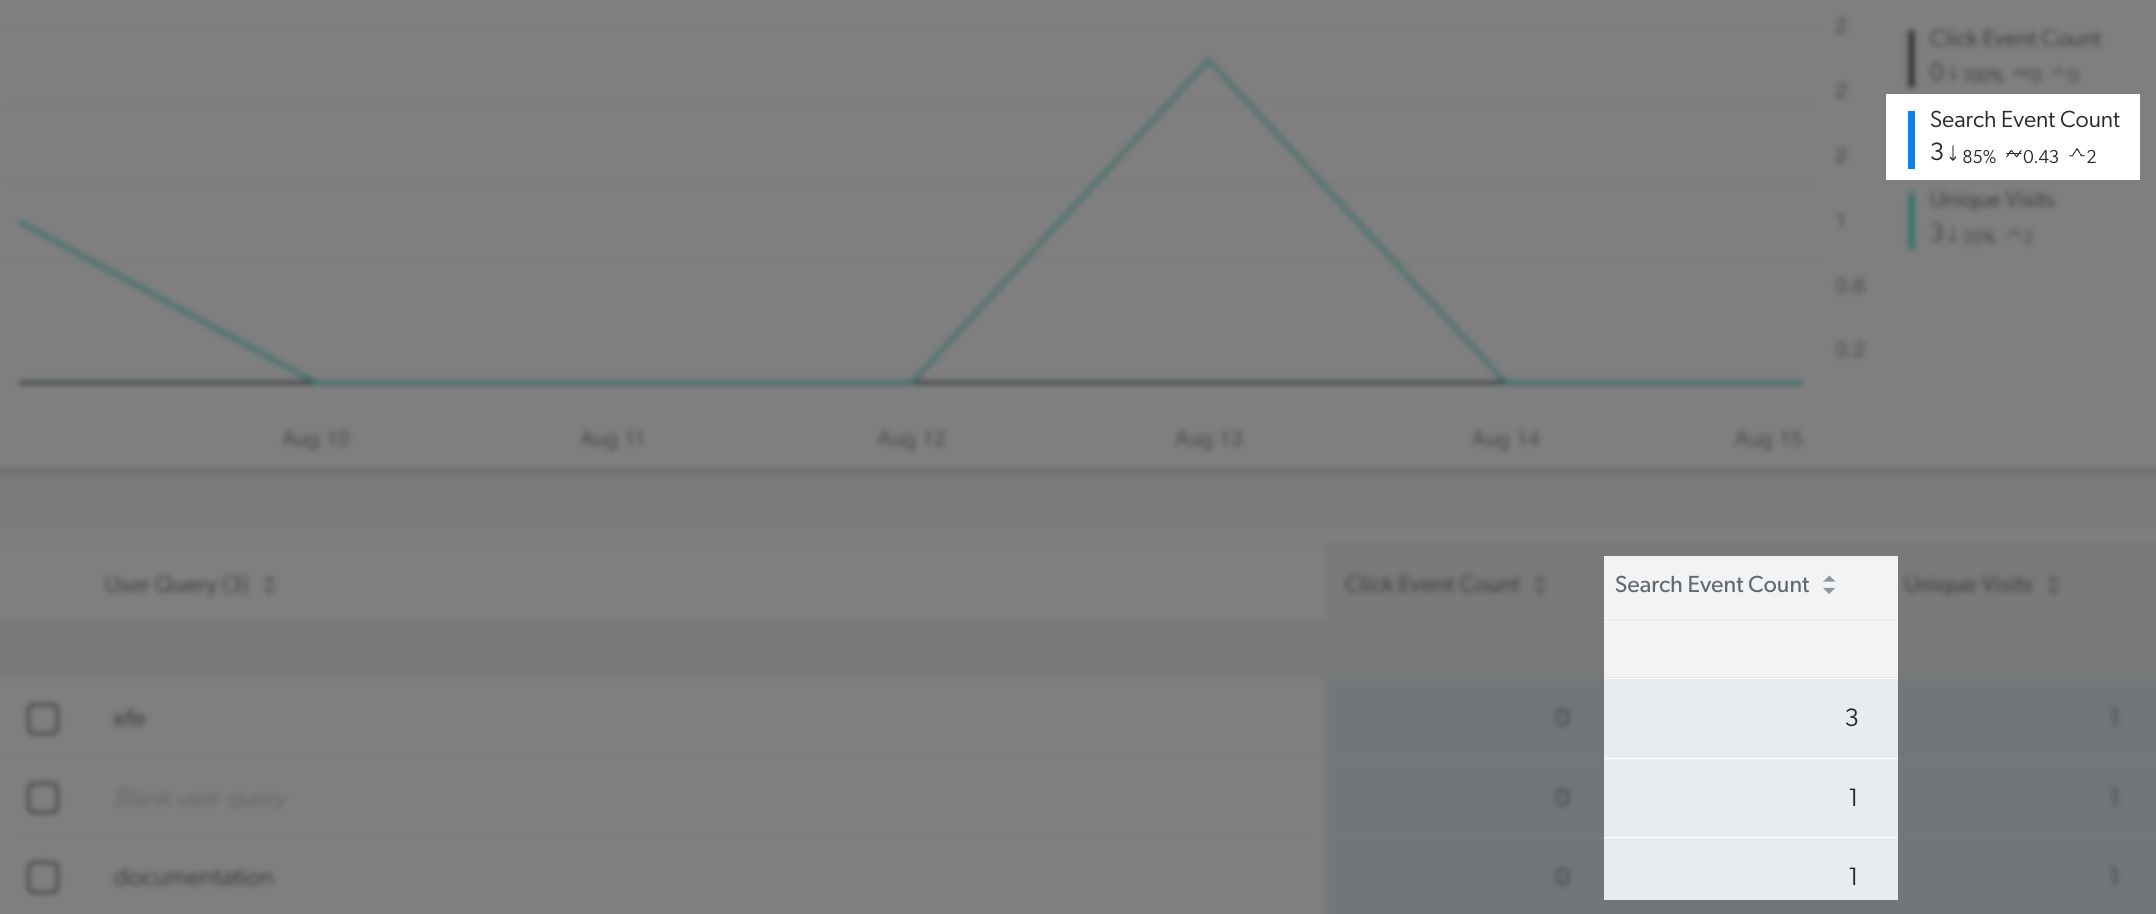
Why are there search event count discrepancies?
The discrepancies in search event counts may occur because of how search events and clicks are recorded. The sum of the search event counts in detailed tables may not match the global search event count because a single search event can result in multiple clicks. Each click is recorded separately, which can cause the sum of these events to exceed the actual number of search events initiated by users. This occurs because users might click several different results within the same query.
In the following screen capture, the search event count in the Metric time series card is three, but the sum of the search event count in the Table card is five.
Why are there visit count discrepancies between the Visit Browser and my reports?
The difference occurs when certain events (mainly clicks and searches) aren’t registered as belonging to the same visit ID. This can happen in the following situations:
-
User browser blocks cookies, and therefore the visit is lost between each action.
-
User leaves the browser open for more than 30 minutes, then resumes interactions with search results.
-
Sometimes, an implementation doesn’t properly set a visit tracking cookie.
In all three scenarios, the Visit ID is different for a search and a click even though the click and the search have the same Search ID.
General information
-
The Visit Browser (and Visit metric card) visit count only considers the Visit ID when linking events.
Therefore, the Visit Browser can be used for troubleshooting improperly tracked visits as well as allowing visit metric cards to use filters on the complete visit instead of individual events.
-
Coveo Analytics reports use the Search ID in addition to the Visit ID when linking events.
Most report cards (except for the Visit metric card) use the Search ID to minimize the impact of improperly tracked visits on the Has Clicks dimension and the Search Event Clickthrough (%) metrics. The Search ID is more reliable since the Search ID doesn’t rely on a tracking cookie, which can lead to different values when looking at the Visit Count.
-
Coveo JavaScript Search Framework has a visit tracking mechanism that reduces the occurrences of Search ID versus Visit ID discrepancies. Only the Visit ID is used to measure visit count since events from improperly tracked visits are rejected.