Troubleshoot search implementation issues
Troubleshoot search implementation issues
The first time you deploy a search solution or after you make major changes to it, you may encounter issues that are difficult to identify using traditional quality assurance techniques. To detect these issues, you can monitor the Coveo Analytics after the search solution is live to ensure people are finding what they’re looking for.
Here are some typical issues you can find using Coveo Analytics:
-
Non-indexed items
-
Non-indexed item fields containing relevant text
-
Queries that don’t return results
-
Search boxes which apply special filters that don’t work as expected
Coveo Analytics can help you ensure everything is working fine in a production environment.
To troubleshoot search implementation issues with Coveo Analytics, you can use one or more of the following methods:
-
In the Content Gaps explorer:
-
On the Reports (platform-ca | platform-eu | platform-au) page of the Coveo Administration Console, click the Content Gaps explorer, and then click Open in the Action bar.
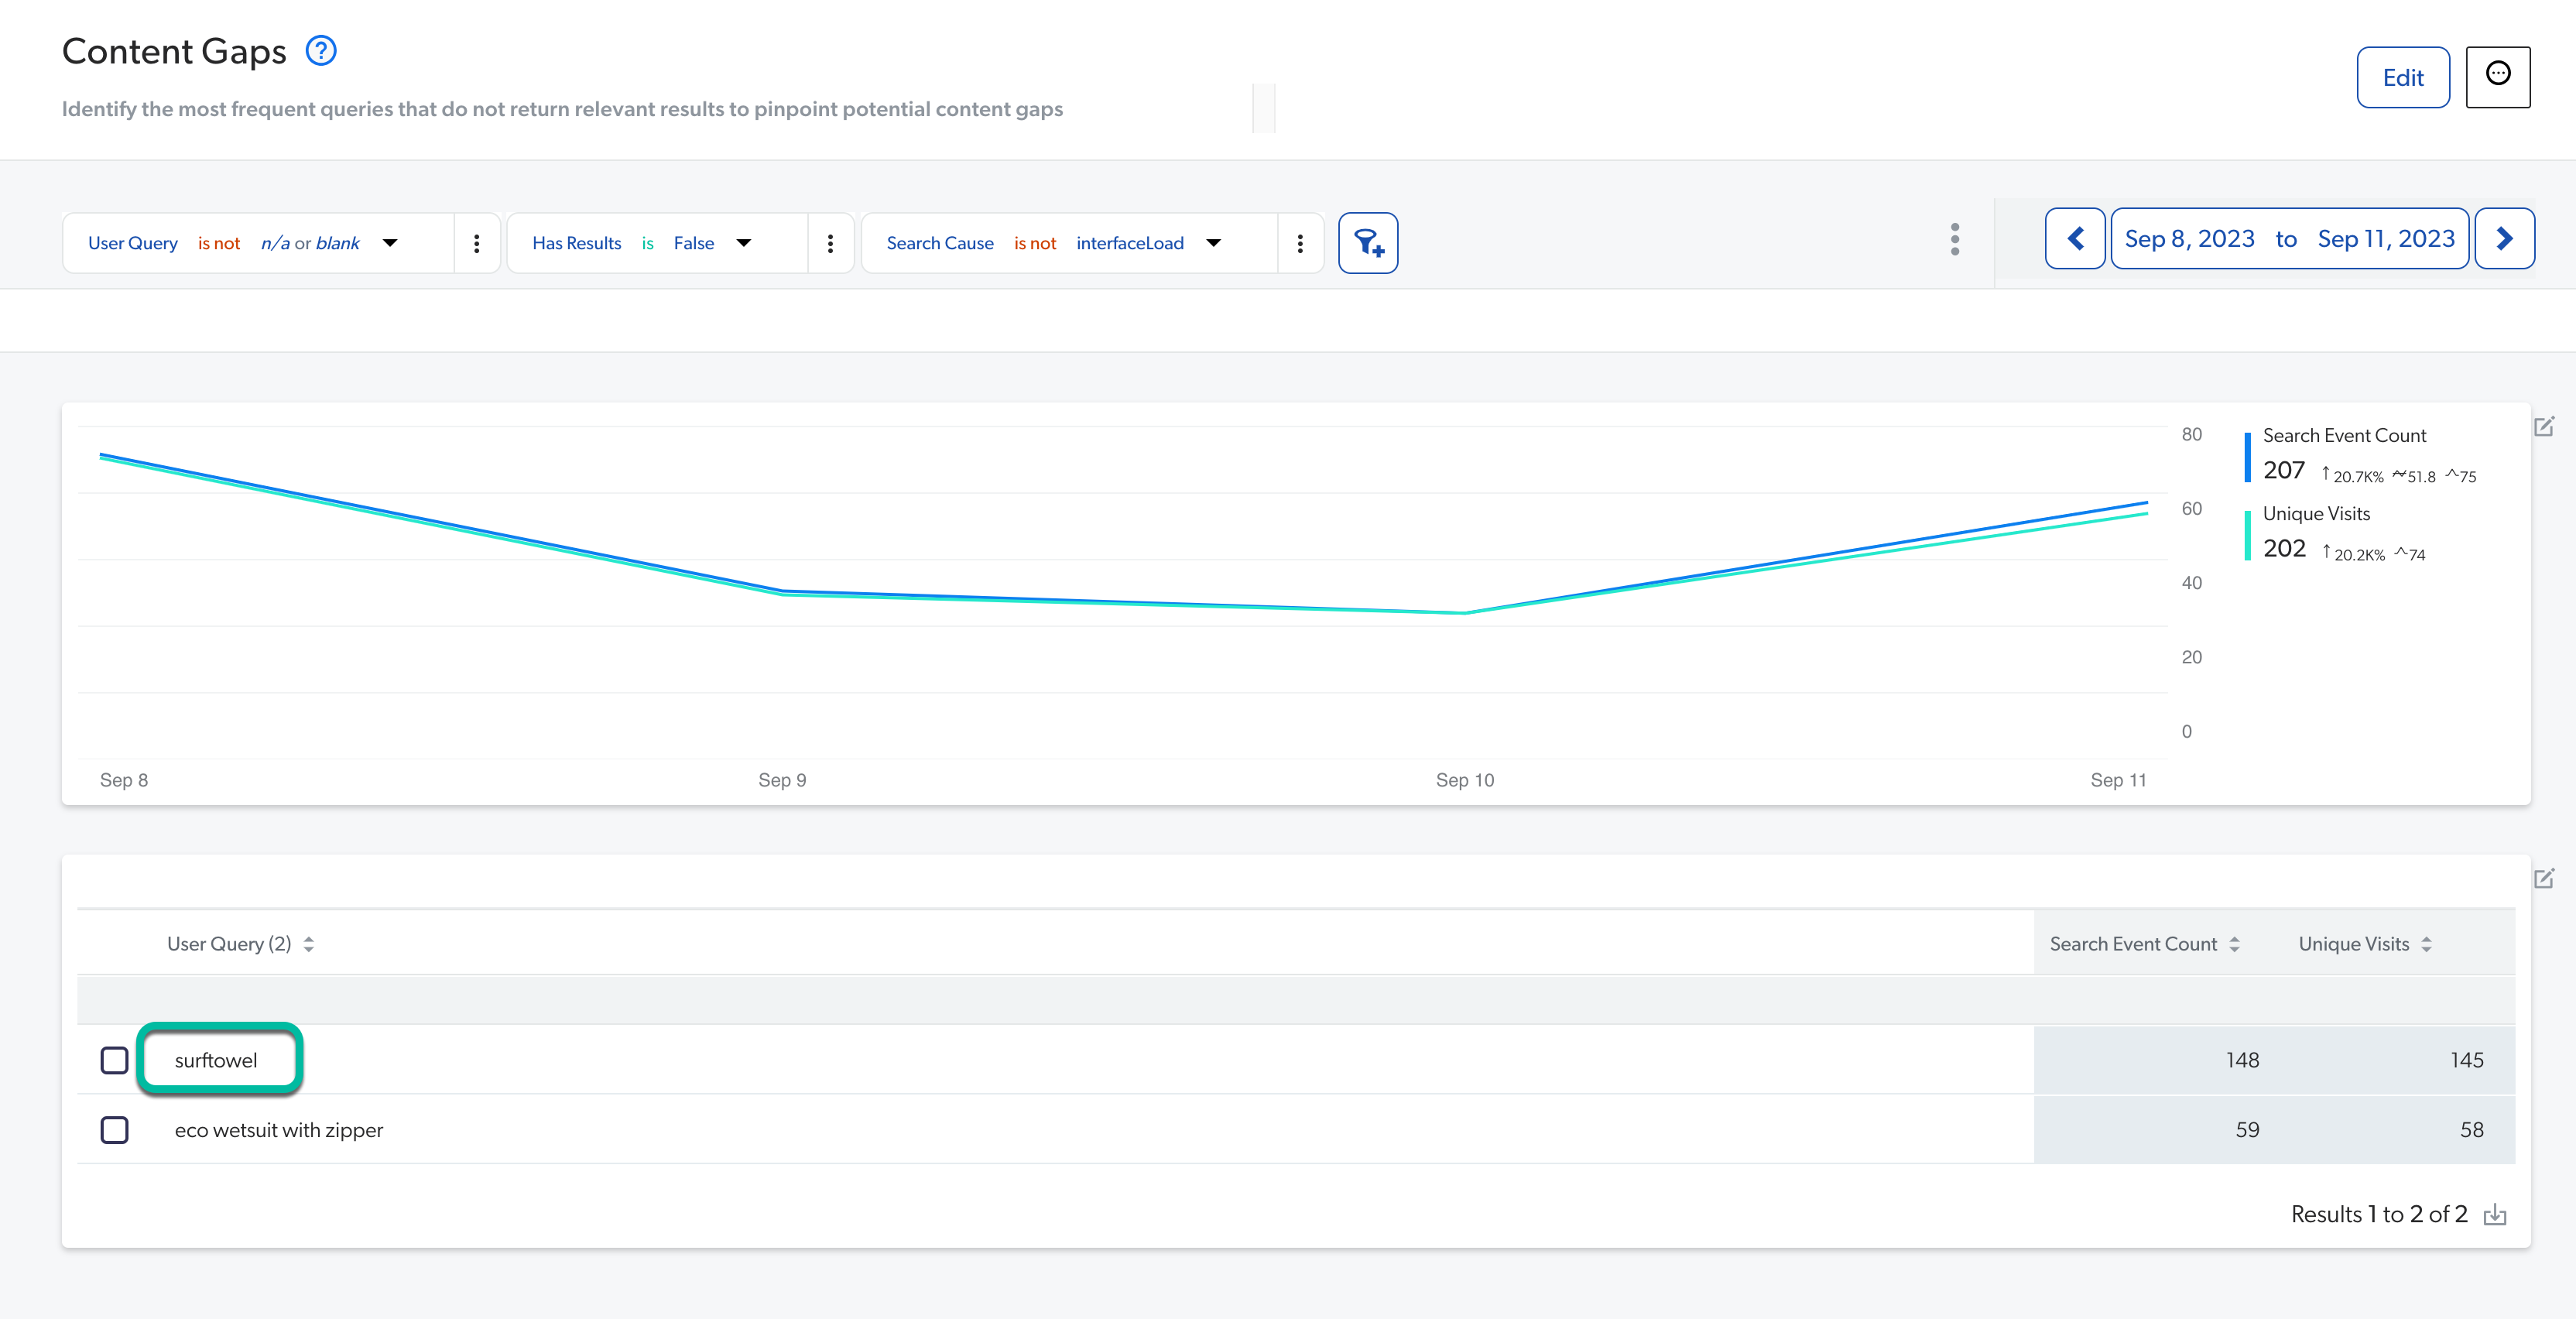
This explorer provides a list of queries that didn’t return results (see Content gaps).
-
Investigate why each user query with the highest Search Event Count value didn’t return results.
Notes-
While it’s normal to have search events without results because of typos or non-existing content, make sure that no queries for which you should expect results appear in the list.
-
A query might return results only for some users or in some interfaces because of permissions on items and hidden filters on queries used in some interfaces.
-
-
Determine whether the user query never returns results or if it only does so under certain patterns.
ExampleThe cards in this Content Gap explorer indicate that people aren’t finding anything when they include the keyword
surftowel. It might be that the item is identified by the termsurf towelinstead. To solve this issue, you can use a thesaurus rule to establish a relation between the termssurftowelandsurf towel. For more information on thesaurus rules, see Manage thesaurus rules.
-
-
In the Search Relevance explorer, do the following:
-
Take a sample of the top user queries that you feel should be followed by the most clicks by your users.
-
On the Reports (platform-ca | platform-eu | platform-au) page, click the Search Relevance explorer, and then click Open in the Action bar.
-
Add the Click Event Count metric to the table (see Add dimensions or metrics to the data table).
-
Sort the table with descending Click Event Count metric values.
-
Verify that your top user queries are often followed by a click by your users.
-
-
In the Summary dashboard after updating your search solution:
-
On the Reports (platform-ca | platform-eu | platform-au) page, click the Summary dashboard, and then click Open in the Action bar.
-
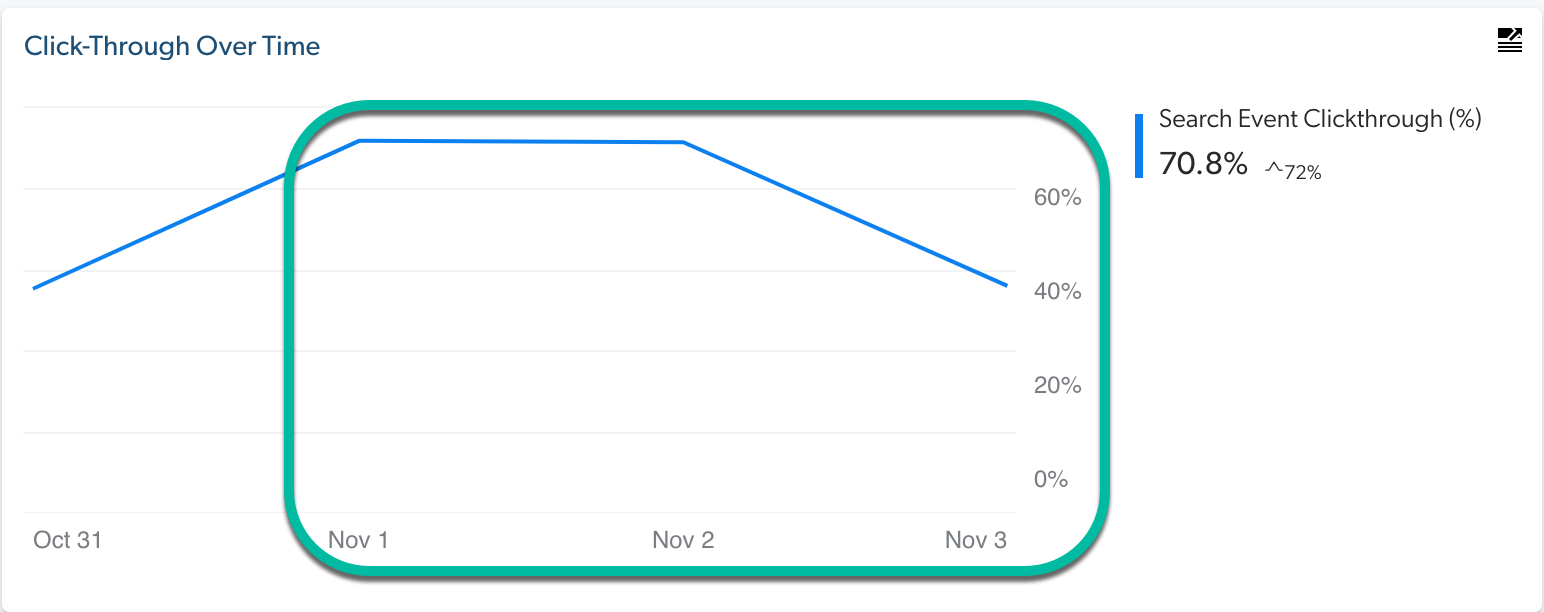
Spot any abnormal changes in the data. In particular, the Search Event Count (number of reported queries), the Average Click Rank Over Time (in the Relevancy tab) and Search Event Clickthrough (%) (in the Relevancy tab) metrics should remain stable.
ExampleThis metric card indicates that further investigations should be done if the drop in Search Event Clickthrough (%) around Nov 3rd matches one of the dates on which a search solution was updated:

-
-
Return to the Search Relevance explorer:
-
On the Reports (platform-ca | platform-eu | platform-au) page, click the Search Relevance explorer, and then click Open in the Action bar.
-
Remove the User Query dimension and Visit Count metric.
-
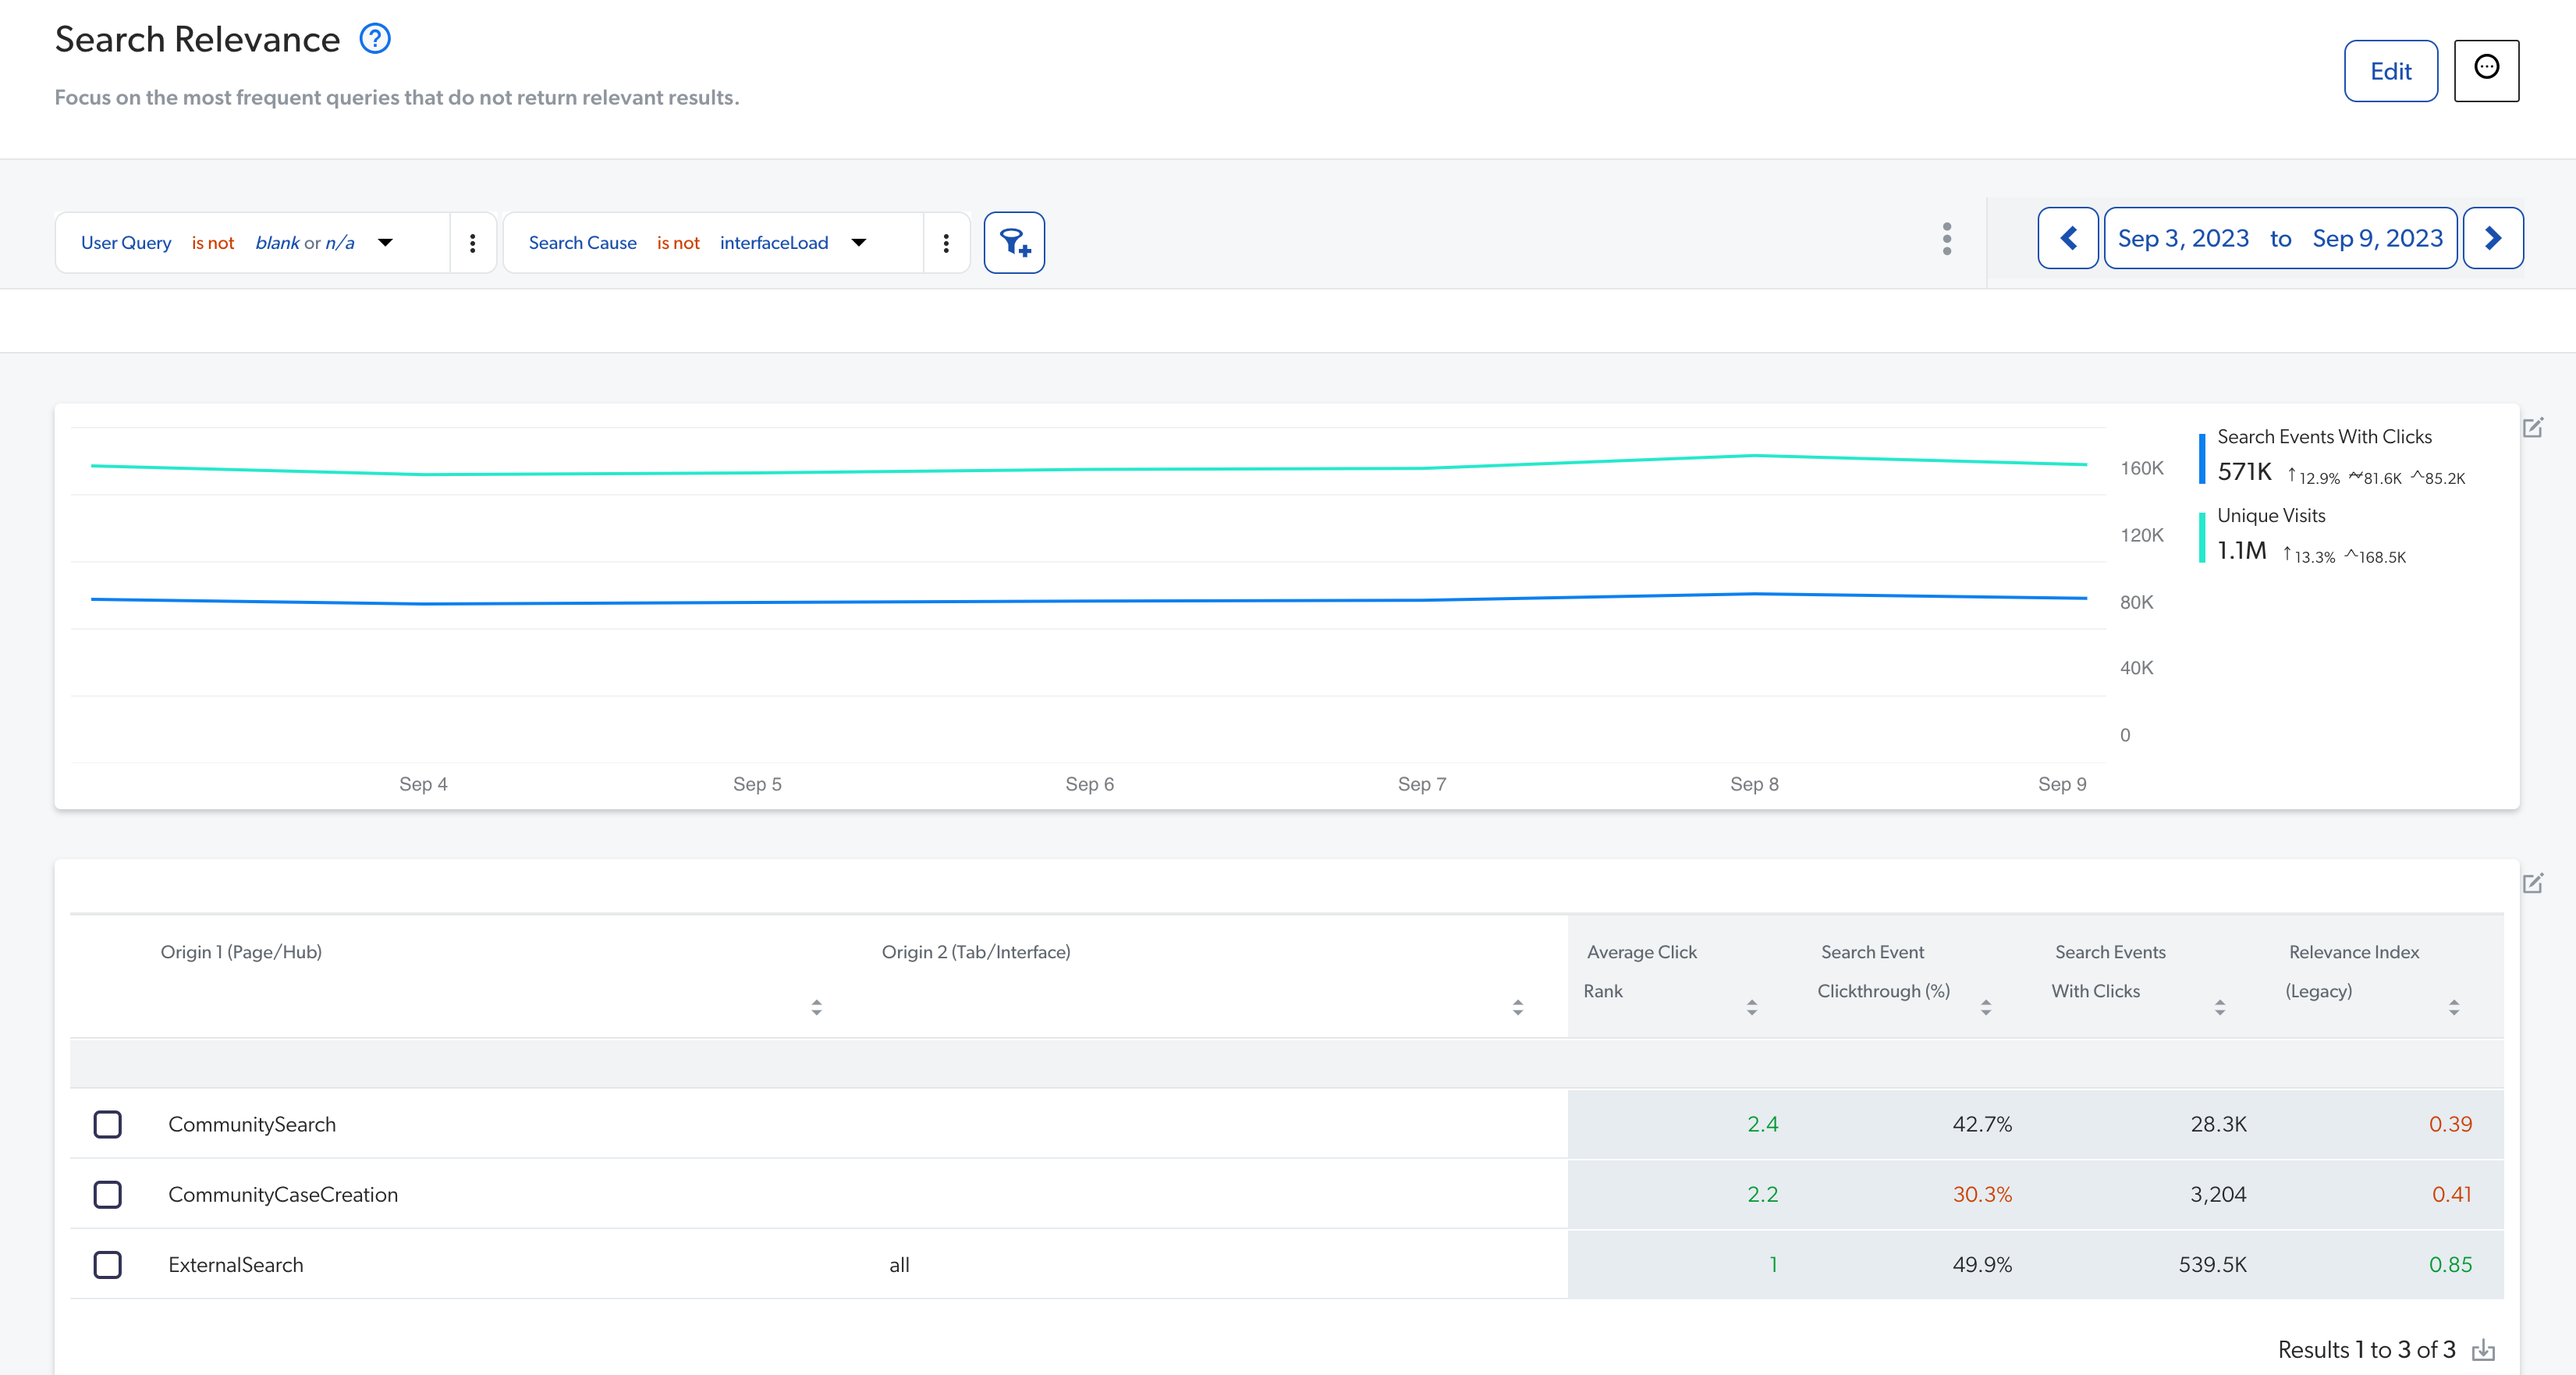
Add the Origin 1 (Page/Hub) and Origin 2 (Tab/Interface) dimensions to report the data by search interface.
As each search interface may have different configurations (such as filters, ranking, query extensions, and more), checking the relevance metrics for each interface can help you identify invalid configurations.
ExampleIf you notice low search event counts (which is the case for the CommunityCaseCreation hub below) or unusual low Search Event Clickthrough (%) or Relevance Index, there might be some configuration issues with this search interface.

-