Measure user adoption
Measure user adoption
When administrators and managers analyze the user activity and adoption of the search solution, they typically want answers to questions like the following:
-
Who uses the system?
-
Where are users located?
-
What are the most frequently used search interfaces?
-
Which group of users need training and information to increase their use of the search system?
-
What type of device do they use to search?
-
Which content must be improved to better fulfill user needs?
-
Is the search activity/adoption increasing with time?
-
What’s the impact of improvement interventions such as new content creation, promotion, or training?
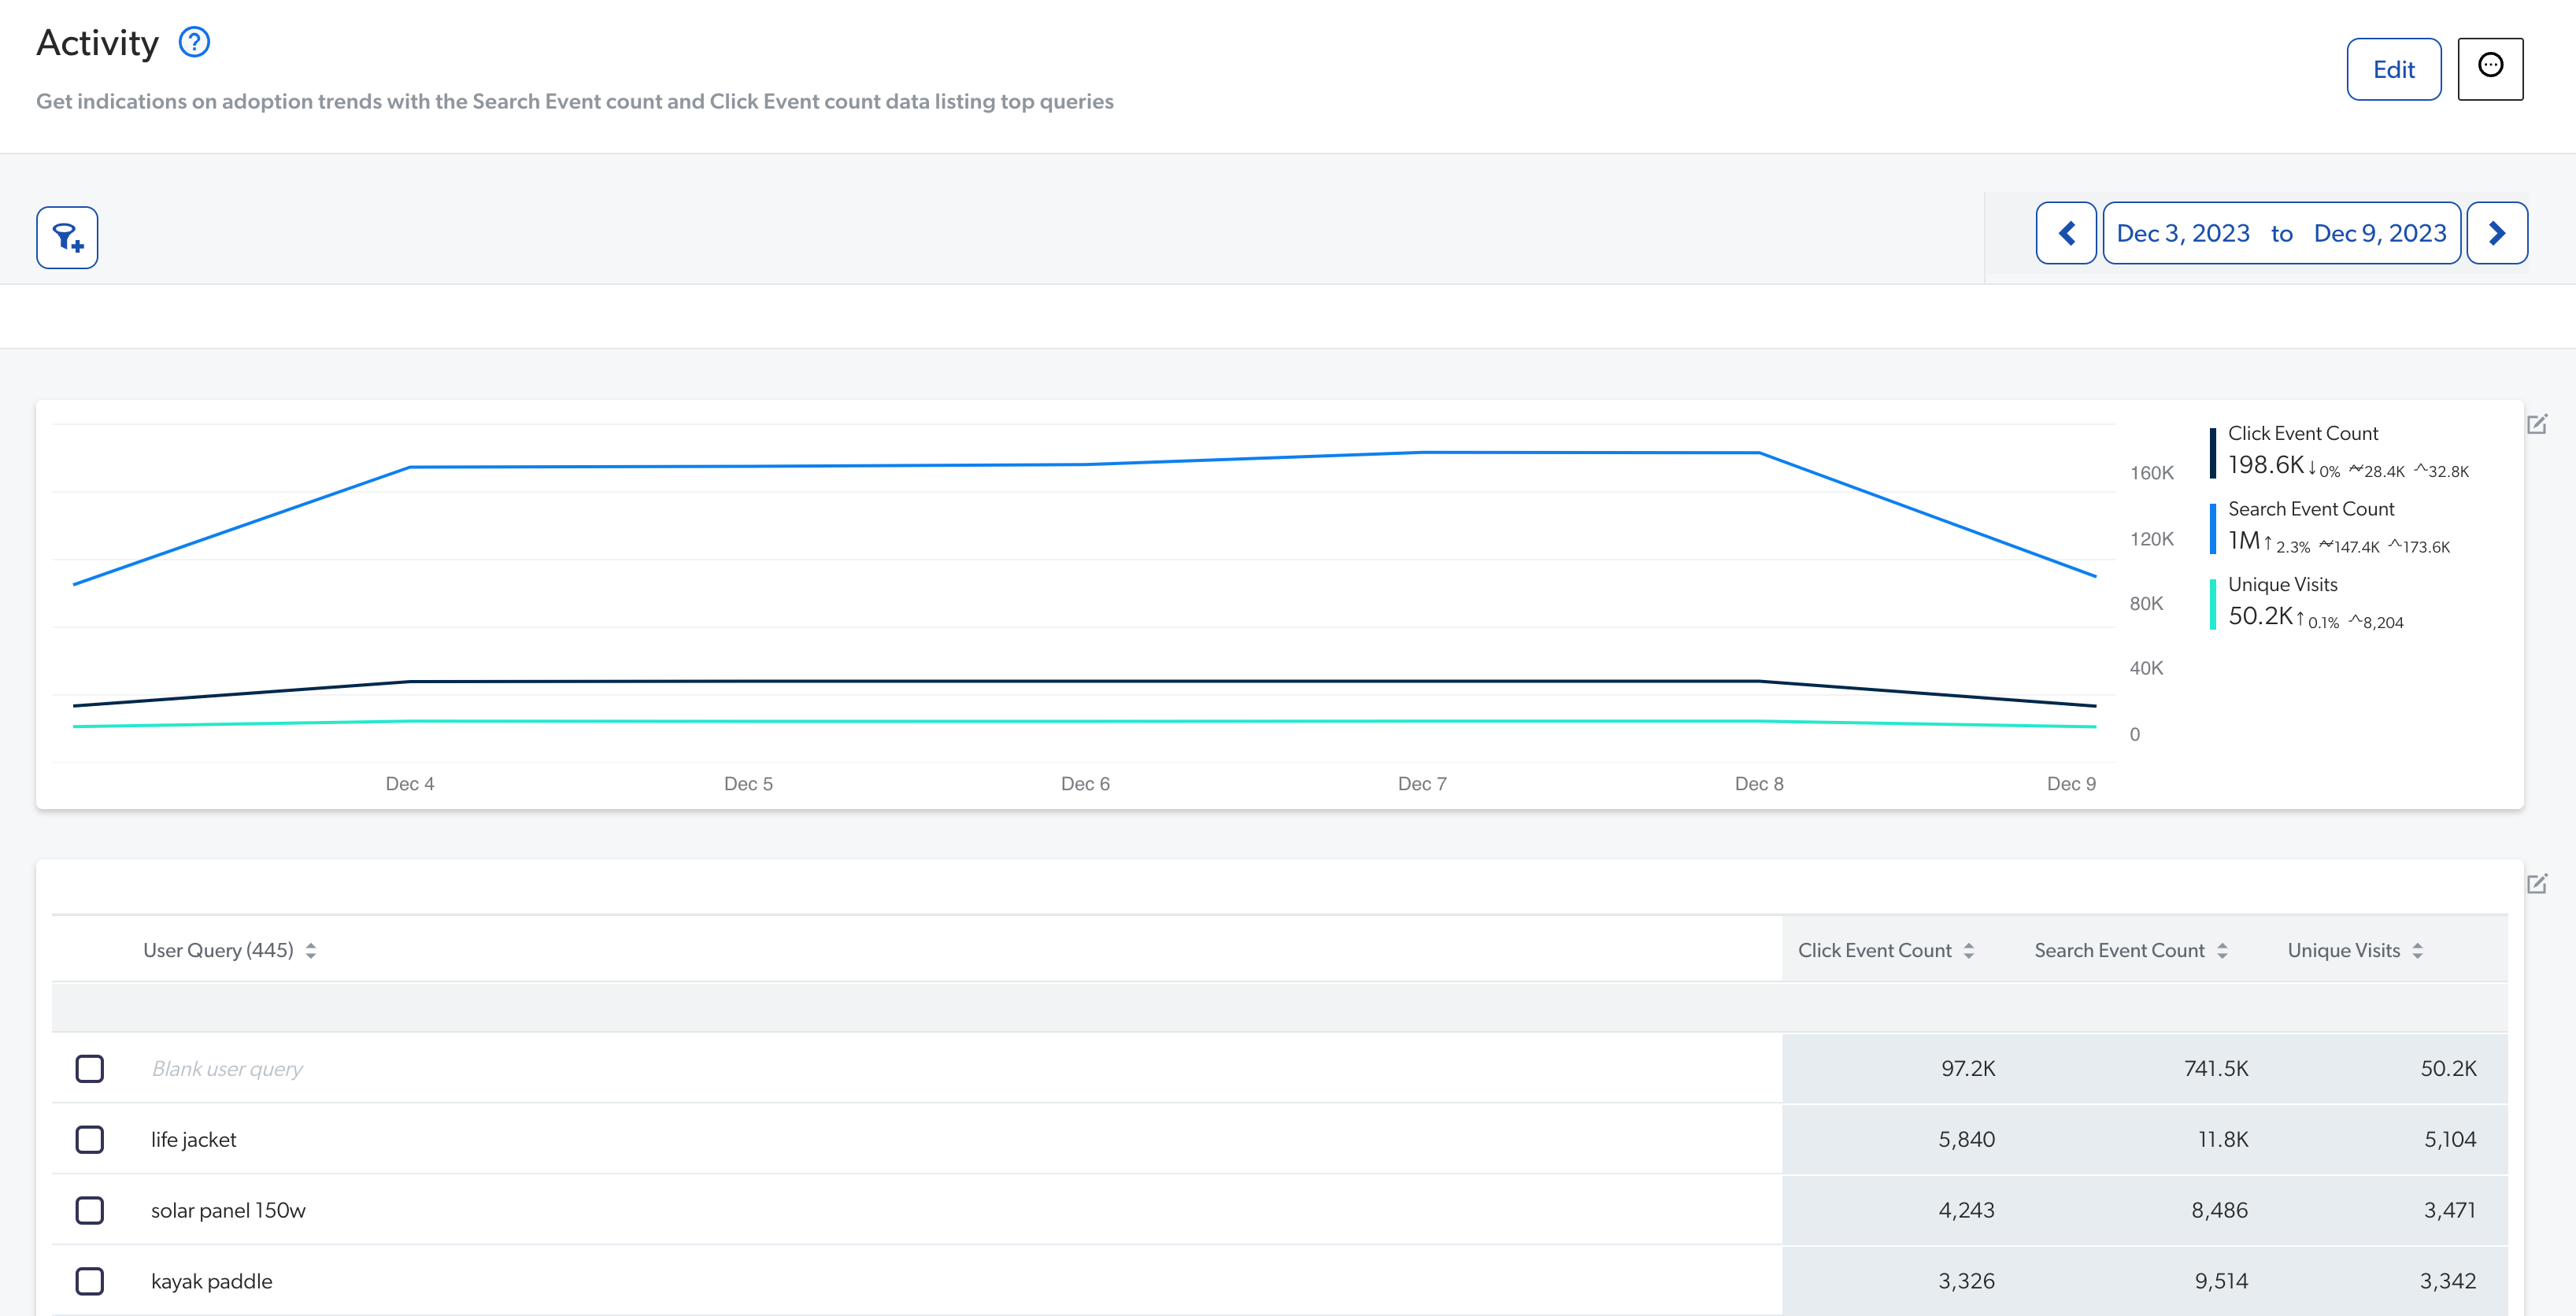
You can review the Activity explorer on the Reports page (in the Analytics menu section) to get indications on adoption trends with their timeline chart that displays relevant Search Event Count and Click Event Count metrics over time (see Review and manage explorers). It’s desirable that both of these metric trends increase with time, respectively indicating that users perform more searches and review more content, ultimately indicating that they increasingly find the information they need to do their work.
|
|
Note
A typical adoption trend often starts with an initial peak following the search deployment, promotion, or training while users discover the new search solution. A sharp decline is often then seen as users finished testing and have not yet integrated the usage of new solution to their routine tasks. Finally, a slow but steady adoption increase should take place as users are reminded of the benefits of the solution and progressively identify useful search use cases that they start to perform regularly. |
Use the dimensions to select metadata that are relevant for you to answer more precise questions (see Add Dimensions or Metrics to the Data Table).
-
When search users are authenticated, the User Name dimension can help you identify the most active search users. You can consider involving them in contributing to promote the search solution within their respective groups.
-
You can use the Group dimension to identify groups of people with low adoption to more efficiently trigger, plan, and measure adoption improvement actions such as promotion, training, search interface design optimization, documentation, or content curation.
-
You can use the Country, City, or Region dimensions to outline usage as a function of the users' location. Varying adoption by country or language can indicate that the search solution has not been properly localized or that content isn’t as relevant in all languages.
-
You can use the Browser, Browser With Version, Device Category, Operating System, Operating System With Version, dimensions to evaluate adoption variation as a function of the device type used to search. A low adoption for tablet or mobile users may indicate poor user experience on these devices or suggest that optimizing mobile version of the search pages isn’t required because of the low number of visits on these devices.