Add visit metric time series cards
Add visit metric time series cards
Coveo Analytics dashboards offer many ways to review the data collected by Coveo Analytics.
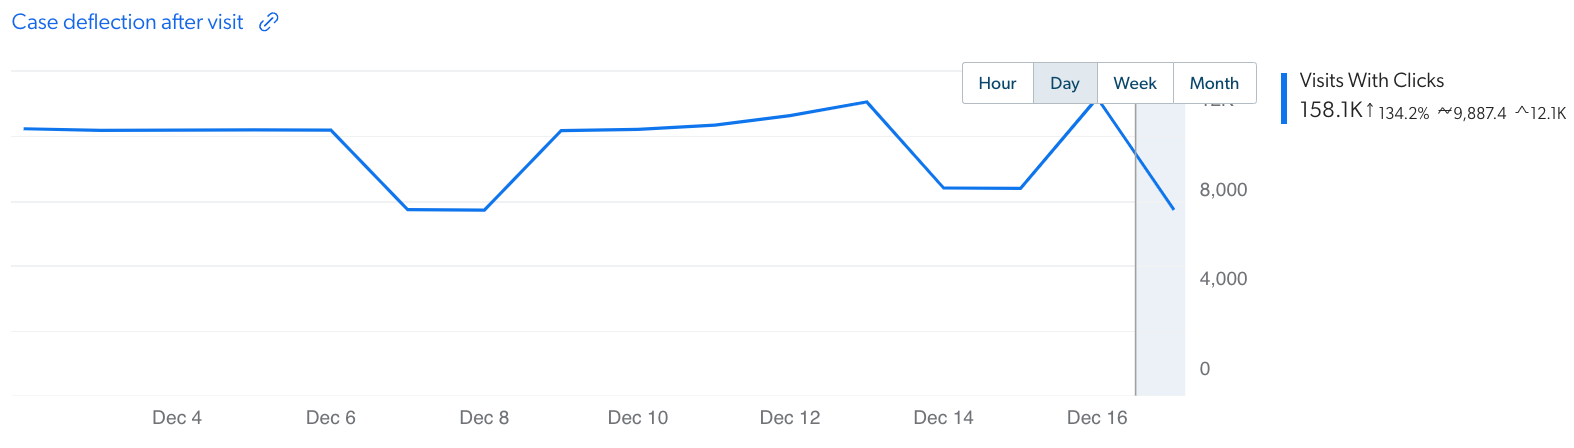
You can add visit metric time series cards to dashboards to evaluate the number of user visits in which one or more particular events occur over a certain period, such as a case deflection after a user opened at least an item over the past few months.
Add visit metric time series card to dashboard
-
In an existing dashboard, access Edit mode by clicking Edit in the upper-right corner.
 Note
NoteIn a new dashboard, the report is in Edit mode by default (see Add dashboards).
-
In a section, click Add card to section to access the Add a card dialog.

You can also duplicate an existing card with
 , and then only modify what needs to be different.
 -
In the Add a card dialog:
-
Select Visit metric time series.
-
In the first input, enter a meaningful Card title.
NoteIf you leave the box empty and save the dashboard, the card title will be
Visit metric time series. -
Under Show the evolution over time of, click the dropdown menu, and then select the available visit-related metrics you want to measure:
-
Visit Count: The number of visits regardless of unique IP addresses and user names.
-
Visit Clickthrough (%): The number of visits with at least one click divided by the total number of visits.
-
Visits With Clicks: The number of visits with at least one click.
-
Visits With Manual Search Events: The number of visits with at least one query performed by a user using the search box.
NoteUser query refinements are excluded.
-
-
(Optional) In the Advanced settings:
-
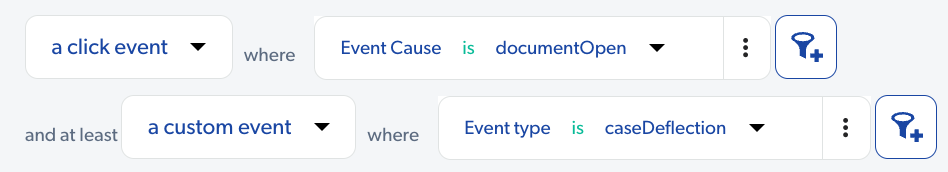
Under Show visits containing, click the dropdown menu, and then select between four event categories (an event, a search event, a click event, or a custom event).
NoteCustom data can only be leveraged when using the UA Protocol. If your Coveo implementation uses the Event Protocol, custom event types shouldn’t be added to a report since they won’t function as expected.
-
Access the dialog to add global dimension filters by clicking
 .
.Once created, the filters appear under Show visits containing and only the user visits meeting your criteria appear.
Notes-
You can add filters to apply on another event category by clicking the And at least link. The visits that appear will then match these two parameters.
For example, you want to browse user visits in which an item was opened and a case deflection occurred.
-
Once you’re done with the filters, you can bookmark the web page or copy/paste the URL in the place of your choice to be able to later access the same state of the Visit Browser.
-
-
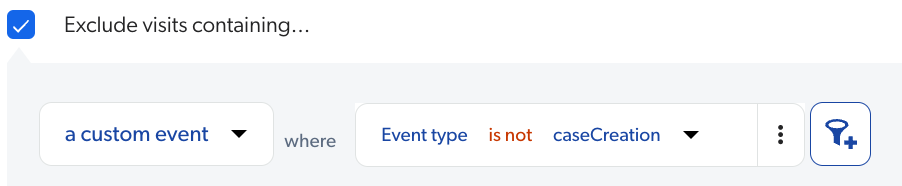
When you want to add exclusion filters, select the Exclude visits containing checkbox and then add one or more exclusion filters.
Once created, the filters appear under Exclude visits containing and the user visits meeting your criteria are excluded.
ExampleYou want to analyze user sessions containing a specific user query, but in which no support cases were created, so you select the checkbox to be able to add the following filter:
-
When you want to add event exclusion filters, select the Hide events checkbox, and then add one or more exclusion filters.
Once created, the filters appear under Hide Events, and the events meeting your criteria are excluded.
Notes-
If a visit has only one event and this event is filtered out, the visit will be hidden as well
-
You can add alternative filters by clicking Or where. Events matching one of these filters will be hidden.
-
-
You can add a named filter with the current filters on a line:
-
At the right end of the bar, click
 , and then select Save filter as or Save filters as.
 -
In the Save as a Named Filter dialog, in the first input, enter a meaningful Filter name, and then click Save.
The named filter is now applied to the user visits.
-
You can remove all the filters on a line, at the right end of the row, by clicking
, and then selecting Remove or Remove all filters.
-
-
In the Header destination link input, set a destination link when clicking the card title.
-
Under Graph display option, when you want to see metric values on top of every time series points, select Show metric.
-
Under Legend display options, optionally modify the default settings:
-
When you want to see trend data relative to the previous equivalent period as the one that’s currently selected, select the Show trend option.
Notes-
This option is turned off by default, because calculating the trends increases the dashboard complexity and slows down the dashboard generation. Enable this option when you find the trend information useful.
-
Once the card is saved, the trend value appears next to the dimension value as a percentage with an up or a down arrow respectively indicating an increasing or a decreasing trend.
-
When hovering the trend icon, you see the metric value (total) for the current period and previous equivalent period.
-
-
When you don’t want to see the average and peak of each dimension value based on the time interval or period, clear the Show average and Show peak checkboxes.
ExampleThe highest number of clicks during a day last week.
-
-
Under Display as, select the time series to be shown using Line or Bar charts.
-
-
Click Add card.
-
-
Back on the dashboard, click Save in the upper-right corner.
Required privileges
The following table indicates the required privileges to view and edit dashboards from the Reports (platform-ca | platform-eu | platform-au) page and associated panels (see Manage privileges and Privilege reference).
Access to dashboards or part of their content may be further restricted as a function of the member (see Manage access to reports and Manage permission filters).
| Action | Service | Domain | Required access level |
|---|---|---|---|
View dashboards |
Analytics |
Analytics data |
View |
Dimensions |
View |
||
Reports |
View |
||
Organization |
Organization |
View |
|
Edit dashboards |
Analytics |
Administrate |
Allowed |
Analytics data |
View |
||
Dimensions |
View |
||
Reports |
Edit |
||
Organization |
Organization |
View |