Metrics
Metrics
A metric is a numerical value that reflects key data in your Coveo Analytics reports. Metrics help you measure and analyze performance by calculating data from events for the specified dimensions and result filters.
In the Coveo Administration Console, metrics are based on recorded events and can appear as trends, summary indicators, or detailed values in reports.
|
|
Note
For some metrics, a high value is good, and for others, a high value can reveal a relevance issue (see Review implementation successes and issues with metrics). |
Click metrics
Click metrics measure user interactions with search results, such as how often they click and where.
Average Click Rank
This metric measures the average position of clicked items in the search results for the specified dimensions and result filters. Its value is greater or equal to 1. Lower values are better. A value of 1 would mean that users always open the first item in the search results list.
|
|
Note
Setting goals based on the Average Click Rank metric isn’t recommended for commerce solutions. When shopping online, customers tend to browse through results to see the available products. |
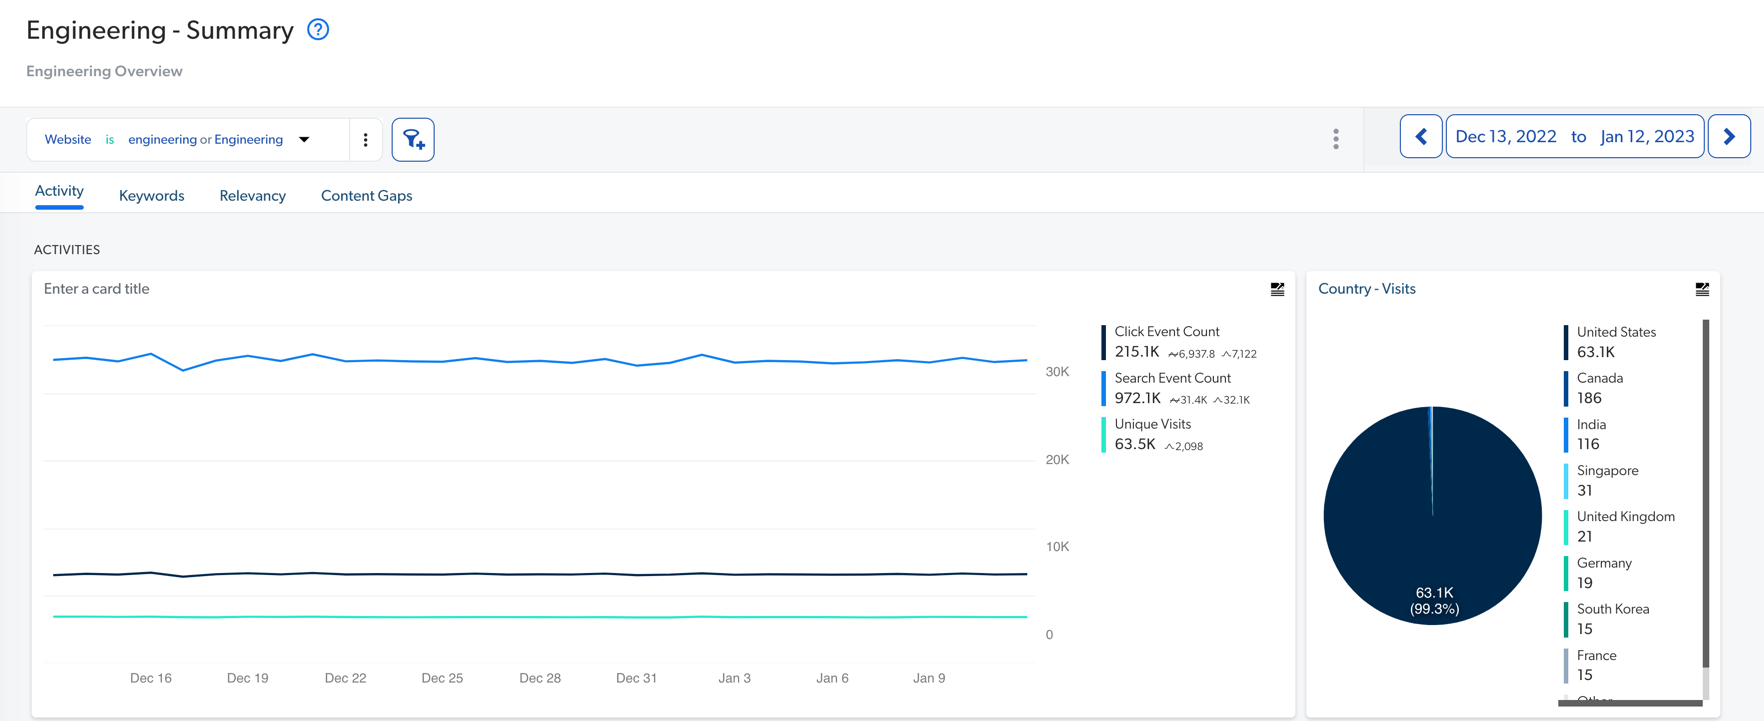
The selected dimension is Country and users from Spain have significantly higher Average Click Rank value compared to users from other countries.
This can indicate poorer content or relevance for content available in Spanish.
|
|
For the related SQL expression that can be added to a query in the Snowflake reader account, see SQL expressions reference. |
Click Event Count
This metric represents the total number of clicks. In a metric card, in a dashboard without filters, the Click Event Count is the sum of all click events (see Click Event Cause).
|
|
For the related SQL expression that can be added to a query in the Snowflake reader account, see SQL expressions reference. |
Click Rank Maximum
This metric represents the highest-ranked position of a clicked item in the search results.
Click Rank Minimum
This metric represents the lowest-ranked position of a clicked item in the search results.
Click Rank Sum
This metric represents the sum of the positions of all clicked items in the search results.
Search Event Clickthrough (%)
This metric represents the percentage of search events with one or more clicked search results. Its value is between 0 and 100. A higher value indicates better search results.
To determine the clickthrough percentage, the Search Events With Clicks and Search Events Counts metrics are used. The formula used to calculate the Search Events Clickthrough % is:
(Search Events With Clicks / Search Events Count) * 100
|
|
Note
The clickthrough rate metric is affected by every search event, but not all queries. For instance, when a facet value is selected or deselected, it triggers both a search event and a query to the Search API, hence considered in the calculation. However, navigating between search result pages by clicking a page number triggers a query but not a search event, hence not considered in the calculation. For example, a search event followed by a click on two facets, and then a click on a result, leads to a clickthrough rate of 33.33% ( |
Manual Search Event Count
This metric represents the total number of queries performed by users (using the search box). In Coveo Analytics, a manual search is defined as a search where the Search Cause dimension contains one of the following values:
-
didyoumeanAutomatic -
didyoumeanClick -
searchboxSubmit -
searchboxAsYouType -
omniboxSearch -
omniboxAnalytics -
omniboxFromLink -
omniboxField -
searchFromLink
|
|
Notes
|
|
|
For the related SQL expression that can be added to a query in the Snowflake reader account, see SQL expressions reference. |
Search Events With Clicks
This metric represents the total number of queries resulting in one or more clicks in a search result.
|
|
For the related SQL expression that can be added to a query in the Snowflake reader account, see SQL expressions reference. |
Search Event Count
This metric represents the total number of queries. In a metric card, in a dashboard without filters, the Search Event Count is the sum of all search events (see Search Event Cause).
|
|
For the related SQL expression that can be added to a query in the Snowflake reader account, see SQL expressions reference. |
Relevance Index / Relevance Index (Legacy)
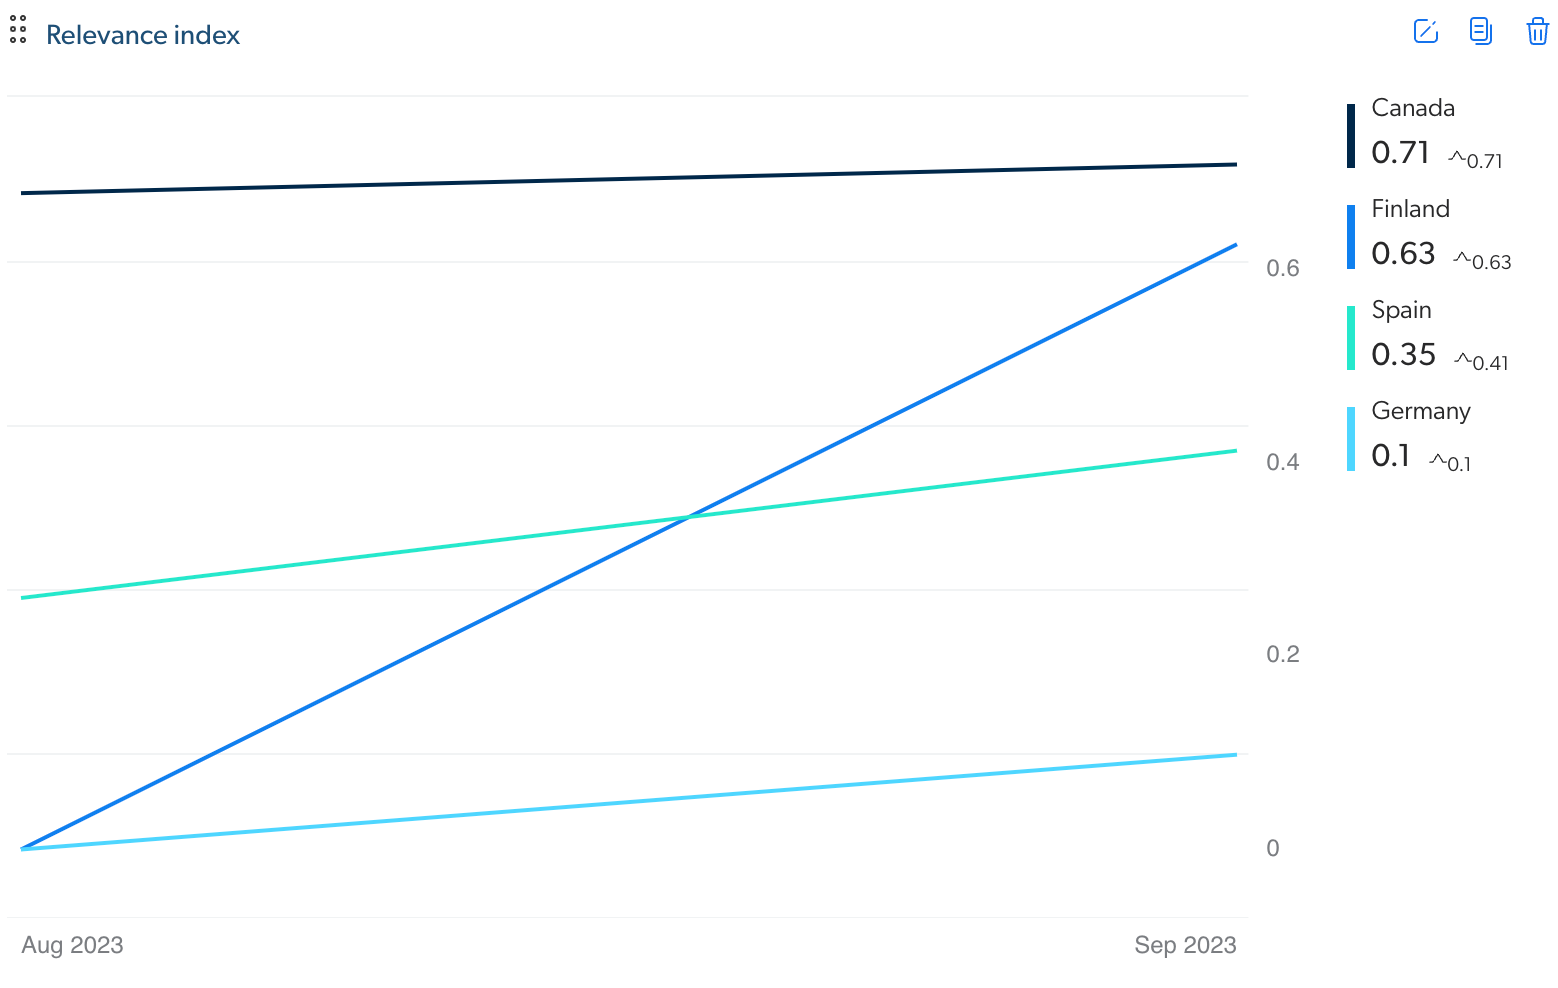
This metric is calculated with a formula based on the Search Event Clickthrough and the Average Click Rank metrics to highlight ranking issues. Its value is between 0 and 1. Higher values are better. More frequently submitted queries with clicks on results farther in the search results list yield to a lower value (see Relevance Index metric).
Sorting by this value in descending order brings to the surface the most important potential relevance issues on which an administrator or an analytics manager can focus.
When the Country dimension is selected and Germany has the lowest value for this metric, relevance issue for users from Germany should be investigated.
Refined Search Event Count
This metric represents the number of query refinements done by users (facets, interface change, etc.).
|
|
Note
The search cause for the related event must be manual for a query to be counted. |
|
|
For the related SQL expression that can be added to a query in the Snowflake reader account, see SQL expressions reference. |
Unique [Click Dimension Name]
This metric represents the number of unique dimension values (see Click dimensions).
The Unique Click Cause metric is the number of unique click causes that triggered an event in the search interface to be recorded.
Search metrics
Search metrics focus on user queries and search result performance.
Average Number of Results
This metric measures the average number of results returned by the search interface.
Average Response Time (ms)
This metric measures the average time in milliseconds the search interface took to return results.
|
|
For the related SQL expression that can be added to a query in the Snowflake reader account, see SQL expressions reference. |
Average Search Query Word Count
This metric measures the average number of words in queries. It’s calculated based on the total number of words in a query expression, without removing stop words.
|
|
For the related SQL expression that can be added to a query in the Snowflake reader account, see SQL expressions reference. |
Search Event Clickthrough (%)
This metric represents the percentage of search events with one or more clicked search results. Its value is between 0 and 100. A higher value indicates better search results.
To determine the clickthrough percentage, the Search Events With Clicks and Search Events Counts metrics are used. The formula used to calculate the Search Events Clickthrough % is:
(Search Events With Clicks / Search Events Count) * 100
|
|
Note
The clickthrough rate metric is affected by every search event, but not all queries. For instance, when a facet value is selected or deselected, it triggers both a search event and a query to the Search API, hence considered in the calculation. However, navigating between search result pages by clicking a page number triggers a query but not a search event, hence not considered in the calculation. For example, a search event followed by a click on two facets, and then a click on a result, leads to a clickthrough rate of 33.33% ( |
Manual Search Event Count
This metric represents the total number of queries performed by users (using the search box). In Coveo Analytics, a manual search is defined as a search where the Search Cause dimension contains one of the following values:
-
didyoumeanAutomatic -
didyoumeanClick -
searchboxSubmit -
searchboxAsYouType -
omniboxSearch -
omniboxAnalytics -
omniboxFromLink -
omniboxField -
searchFromLink
|
|
Notes
|
|
|
For the related SQL expression that can be added to a query in the Snowflake reader account, see SQL expressions reference. |
Number of Results Maximum
This metric represents the maximum number of results returned by the search interface for the specified dimensions and filters.
Number of Results Minimum
This metric represents the minimum number of results returned by the search interface given the specified dimensions and filters.
Number of Results Sum
This metric is the total number of results returned by the search interface for the specified dimensions and filters.
Search Event Count
This metric is the total number of queries for the specified dimensions and filters.
|
|
For the related SQL expression that can be added to a query in the Snowflake reader account, see SQL expressions reference. |
Refined Search Event Count
This metric is the number of query refinements done by users (facet, interface change, etc.) for the specified dimensions and filters.
|
|
Note
The search cause of the related event must be manual for a query to count. |
|
|
For the related SQL expression that can be added to a query in the Snowflake reader account, see SQL expressions reference. |
Response Time (ms) Maximum
This metric represents the maximum time, in milliseconds, that the search interface took to return results for the specified dimensions and filters.
Response Time (ms) Minimum
This metric represents the shortest time, in milliseconds, that the search interface took to return results for the specified dimensions and filters.
Response Time (ms) Sum
This metric is the total time in milliseconds the search interface took to return results for the specified dimensions and filters.
Unique [Search Dimension Name]
This metric is the number of unique dimension values for the specified dimensions and filters (see Search dimensions).
The Unique User Query metric is the number of unique queries entered by users in the search box for the specified criteria.
If ten people perform the same exact query (for example, wireless headphones), this query is counted as one in the Unique User Query metric.
Custom metrics
Custom metrics allow you to track unique behaviors or data points relevant to your implementation.
|
|
Note
Custom data can only be leveraged when using the UA Protocol. If your Coveo implementation uses the Event Protocol, custom dimensions and metrics shouldn’t be added to a report since they won’t function as expected. |
Attach to Case Count
This metric is the total number of times agents attached a result to a case (caseAttach event) for the specified dimensions and filters.
|
|
For the related SQL expression that can be added to a query in the Snowflake reader account, see SQL expressions reference. |
Custom Event Count
This metric is the total number of custom events for the specified dimensions and filters. In a metric card, in a dashboard without filters, the Custom Event Count is the sum of all custom events (see (Custom) Event Type).
|
|
For the related SQL expression that can be added to a query in the Snowflake reader account, see SQL expressions reference. |
Unique [Custom Dimension Name]
This metric is the number of unique dimension value for the specified dimensions and filters (see Search dimensions).
The Unique Custom Event Value metric is the number of unique values saved for a custom event performed in a search interface, for the specified criteria.
All event type (click, search, and custom) metrics
Unique [All Event Type Dimension Name]
This metric is the number of unique dimension value for the specified dimensions and filters (see Search dimensions).
The Unique City metric is the number of unique cities from which a user performed an event, based on the IP address, for the specified criteria.
Unique Client ID
This metric measures the number of unique client IDs that perform a query for the selected filters and dimensions (see What’s the client ID).
Unique User IP
This metric measures the number of unique IP addresses. Sometimes, different users can share the same IP address.
|
|
For the related SQL expression that can be added to a query in the Snowflake reader account, see SQL expressions reference. |
Unique User ID
This metric measures the number of unique user IDs that execute a query using the selected filters and dimensions (see User ID).
|
|
For the related SQL expression that can be added to a query in the Snowflake reader account, see SQL expressions reference. |
Unique Visitor ID
This metric measures the number of unique visitors. A visitor ID is based on persistent cookies, so a visitor keeps the same ID as long as they use the same browser and never clear the browser cookies. The visitor ID is a generated random sequence and doesn’t allow to personally identify an anonymous user.
|
|
Note
Third-party cookies will eventually be deprecated, therefore use the Unique Client ID metric instead. |
|
|
For the related SQL expression that can be added to a query in the Snowflake reader account, see SQL expressions reference. |
Visit Clickthrough (%)
This metric measures the number of visits with at least one click divided by the total number of visits.
|
|
Note
This metric is only available when adding visit metric cards (see Add Visit metric cards). |
|
|
For the related SQL expression that can be added to a query in the Snowflake reader account, see SQL expressions reference. |
Visit Count
This metric measures the number of visits regardless of unique IP addresses and user names. Visits are determined by time-based cookies. A visit ends after 30 minutes of inactivity.
Visits With Clicks
This metric measures the number of visits with at least one click.
|
|
Note
This metric is only available when adding visit metric cards (see Add Visit metric cards). |
|
|
For the related SQL expression that can be added to a query in the Snowflake reader account, see SQL expressions reference. |
Visits With Manual Search Events
This metric measures the number of visits with at least one query performed by a user using the search box.
|
|
Notes
|
|
|
For the related SQL expression that can be added to a query in the Snowflake reader account, see SQL expressions reference. |