Add calculated metric cards
Add calculated metric cards
dashboards offer many ways to review the data collected by Coveo Analytics.
You can, among other things, add calculated metric cards to dashboards to review the importance of a metric value in your organization. For example, you can use a calculated metric card to measure the ratio of visits on your customer support website with at least one user query to the total number of visits.
Add calculated metric cards in dashboards
-
In an existing dashboard, access Edit mode by clicking Edit in the upper-right corner.
 Note
NoteIn a new dashboard, the report is in Edit mode by default.
-
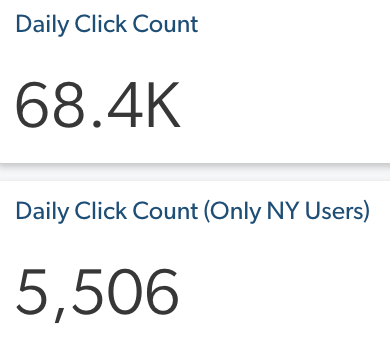
Create the Metric or Visit metric cards that you want to use in the calculation, if not already done.
ExampleYou want to know the ratio of clicks made daily by New York users compared to the total click event count so you create the two following metric cards.
 Note
NoteSince calculated metric cards use either two existing metric card values or a number and a metric card value in their calculations, a metric card is required in the dashboard tab in which you want to add a calculated metric card.
-
In a section, click Add card to section to access the Add a card dialog.
NoteYou can also click
 to duplicate an existing card, and then only modify what’s required.
 -
In the Add a card dialog:
-
Select Calculated metric.
Examples-
You can multiply the number of cases deflected by the average cost to resolve a case.
-
You can divide the number of clicks in a city by the total click event count.
-
-
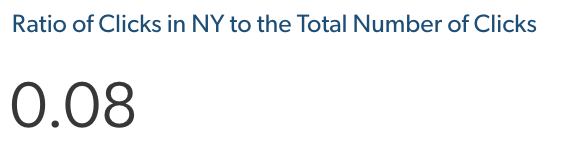
In the first input, enter a meaningful Card title (for example,
Ratio of Clicks in New-york to the Total Number of Clicks).
NoteIf you leave the input empty and save the dashboard, the card title will be Calculated metric.
-
After clicking the First metric card value or number dropdown menu:
-
Click the Entry type dropdown menu, and then select whether you want to use a Metric card value or a Number as your first equation variable.
-
Depending on your Entry Type selection:
-
When you select Metric card value, click the Metric card dropdown menu, and then select one available metric card of the current report tab.
NoteA metric card can only be used in one calculated metric card.
-
When you select Number, in the Number box, enter a round number (other than 0) or a decimal.
-
-
-
Click Apply.
-
Click the Operator dropdown menu, and then select one equation operator between the available options:
-
+ (addition)
-
- (subtraction)
-
÷ (division)
-
x (multiplication)
-
-
In the Second metric card value or number dropdown menu, select or enter another equation variable as you did previously.
NoteYou must select at least one metric card value as one equation variable.
-
Under Value formatting, choose how the card value is formatted by selecting one of the following options:
Notes-
By default, no formatting is applied to the calculated metric value.
-
The rule used to format the card value
{value}appears between parentheses following the option name.
-
None
{value} -
Currency
${value} -
Percentage
{100*value}% -
Custom
When selecting Custom, enter the Rule used to format the calculated metric value in the following form:
NoteValue must be placed between braces (
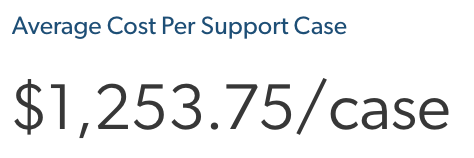
{}), but parts between square brackets ([]) are optional (for example,[s]{[n*]value[.n]}[s], where you replace[s]with any string,[n]by a number, and the second[n]specifies the number of decimals).For example, you want to display the cost to manage a support case, so you enter the following rule:
${value}/caseIn the report, the card value looks like the following:
-
-
Click Add card.
-
-
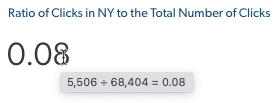
Back on the dashboard, click Save in the upper-right corner.
When hovering over the card, you can see the calculation that’s made to get this result.
Required privileges
The following table indicates the required privileges to view and edit dashboards from the Reports (platform-ca | platform-eu | platform-au) page and associated panels (see Manage privileges and Privilege reference).
Access to dashboards or part of their content may be further restricted as a function of the member (see Manage access to reports and Manage permission filters).
| Action | Service | Domain | Required access level |
|---|---|---|---|
View dashboards |
Analytics |
Analytics data |
View |
Dimensions |
View |
||
Reports |
View |
||
Organization |
Organization |
View |
|
Edit dashboards |
Analytics |
Administrate |
Allowed |
Analytics data |
View |
||
Dimensions |
View |
||
Reports |
Edit |
||
Organization |
Organization |
View |