Review implementation successes and issues with metrics
Review implementation successes and issues with metrics
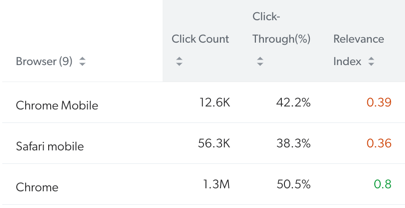
Coveo Analytics report cards such as table, metric, and trend cards display metric values in different colors:
Depending on the metric:
-
A green value either means that the value has improved compared to a certain period and/or that your Coveo-powered search interface has a good search relevance.
-
A black value can either be neutral or have no significance.
-
A red value can mean that the value is retrogressing compared to a certain period and/or that your Coveo-powered search interface has search relevance issues.
You can create analytics dashboards to learn for which metrics their search interface performs well and which metrics signal potential relevance issues.
Access a dashboard in Edit mode
On the Reports (platform-ca | platform-eu | platform-au) page, do one of the following:
-
Click the desired dashboard, click Open in the Action bar, and then click Edit in the upper-right corner.
-
Click Add, and then select Blank dashboard.
Find search implementation successes and issues with metrics
You can use report cards to assess your relevance metrics and identify potential relevance issues.
-
On the dashboard:
-
Add table, metric, or trend cards and report on at least the following relevance metrics, which are necessary to have an overview of search result relevance:
 Note
NoteFor trend and metric cards, you have to select a dimension on which the metric calculation is based on. Select either Origin 1 (page/hub) or Origin 2 (tab/interface) at first to have a global overview of the search relevance of your interface/search page.
-
Review the metric value colors, and act if necessary.
The following table lists all available metrics, thresholds to determine value colors (if any), and the metrics for which a higher or lower value is better:
Metric Threshold (if any) Higher values are better Lower values are better Quality of a value depends on the context Activity

Attach to Case Count
Click Event Count
Search Event Clickthrough (%)
-
Green if > 60%
-
Black between 40-60%
-
Red if < 40%
Search Events With Clicks
Relevance Index
-
Green if > 0.7
-
Black between 0.5 to 0.7
-
Red if < 0.5
Average Click Rank
-
Green between 1 and 3
-
Black between 3 and 6
-
Red if > 6
Custom Event Count
Manual Search Event Count
Search Event Count
Refined Search Event Count
Unique User ID
Unique User IP
Unique Visitor ID
Visit Count
-
-
|
|
Notes
|
Required privileges
The following table indicates the required privileges to view and edit dashboards from the Reports (platform-ca | platform-eu | platform-au) page and associated panels (see Manage privileges and Privilege reference).
|
|
Note
Access to dashboards or part of their content may be further restricted as a function of the member (see Manage access to reports and Manage permission filters). |
| Action | Service - Domain | Required access level |
|---|---|---|
View report access configurations |
Analytics - Analytics data Analytics - Reports Organization - Organization |
View |
Edit report access configurations |
Analytics - Analytics data Organization - Organization |
View |
Analytics - Reports |
Edit |
|
Analytics - Administrate |
Allowed |