Debug tracking issues
Debug tracking issues
To confirm that data tracking is correctly implemented, verify the following items, assuming that you’re using the latest version of the Coveo UA library:
-
Open a Coveo-powered search page.
-
Open your web browser’s developer tools.
NoteThe examples in this article use the Google Chrome developer tools. For browser-specific information, see:
-
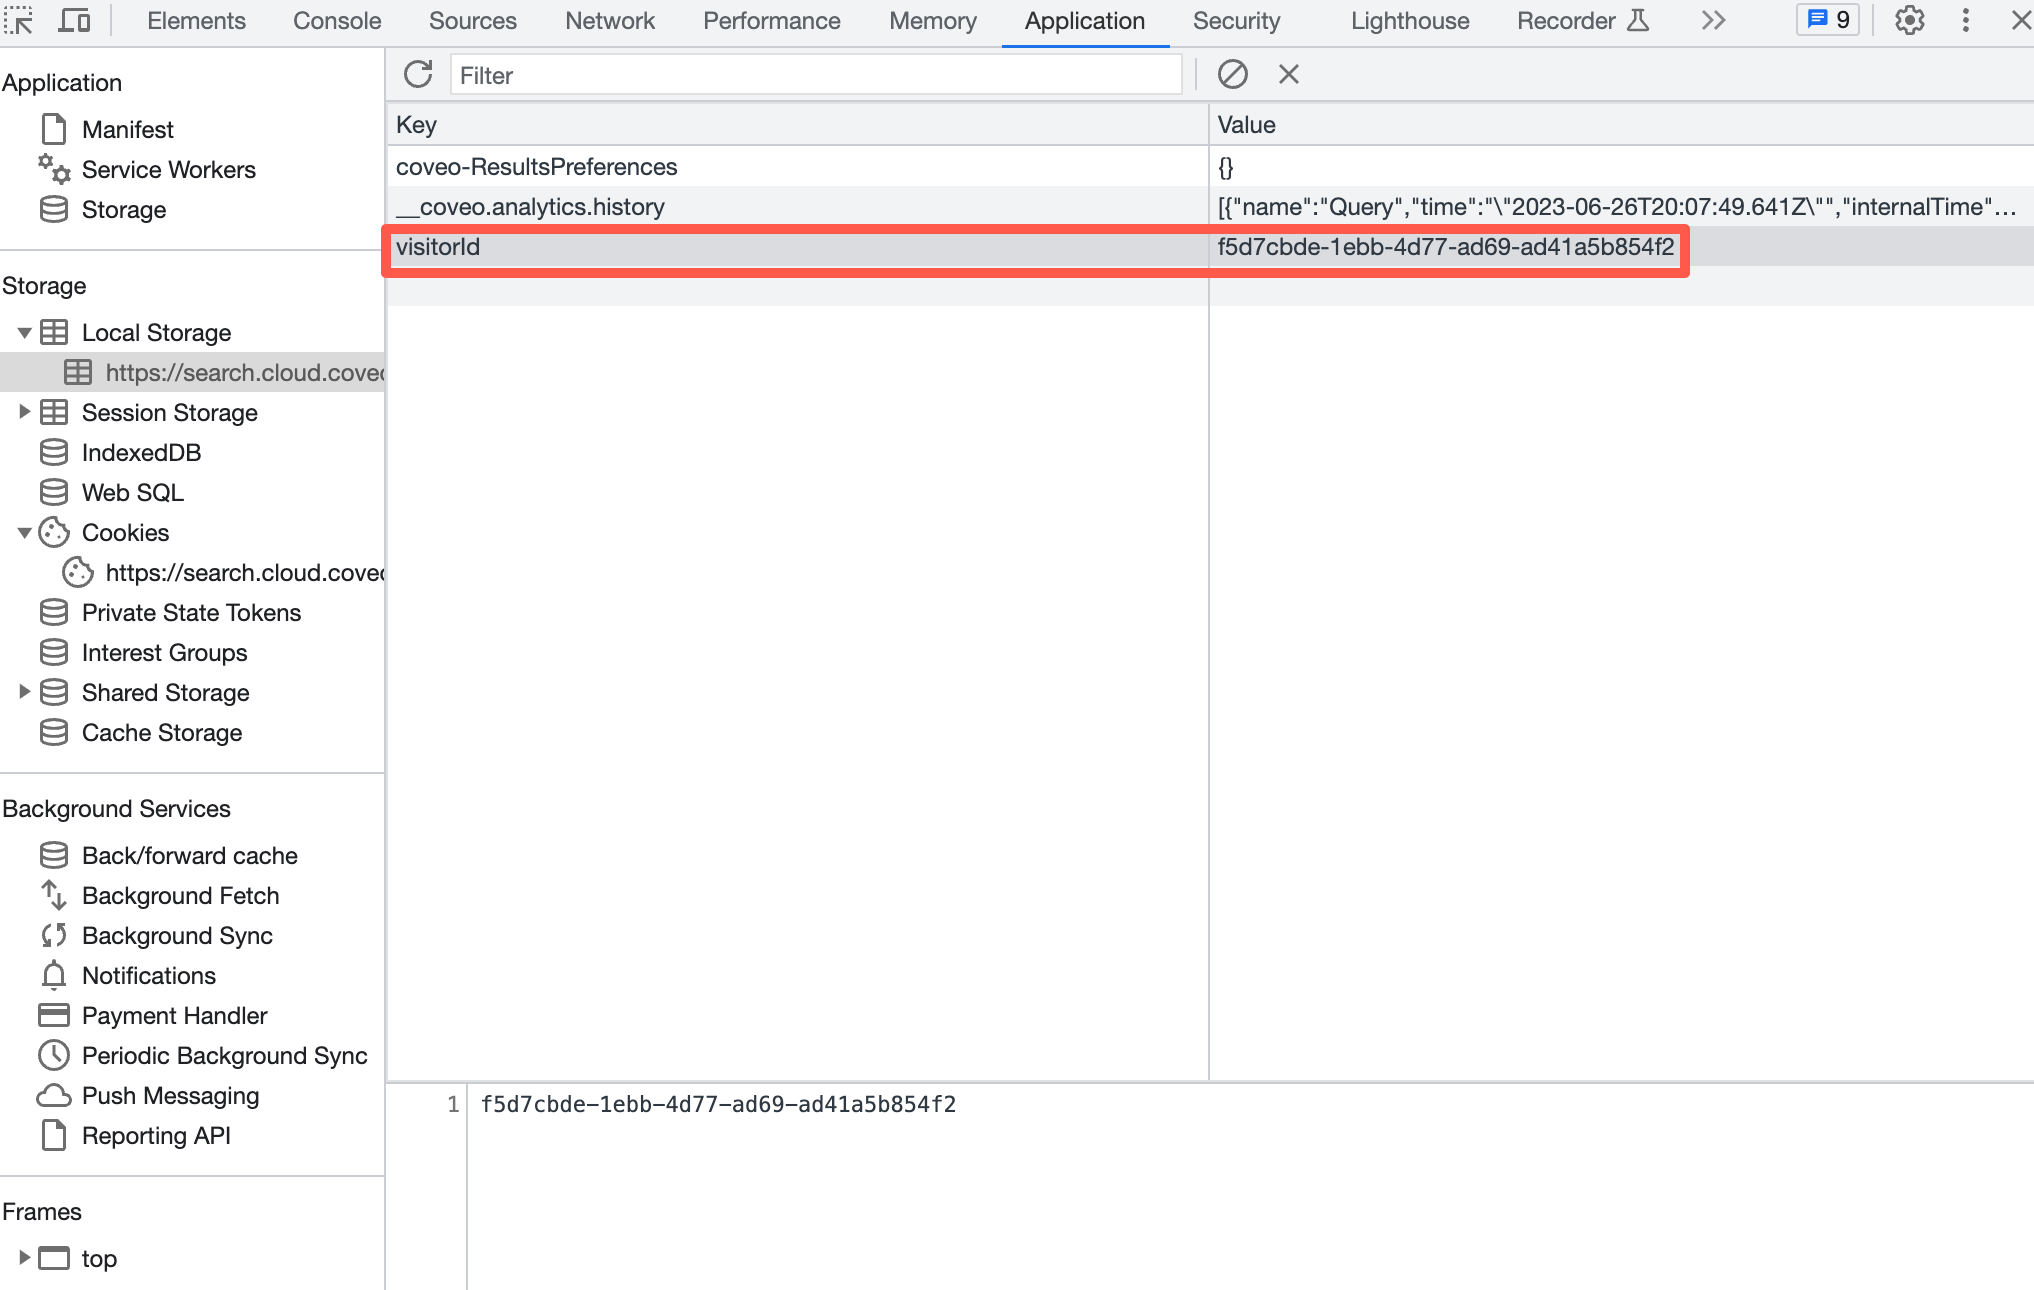
In the Application tab of your developer tools, check whether there’s an identifier in local storage with the attribute name
visitorId. Cookies and local storage are typically found under a separate tab (for example, Local Storage).For example:

-
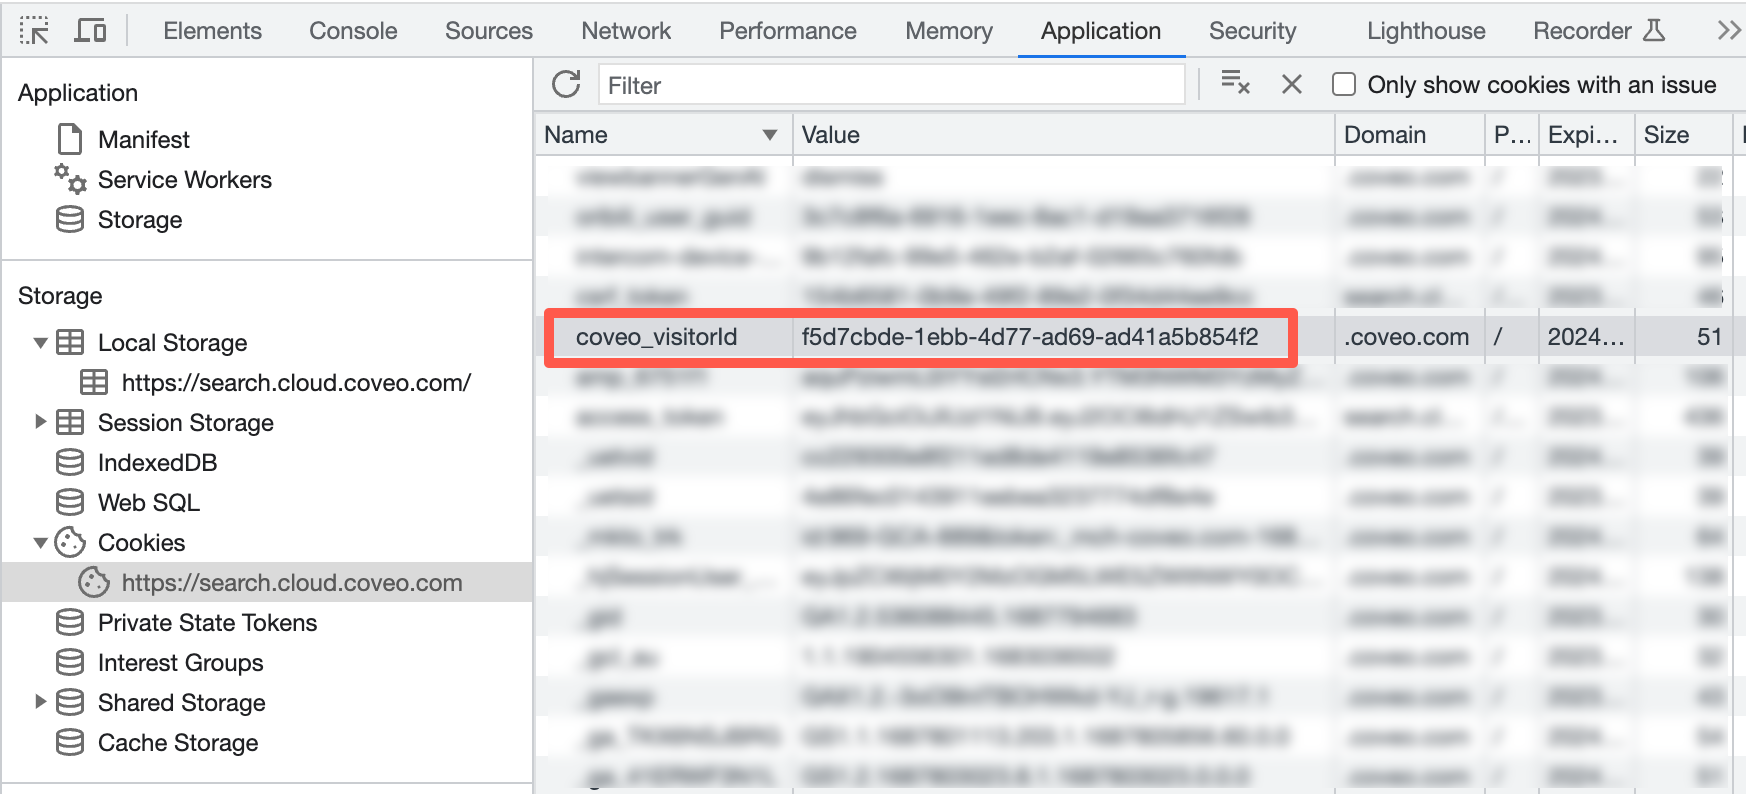
Verify that the same identifier has been stored in a local cookie with the attribute name
coveo_visitorId, and that it’s scoped to the top-level domain of the main page. In the following example, thehttps://search.cloud.coveo.comsearch page is used, therefore the top-level domain is.coveo.com. Note
NoteIf you notice that you have the visitor cookie on
analytics.cloud.coveo.com, you can ignore it. This is a legacy third-party-cookie set by Coveo Analytics.For example:

-
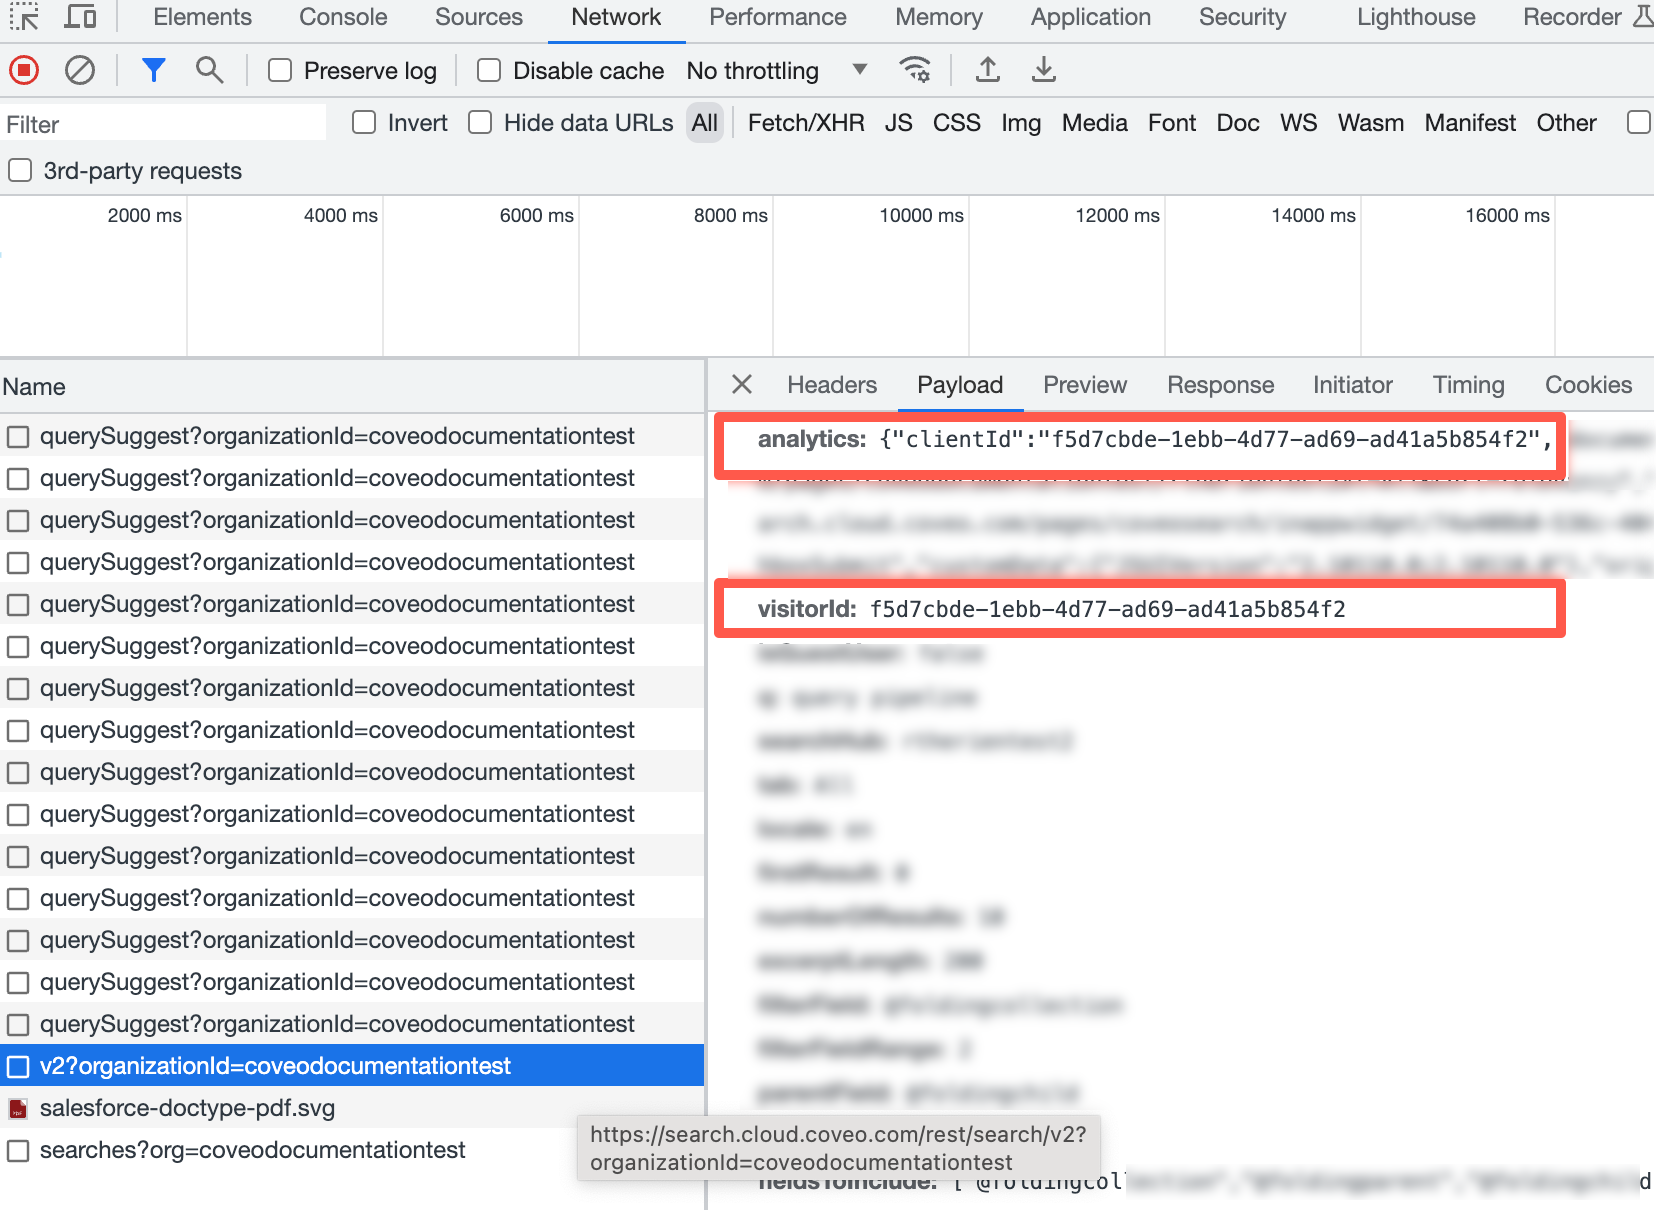
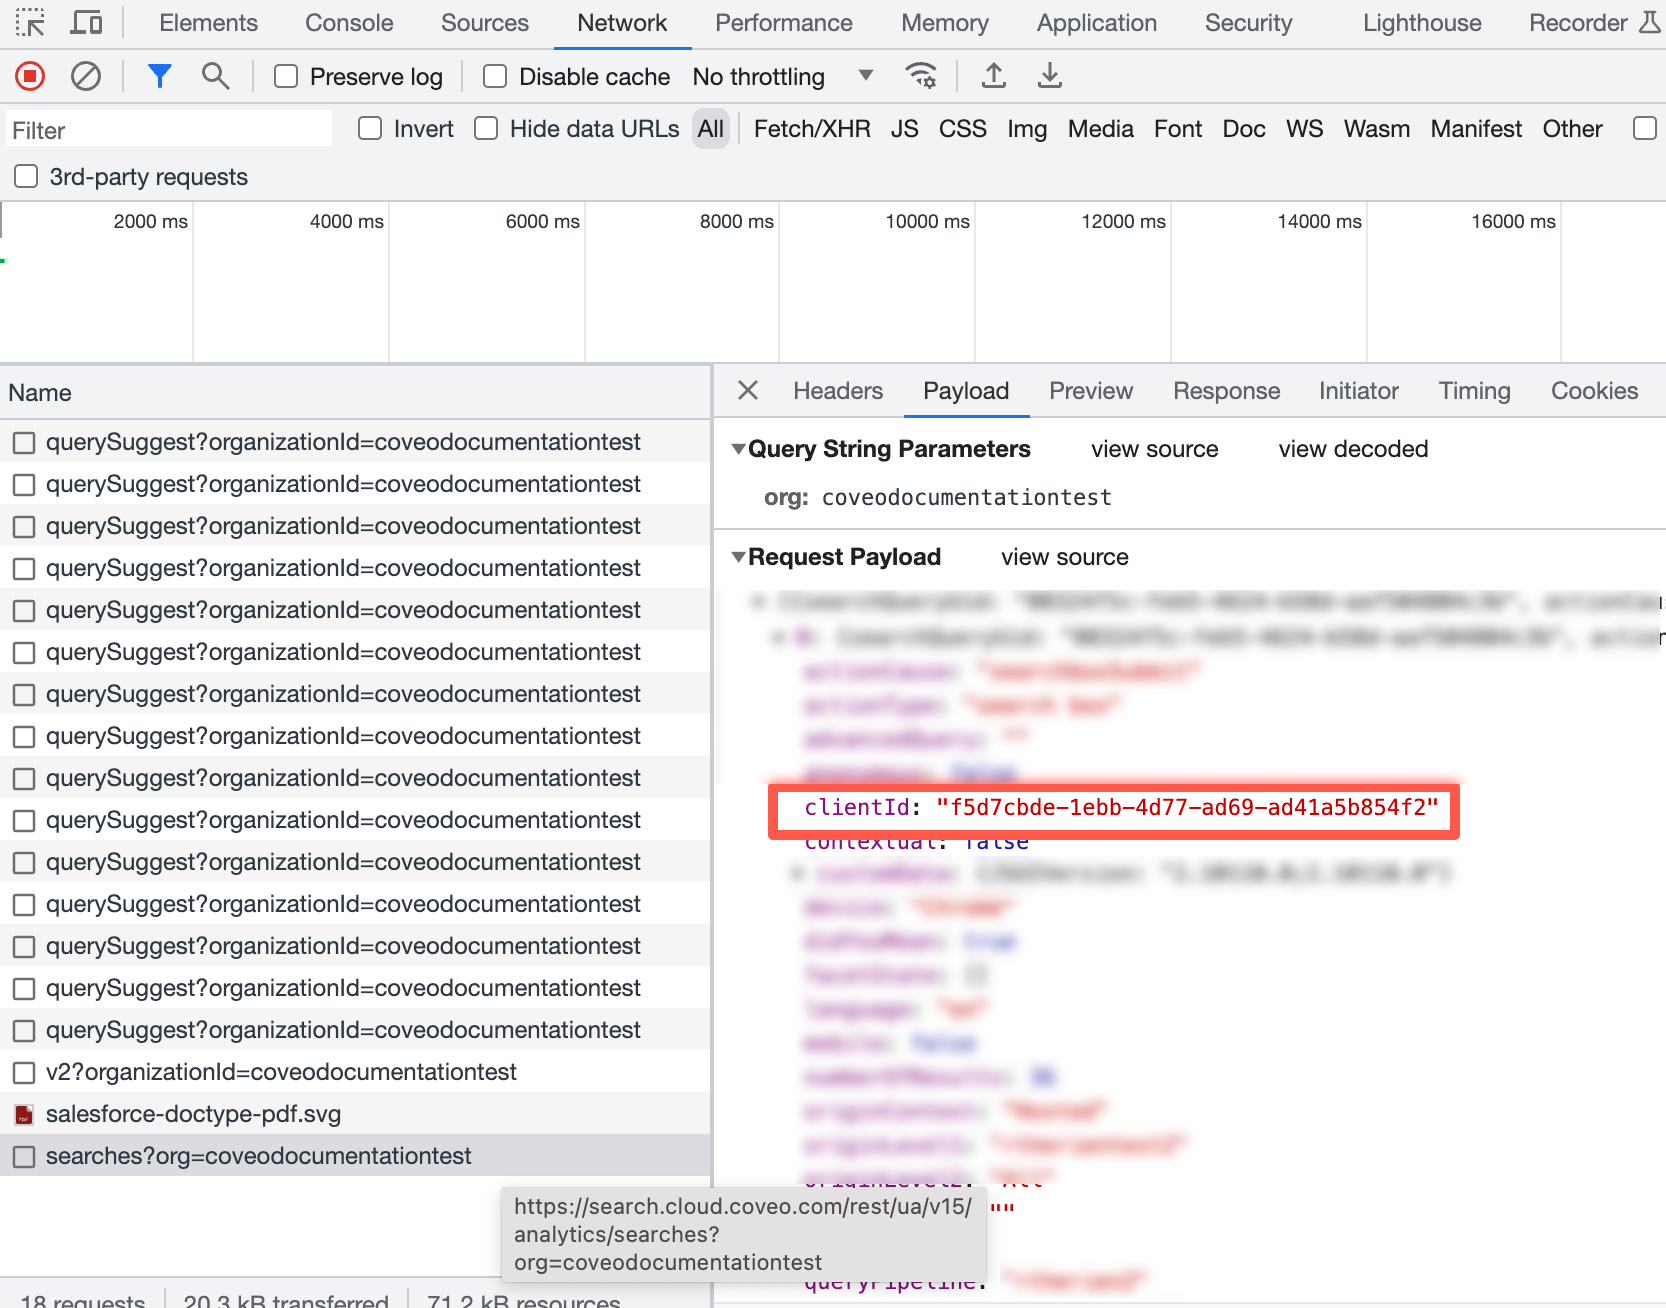
In the Network tab, verify whether this same identifier is being set on calls.
-
When inspecting calls to the search API endpoint (
rest/search/v2), the same identifier should be visible underanalytics.clientIdorvisitorId.
-
When inspecting calls to the analytics API endpoints (
rest/ua/v15/analytics), the same identifier should be visible undercidfor the collect endpoint, or undercliendIdin the payload or the URLvisitorIdparameter for other endpoints.
-