CMH Overview
CMH Overview
The Coveo Merchandising Hub (CMH) Overview page is the first page you see when you open the CMH, giving you an at-a-glance view of key performance metrics for the selected property. You can use it to review results over a chosen period or compare two periods side by side.
By default, the CMH Overview page is scoped to all merchandising solutions and shows data for the past 30 days. If your Coveo organization is new to CMH or doesn’t yet have any tracked activity, the performance metrics will appear once data becomes available.
Use the date picker to change the reporting window for the Overview page. To compare two time periods, click Compare, select two date ranges, and then review how the metrics and tables differ between them.
Performance overview
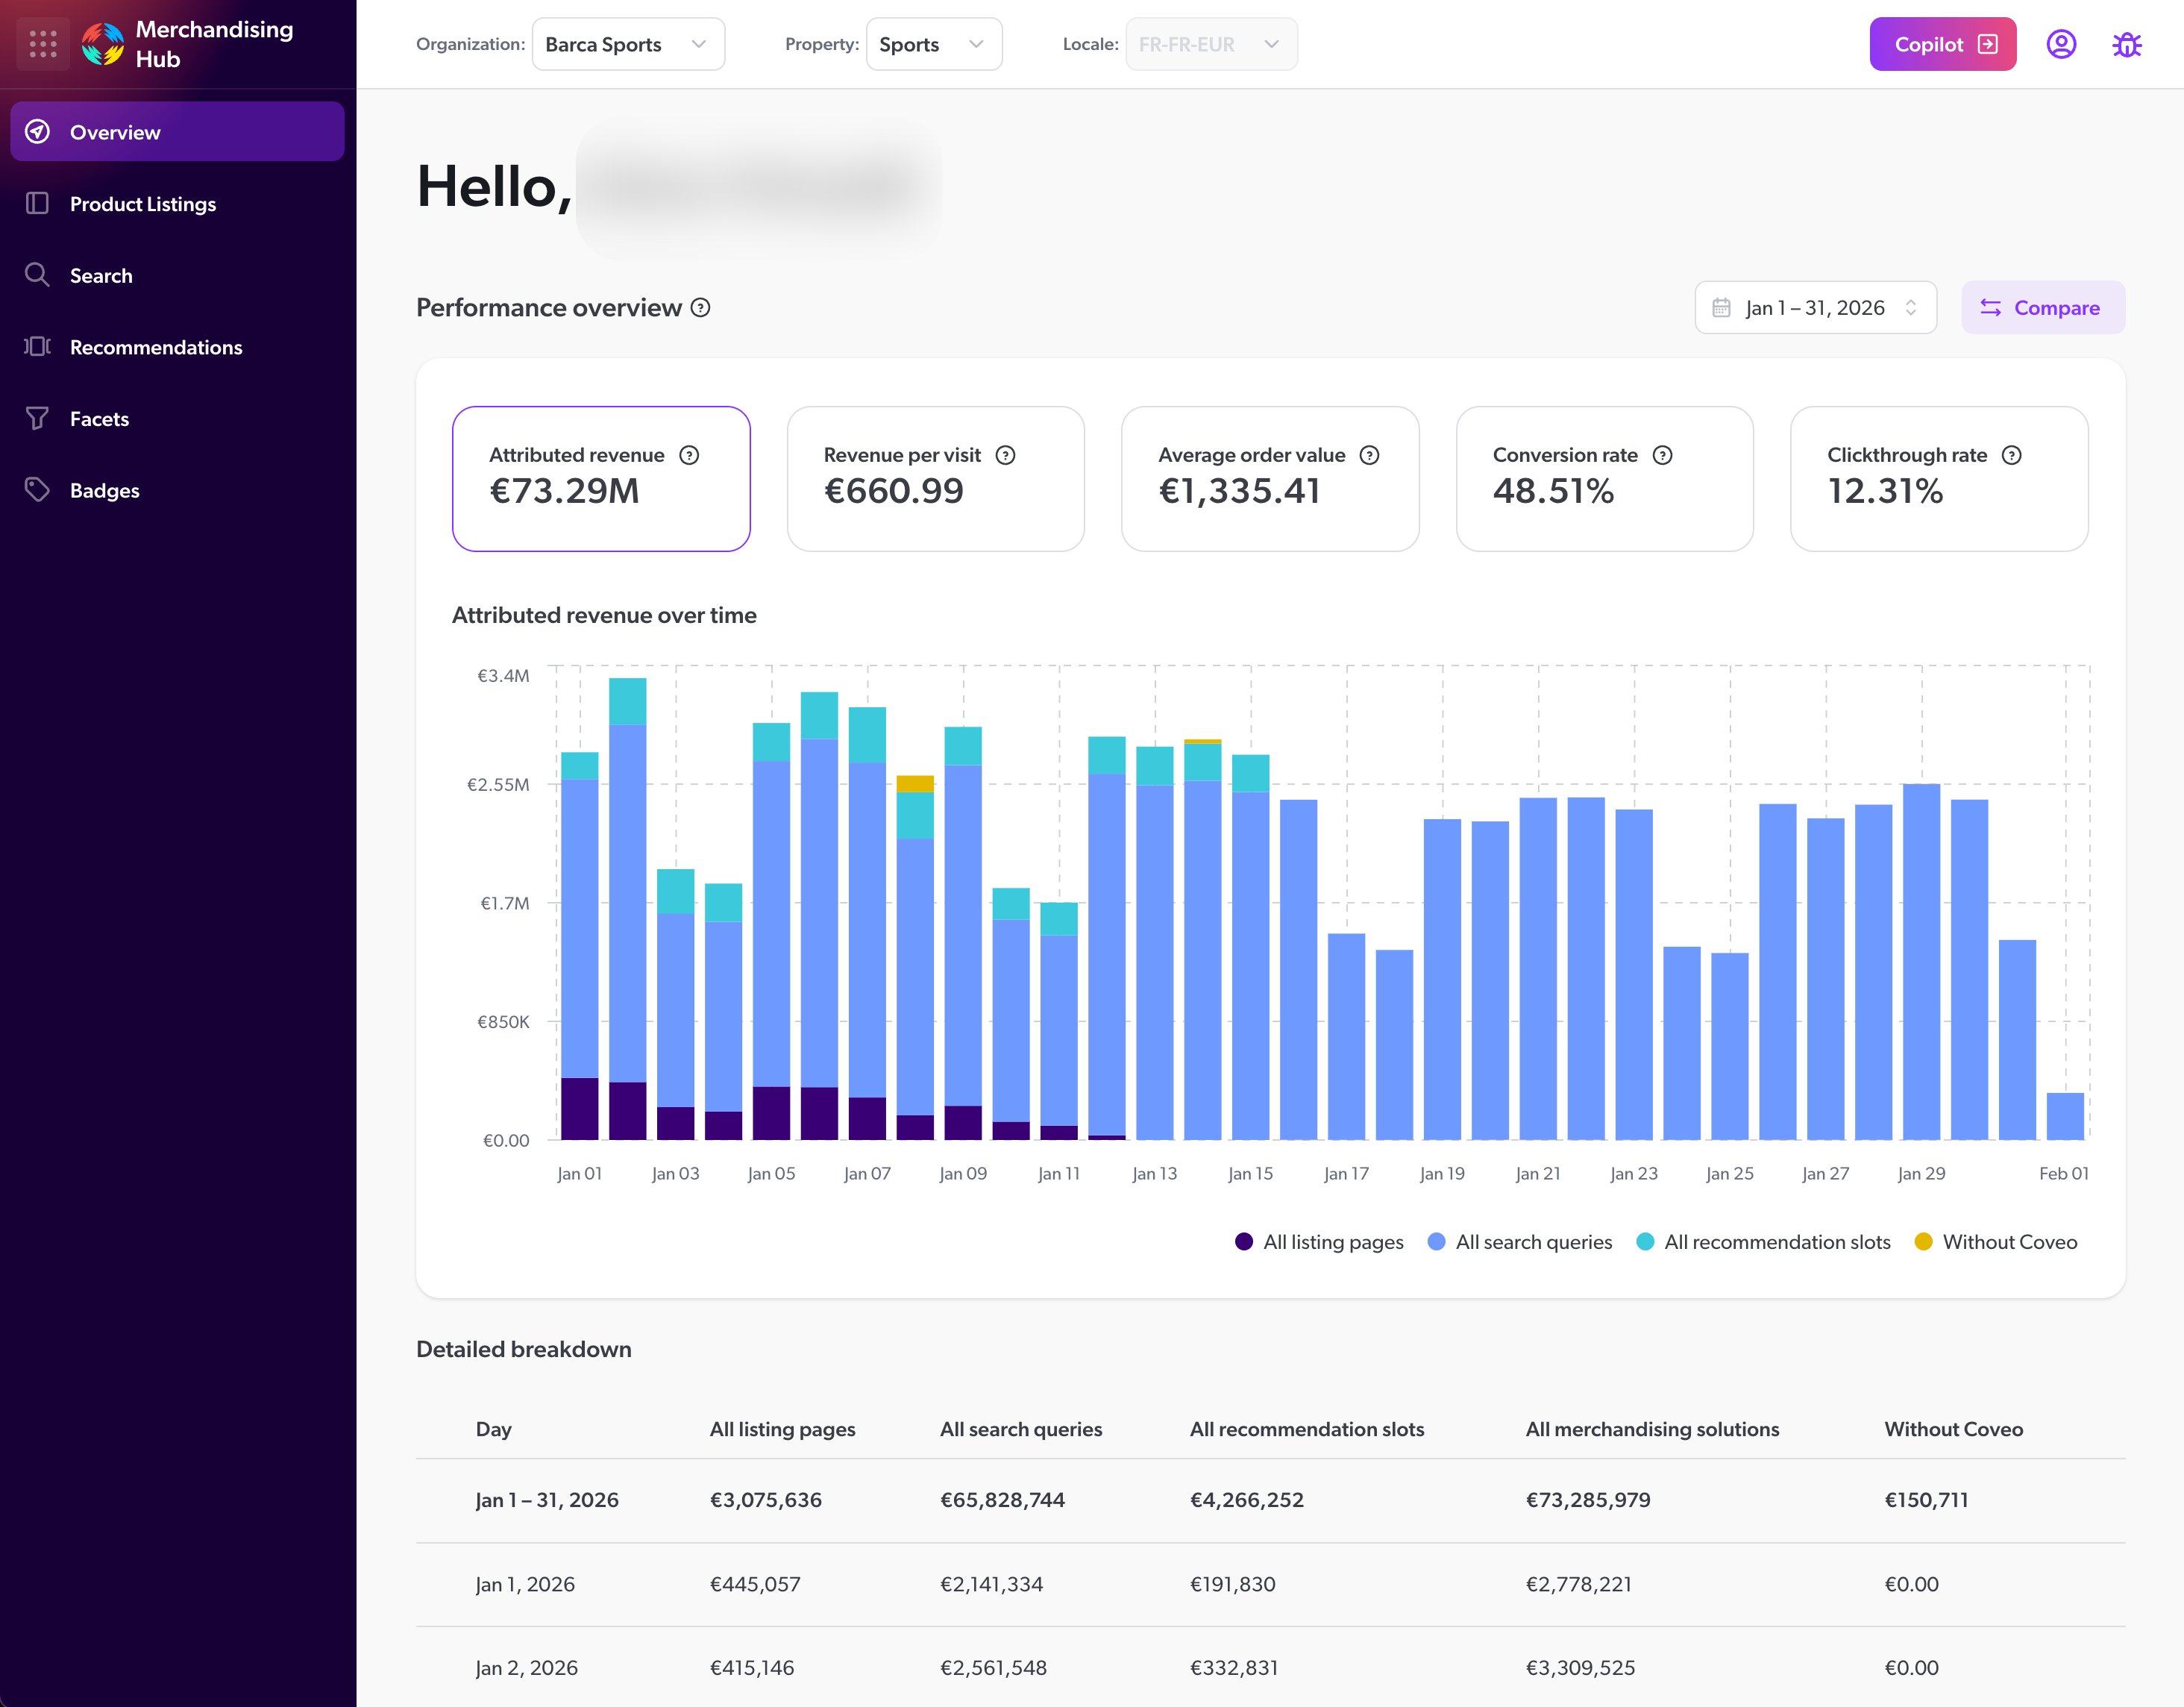
At the top of the page, the Performance overview section shows five metric cards: Attributed revenue, Revenue per visit, Average order value, Conversion rate, and Clickthrough rate. These cards are interactive. Click a metric card to focus the performance view on that metric for the selected period.
Directly under the metric cards, the trend chart shows the selected metric over the chosen date range. For example, selecting the Attributed revenue card displays the Attributed revenue over time chart. Selecting Average order value, Conversion rate, or Clickthrough rate updates the trend chart to show that metric over the same period. The chart title updates to match the selected metric.
Detailed breakdown
In the Detailed breakdown section, the first row summarizes the selected date range. Each subsequent row represents an individual day within that period, so you can review how the selected metric changes over time. The table breaks down the selected metric across different solutions (for example, All product listing pages, All search queries, All recommendation slots, and All merchandising solutions). The columns update when you click a different metric card.
Discrepancies between reports
Figures shown for metrics in Coveo Merchandising Hub (CMH) Overview reports may differ from those for the same metrics in the Reports (platform-ca | platform-eu | platform-au) page of the Coveo Administration Console. These discrepancies typically occur because different reports use distinct filters and processing rules when calculating figures for the same metric.
The most common reason is the inclusion of searchBoxAsYouType events.
By default, reports from the Reports (platform-ca | platform-eu | platform-au) page include search events where the event cause is searchBoxAsYouType.
Commerce Advanced Reports and CMH reports treat these events selectively: they include purchases and revenue from product suggestions (which affects Attributed revenue, revenue per visit, average order value, and conversion rate) but exclude the search events themselves from query counts (which affects clickthrough rate).
This selective treatment can result in discrepancies when comparing the same metrics across different report types.