New Coveo Platform features of 2015
New Coveo Platform features of 2015
This article presents the features introduced during the year 2015.
The latest features are available in New Coveo Platform features.
November 21, 2015 update
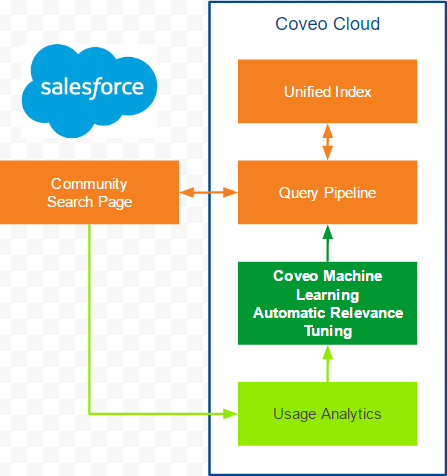
Get self-tuned search results relevance
Automatic Relevance Tuning (ART) is a feature of the new Coveo Machine Learning machine learning service. ART automatically tunes search results ranking based on usage analytics data, learning what search users seek and simply delivering it.
You can enable ART for your Coveo for Salesforce Community search page in a few clicks from the Administration Console. [Learn more]
Get more relevant query suggestions
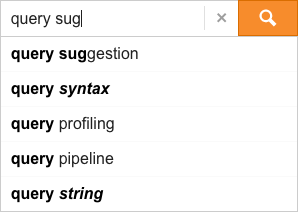
In your Salesforce Community search box, users can now get Coveo Machine Learning query suggestions that:
-
Are learned from your crowd.
-
Provide the most relevant exact, partial, or fuzzy matches in any keyword in any order.
-
Are very tolerant to typographical errors.
You can enable Coveo ML QS in a few clicks. [Learn more]
Index Jira content
Coveo organization users can now use Jira sources to add secured, shared or private content, and therefore make relevant Jira instances searchable. [Learn more]

Automated interval selection in line charts
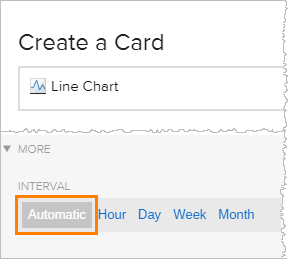
Usage analysts can select a date range to review directly in a line chart since the previous release. Line charts now automatically adapt themselves based on the selected date range (for example when a day is selected in a line chart, each point represents an hour). [Learn more]
Filter out user sessions in the Visit Browser
Usage analysts can now filter out user sessions in the Visit Browser that contain specific events they don’t want to review. For example, they may want to analyze user sessions containing a specific query, but in which no support cases were created. [Learn more]

Create global custom dimensions
Analytics managers can now create custom dimensions under which can be logged events of all types (click, search, custom event). Before this feature, they had to create three separate dimensions (one for each event type). [Learn more]
Follow user actions even when they log out from your site
Usage analysts can now take advantage of the reviewed visit ID dimension, which is now persisted when users switch from authenticated users to anonymous, or the contrary. When the user switches to a second authenticated user, a new visit ID is created. [Learn more]
More width options when resizing dashboard sections
Usage analysts can now among other things place dashboard sections side-by-side so that each fills 50% of the dashboard width. Previously, section width sizes were limited to multiples of 33%. Now, sections can have five different widths, starting at a third of the available space.
See the Coveo V1 Resolved Issues for the November 21, 2015 update.
October 3, 2015 update

Set the time zone used in the Administration Console
Administrators can now use the Settings page of the Administration Console to determine the time zone to be used across the console pages, such as in the usage analytics reports and in the Visit Browser. When the selected time zone differs from your browser’s time zone, the time zone abbreviation appears on the pages next to the selected date range (for example, PDT).
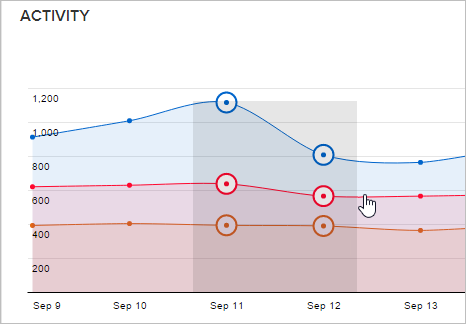
Select date range in line charts
Analytics managers can now quickly change the period to review the usage analytics data in reports by clicking and dragging the mouse over an area of any line chart. All the data shown in the report will match the selected period. This feature is particularly useful when you notice a period where there was an unexpected change for one or more metrics. [Learn more]
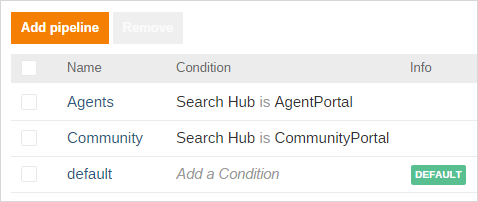
Configure query pipeline routing rules
Relevance Analysts can now centrally define query pipeline conditions in the Administration Console to easily define which pipeline applies to each query, eliminating the need to set the pipeline in the JavaScript code of each search interface. [Learn more]
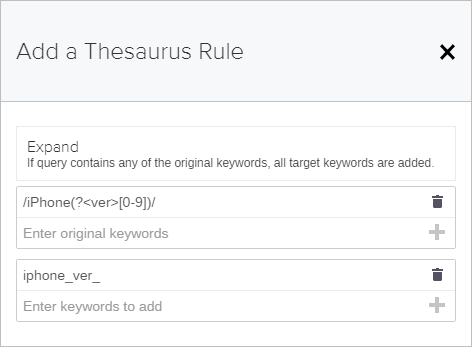
Create thesaurus regex rules
In the Administration Console, relevance analysts can now use regular expressions to define powerful query pipeline thesaurus rules, for example to expand product names. [Learn more]
Report on events moments after they happen
Before, events were available in reports 15 minutes after they were logged or after 1,000 events, whichever came first. Now, analytics managers can review events in reports less than five minutes after the events occurred.
Also, analytics managers no longer have to manually refresh the Visit Browser to get the latest visits since the Visit Browser is now updated live.
Analyze usage analytics faster
Reports that were loaded once in the last 24 hours are now available instantly to analytics managers when they don’t contain the data of the current day (which is the default setting).
Better monitoring of the platform and services
More statuses, which are automatically updated when incidents occur, are now available on the Coveo system status page. These statuses display the current availability and health of the Administration Console and other services such as the Search Analytics API.
Moreover, in the System Metrics section, new graphs show the search response time as well as the platform and usage analytics availability over time (day, week or month).
See the Coveo V1 Resolved Issues for the October 3, 2015 update.
August 15, 2015 update
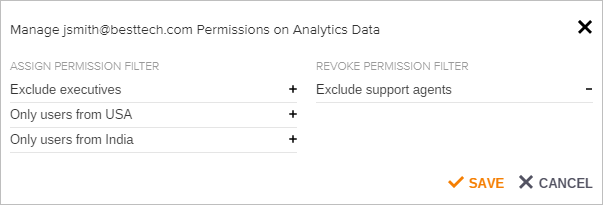
Restrict the usage analytics data analytics managers can review
Administrators can now set permissions or a scope on the usage analytics data analytics managers can review in reports using permission filters. For example, they can prevent analytics managers of a public Community Portal to see the usage analytics data produced internally on the Agent Portal and vice versa. [Learn more]
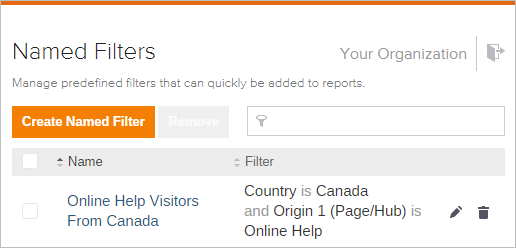
Create sets of filters
Usage analytics managers can now create many filters and save them into one named filter. Named filters can then quickly be added to any report. For example, they can create a named filter that only shows data from a specific country on a given web portal. [Learn more]
Leverage numerical dimensions
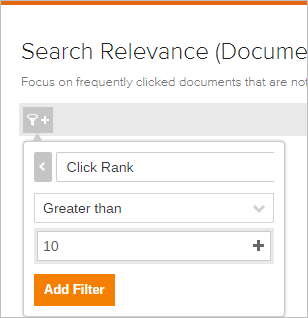
Previously, all dimension values were processed as strings, but now numerical dimension values are processed as numbers, allowing usage analysts and administrators to sort and create filters on numerical dimension (such as Click Rank) values in reports.
Import/Export dashboard configuration
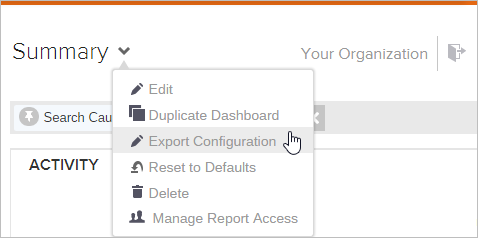
Analytics managers can now easily export a specific dashboard configuration and import it to another dashboard. Dashboard configuration appears as XML/HTML/JSON code that can quickly be copied and pasted. This feature is useful when you want to export dashboard configurations from a staging environment to production. [Learn more]
More easily see selected dimensions/metrics
In reports, the dimension/metric picker has been redesigned, allowing analytics managers to more easily view which dimensions and metrics are selected in usage analytics cards such as tables. Moreover, when adding filters the All tab (listing all available dimensions) provides the event category (click, search, custom event, all) of every dimension.
Take advantage of the calendar picker improvements
Previously, when analytics managers selected last 7 days, 31 days or 365 days, the current day was part of the date range, potentially affecting the trends among other things since today is typically not complete. Now these default date range selections contain only complete days, meaning that the current day is excluded. Moreover, the calendar picker is now placed in the upper-right section of reports and has a clearer look.
See metric percentage values as percentages
Previously, the Clickthrough metric values were shown in decimal (for example, 0.17). Now they appear as percentages (for example, 17%).
See the Coveo V1 Resolved Issues for the August 15, 2015 update.
Control access to your analytics reports
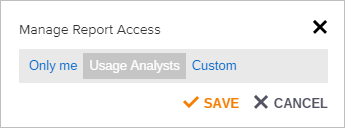
Analytics managers and administrators can now manage which Organization users see specific dashboards or explorers. This feature is useful for Organizations with many custom explorers and dashboards as each user can then see only relevant reports. [Learn more]
Test your query pipelines efficiency
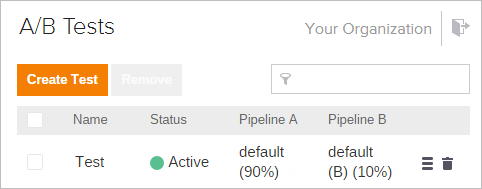
In the Coveo Administration Console, an administrator can now define one or more A/B tests for pairs of query pipelines and set the proportion of traffic sent to each pipeline. Setting up an A/B test allows to easily see the impact of query pipeline changes. [Learn more]
Copy a rule from one pipeline to another
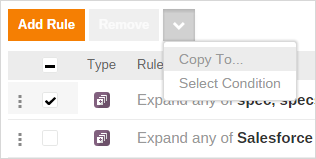
In the Coveo Administration Console, an administrator can now easily replicate one or more rules available in one query pipeline to another one using the Copy To menu item. [Learn more]
Configure your Coveo organization to use an on-premises index
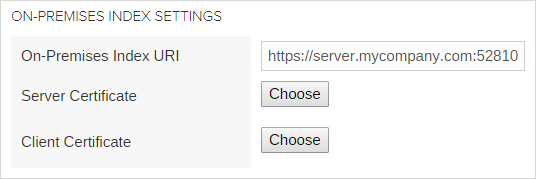
With an On-Premises license, a Coveo organization administrator can now configure the organization to securely get and return search results from an on-premises Coveo Enterprise Search (CES) index rather than from an index hosted in the cloud. In this hybrid configuration, the communication between Coveo and the CES instance is over an SSL channel protected by certificates. [Learn more]
Create a Jira Software Cloud source
Coveo organization users can now add a private or shared source to make Jira Software Cloud content searchable. [Learn more]


Create Jive and Jive Cloud sources
Coveo organization users can now use Jive and Jive Cloud sources to add secured (Jive only), shared or private content, and therefore make relevant Jive spaces and groups searchable. [Learn more]
Create SharePoint and SharePoint Online sources
Coveo organization users can now use the second generation of SharePoint and SharePoint Online sources to add private or shared SharePoint farm content in their Organization and make it searchable. [Learn more]


Configure source error notifications
Coveo organization administrators can now enable or disable notifications to be sent to specific email addresses when a source error occurs. [Learn more]
Manage stop words independently for each pipeline
The stop word configuration is now saved in the search API query pipeline rather than in the Coveo back-end index. Coveo organization administrators can therefore define different stop words for each pipeline. With the new Cloud Console Stop Words page, administrators can also associate conditions to a set of stop words to more precisely control when they’re applied. Your existing Organization stop words will be automatically migrated to the default pipeline. [Learn more]
Centrally Manage query pipeline conditions
Coveo organization administrators can now globally manage conditions available for query pipeline statements from the new Cloud Console Conditions (platform-ca | platform-eu | platform-au) page. They can define a condition once and apply it to more than one statement in more than one pipeline. [Learn more]
Identify the origin of a custom event with hub and interface dimensions
Usage analysts can now use the Hub and Interface dimensions to filter on or analyze the origin of custom events.
Report on custom events in visits without searches
Metrics such as Visit Count and Unique User ID can now count visits in which no queries were performed, enabling usage analysts to better evaluate visits that only include custom events.
Export analytics data excluding specified items
Usage analysts can now create different types of filters to precisely filter data on common events, search/click events (queries, clicks and keywords), or custom events when exporting usage analytics data. This configuration allows usage analysts to exclude some custom events without removing the click and search events that are linked to them (for example, search events that occurred during a visit containing a page view that you want to filter out).
Drag dashboard cards through sections
Usage analysts can now easily move a usage analytics card, such as a Line Chart or a Trend, from one dashboard section to another.
Take advantage of more analytics report options
Usage analysts can now:
-
Use the new A/B testing dimensions (A/B Test Name and A/B Test Version) to better analyze which query pipeline is the most effective. [Learn more]
-
Review the date selection range in the calendar picker before it’s applied to the current report.
-
Confirm the deletion of a report before it’s actually deleted.
Add regex rules in a query pipeline
Regular Expression lovers will be happy to know that they can now use REGEX to define query pipeline Thesaurus rules in the Coveo Administration Console.
More rapidly see the effect of record sharing permission changes
The Salesforce source incremental refresh can now catch new record shared permissions and therefore make these immediately effective in search results, rather than following the next full refresh.
Minor improvements
-
The organization invitation email now includes the sender name, helping to establish the email legitimacy.
-
Coveo organization administrators attempting to delete the user who performed the Salesforce integration deployment are notified of the consequences of this action.
April 18, 2015 update
Analyze metric trends
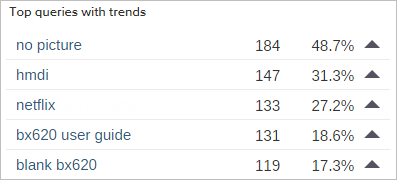
Analytics Managers can now get trends on a metric for all the values of a dimension (for example, Search Event Count by Country). You can add filters (for example, Queries from Canada), select the period to compare to (last week versus the current), and sort the trend by values, direction (up/down), or changes. [Learn more]

Index Google Drive content
Coveo organization users can now add a private or secured source for indexing Google Drive content. [Learn more]
Index website content using the sitemap
Coveo organization users can now use a Sitemap source to add shared or private sources to make relevant web pages searchable. [Learn more]

Gmail source supports OAuth2
Coveo organization users can now authorize the Coveo organization to read their Gmail account using OAuth2, a protocol that authorizes access without giving their password. [Learn more]
Index Chatter feed content
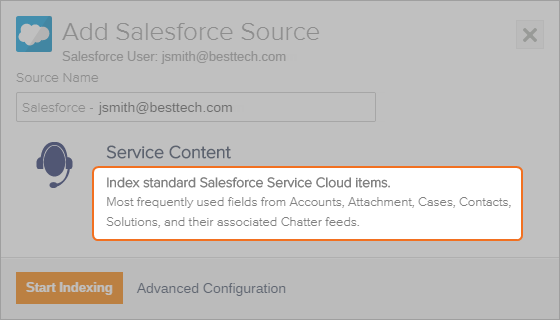
The Salesforce source now indexes Chatter feed objects by default.
Set a password policy
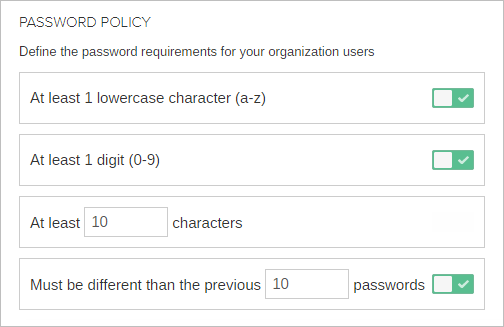
Coveo organization owners can now define password requirements for their Organization users such as the password expiration frequency and minimal number of characters. Owners can also decide to reinitialize all passwords. [Learn more]
Take advantage of the pie chart and bar chart cards
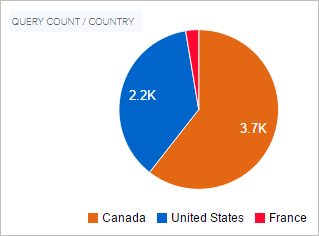
Analytics Managers can now create pie charts and bar charts in dashboards to better visualize dimensions values. You can add filters, filter your dashboard by clicking a pie chart/histogram value, and customize the look of these widgets. [Learn more]
March 7, 2015 update

Promote results
Relevance Analysts can now define which items are going to appear first in the search results list. [Learn more]
This feature is being progressively rolled out to all customers. Contact Coveo Support to request priority activation.
Fine-tune ranking of items
Relevance Analysts can now modify the ranking score of search results matching a query expression. [Learn more]
This feature is being progressively rolled out to all customers. Contact Coveo Support to request priority activation.

Add more context to your thesaurus
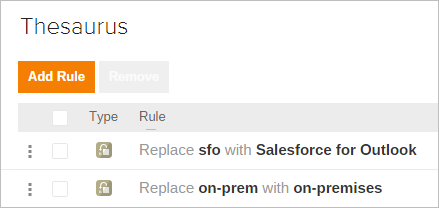
Relevance Analysts have now access to the new and greatly improved Thesaurus that can replace the current Thesaurus included in the Administration Console. [Learn more]
This feature is being progressively rolled out to all customers. Contact Coveo Support to request priority activation.
Index YouTube content
Coveo organization users can now add shared sources to bring relevant YouTube content into their Organization. [Learn more]

Quickly select the content to be displayed in your data tables
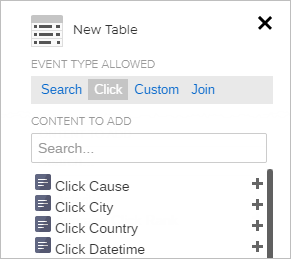
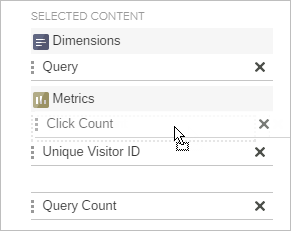
Dimensions and metrics are now grouped by event type, facilitating their selection when creating a data table.
Easily change the order of dimensions & metrics columns in analytics tables
Analytics Managers can now change the column order in data tables by a simple drag and drop operation. Custom explorers and dashboards save the status of the column order.
Security update
To increase security, Coveo provides encryption of customer data at rest. Keys are stored in a highly secured facility, inaccessible by Coveo itself and rotated yearly. Moreover, Coveo now has a comprehensive disaster recovery plan. This plan was successfully tested during a drill imitating a real-life scenario.
Search all items within the Content Browser
Using the Content Browser, Coveo organization administrators can now view all the content of their Organization index thanks to the full access mode.[Learn more]
Better support of source security models
Coveo now provides a better integration between cloud and on-premises security permissions models. System administrators are allowed to directly use, for example, Salesforce specific user identity when querying the index instead of an email security based identity.
End of support notice
-
The Administration Console no longer works with Internet Explorer 9. Coveo organization administrators running Coveo on this web browser must use a more recent version of Internet Explorer or another supported web browser (see Supported Browsers - Coveo V1 Administration Console).
-
As stated in the December 6th release notification, data pushed to the
custom_metadata_xare now ignored.
Contact Coveo Support if you have any questions or concerns regarding this notice.
See the Coveo V1 Resolved Issues for the March 7, 2015 update.
February 8, 2015 update
More customizable options in explorers
Analytics managers have now more flexibility when customizing explorers. They can, among other things, determine a different landing page when clicking a table header versus on table values, add a title to graph charts, and navigate quickly through table results using the pager.
Easily know which metric values need your attention
Coveo organization administrators can now quickly distinguish good relevance metric values from bad ones by their color. [Learn more]
January 17, 2015 update
Search and browse user visits
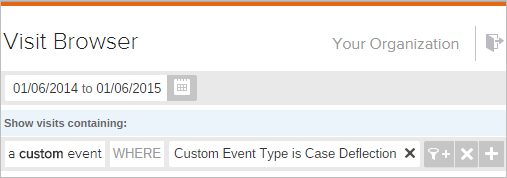
Coveo organization administrators can now browse user visits and analyze what happened in a sequence of events. For example, after grouping the results by visits, the Visit Browser lets you search all visits in which a Case Deflection occurred. [Learn more]
Redesigned Administration Console menu
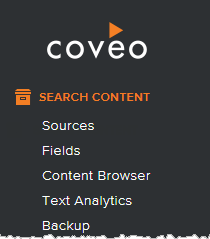
Coveo organization administrators can now reach the desired page in fewer clicks. The Administration Console menu, which is now searchable, has also a new improved look and regroups related pages under the same folder.
Customize Salesforce content
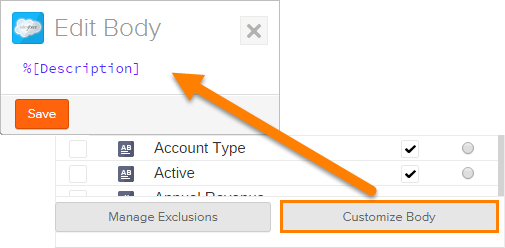
Coveo organization administrators can now customize the body of a Salesforce object directly in the source configuration panel. [Learn more]
Index Confluence content
Coveo organization users can now add shared sources to bring relevant Atlassian Confluence content into their Organization. [Learn more]

New role with read-only access to usage analytics reports
A Coveo organization administrator can now grant the new Analytics Viewer and Analytics Manager roles to more precisely control which users have respectively read-only and write access to usage analytics reports.
Configure clickable landing pages in report tables
Coveo organization analytics manager can now configure the landing page to make tables clickable in reports. They can determine where clicking table titles and values will redirect. The links can even redirect to an existing report, adding the value as a filter. [Learn more]
Your usage analytics database is now encrypted
To increase security, Coveo provides encrypted storage of your usage analytics, index content and other related content.