Relevance Inspector
Relevance Inspector
The Relevance Inspector (platform-ca | platform-eu | platform-au) (RI) is a tool that allows members of the Administrators built-in group to assess and troubleshoot the relevance of the search results returned for a specific query.
More specifically, it lets users inspect:
-
The query parameters applied to a query before it reaches the query pipeline.
-
The query pipeline in which the query was routed.
-
The query pipeline rules that affected the query.
-
The query parameters applied to the query after it went through the query pipeline.
-
The search results that were returned for the query, along with their respective fields, field values, and ranking scores.
To use RI, you must first find the unique identifier associated to the query you want to inspect. See Find the unique identifier for instructions on how to find this value.
|
|
Note
The Relevance Inspector can replay queries that are up to seven days old. |
Find the unique identifier
When accessing the Relevance Inspector (platform-ca | platform-eu | platform-au) page from the Coveo Administration Console, you must use the query’s unique identifier to access the information available for this specific query.
The unique identifier differs based on whether queries target the Search API or the Commerce API:
-
For queries targeting the Search API, the unique identifier is called
searchUid. -
For queries targeting the Commerce API, the unique identifier is called
responseId.
|
|
Note
The Relevance Inspector currently doesn’t support queries targeting the Passage Retrieval API (PR API). |
Find the query’s searchUid
If the query you want to inspect was performed in a search interface that targets the Search API, you must find the searchUid associated with this query.
-
Open the search interface in which you want to inspect how the query would behave.
-
Open your web browser’s developer tools.
NoteThe examples in this article use the Google Chrome developer tools. For browser-specific information, see:
-
Select the Network tab.
-
In the search box of the search interface, perform the desired query.
-
Back in the developer tools window, under the Name column, click the latest request to the Search API. The request path should contain
v2. -
Find the
searchUidproperty, and then copy the value.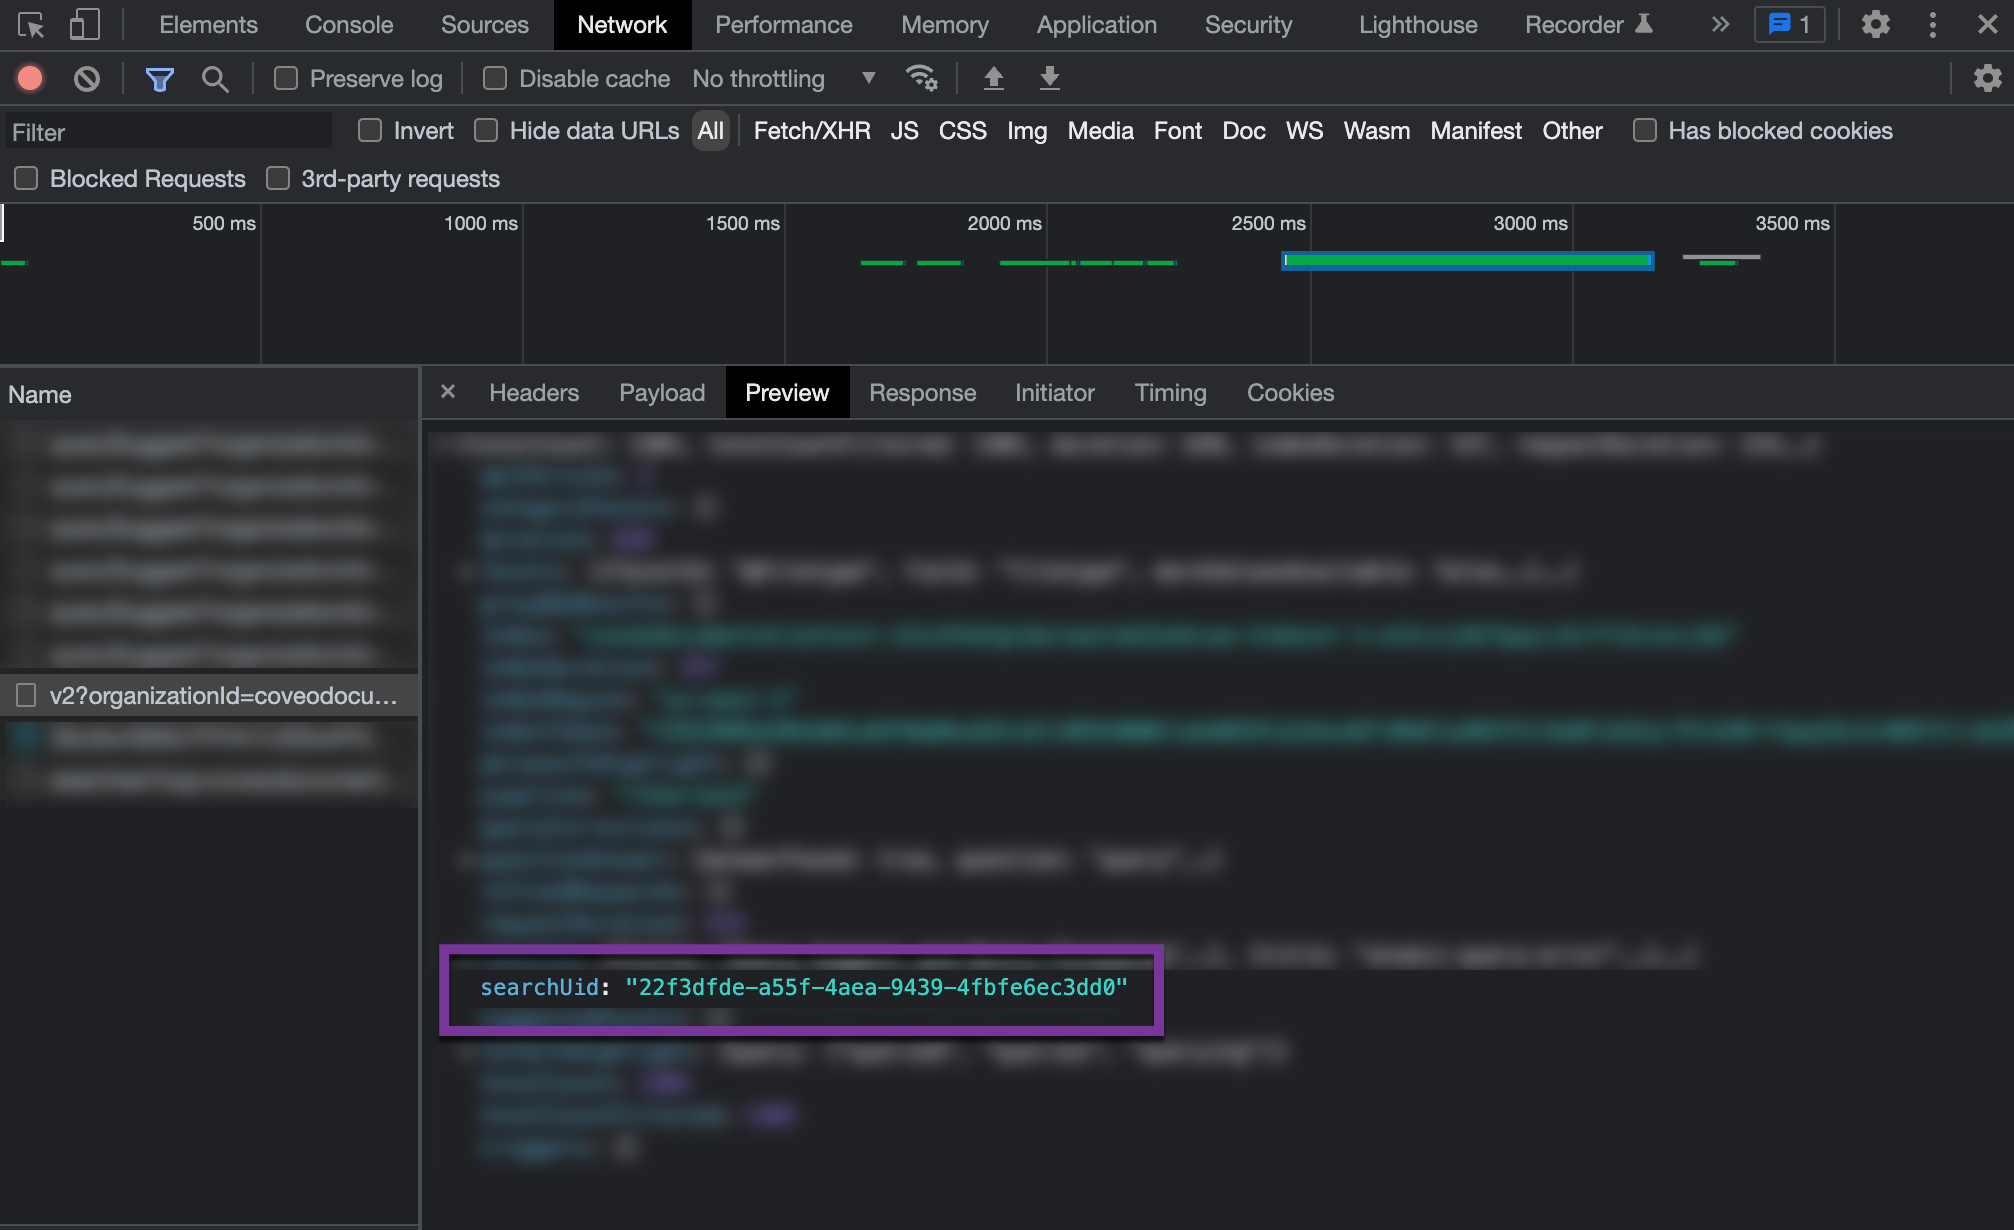
Find the query’s responseId
If the query you want to inspect was performed in a search interface that targets the Commerce API, you must find the responseId associated with this query.
-
Open the search interface in which you want to inspect how the query would behave.
-
Open your web browser’s developer tools.
NoteThe examples in this article use the Google Chrome developer tools. For browser-specific information, see:
-
Select the Network tab.
-
In the search box of the search interface, perform the desired query.
-
In the developer tools window, under the Name column, click the latest request to the Commerce API. The request path should contain
commerce. -
In the Preview tab, find the
responseIdproperty, and then copy the value.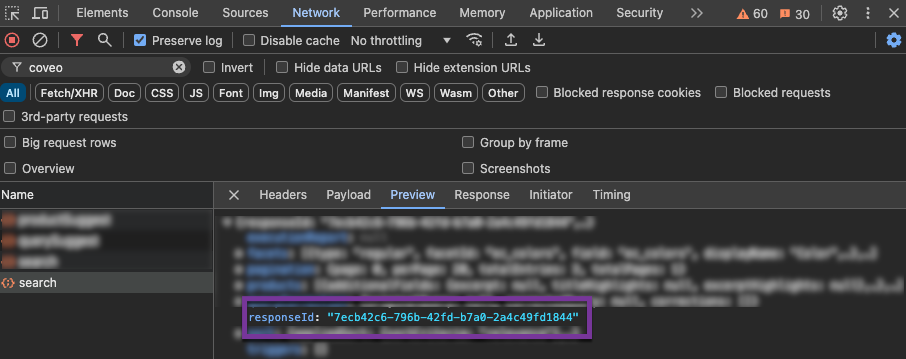
Use the Relevance Inspector
-
Access the Relevance Inspector (platform-ca | platform-eu | platform-au) page of the Coveo Administration Console.
-
Under Type a Search UID, enter the
searchUidorresponseIdof the query to inspect, and then click Inspect.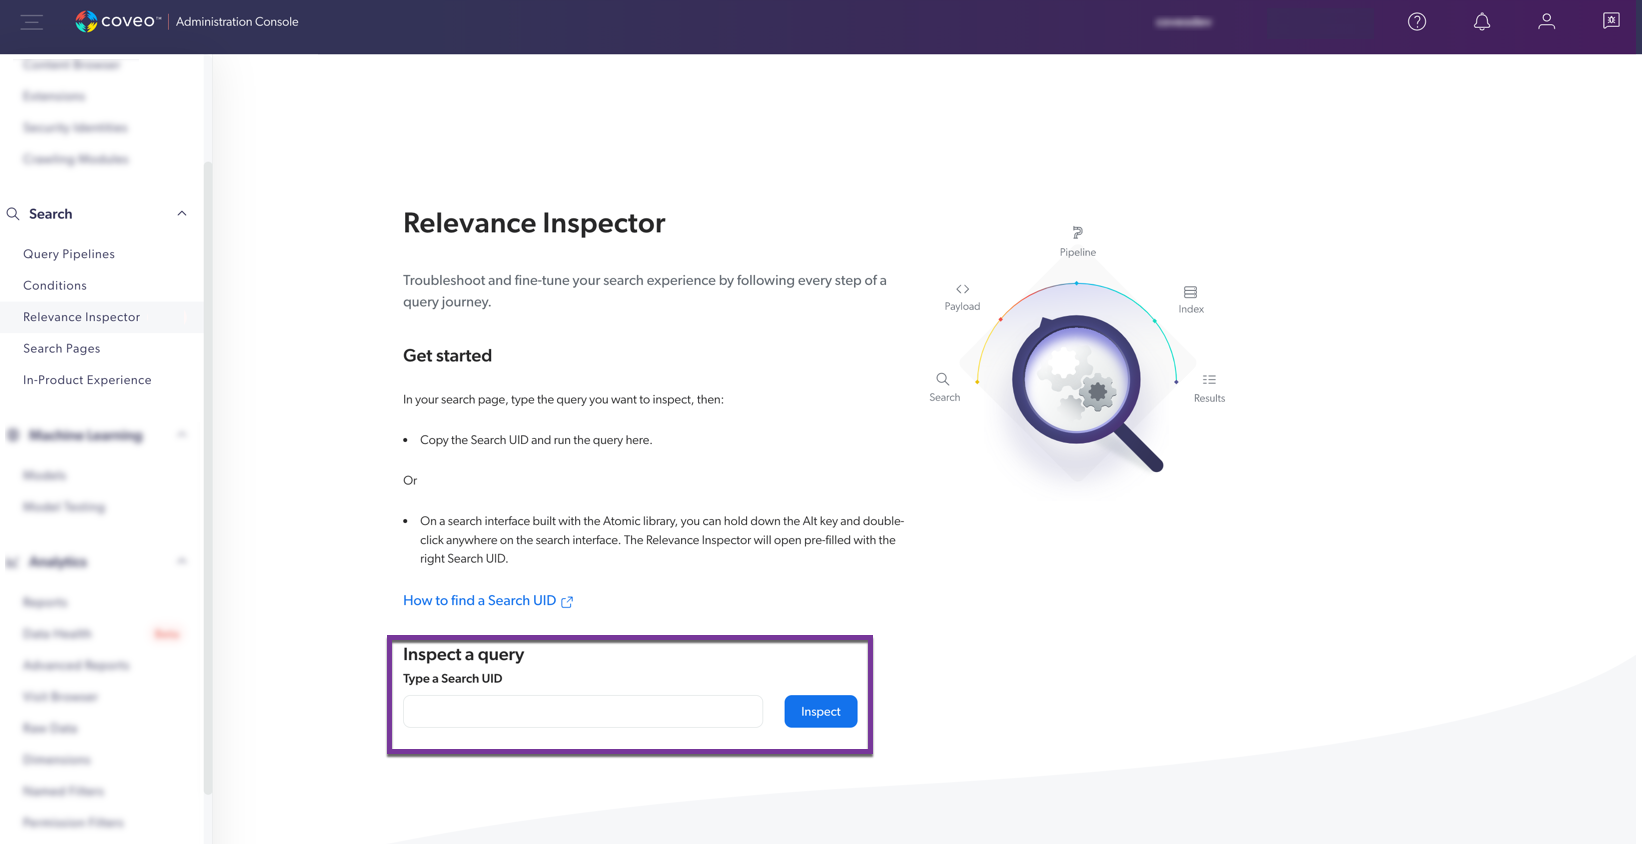 Note
NoteThere may be a delay before the query is available for inspection.
-
Under Query journey, the page now shows the following expandable sections. They correspond to the different steps of the query execution:
-
Inspect the information to troubleshoot the query.
|
|
Note
In search interfaces built with the Coveo Atomic library, you can access RI directly from the search interface. To inspect a query from an Atomic search interface
The query will open in the Relevance Inspector (platform-ca | platform-eu | platform-au) page of the Coveo Administration Console. Note that this option isn’t available on search interfaces built with the Coveo JavaScript Search Framework. |
Results returned
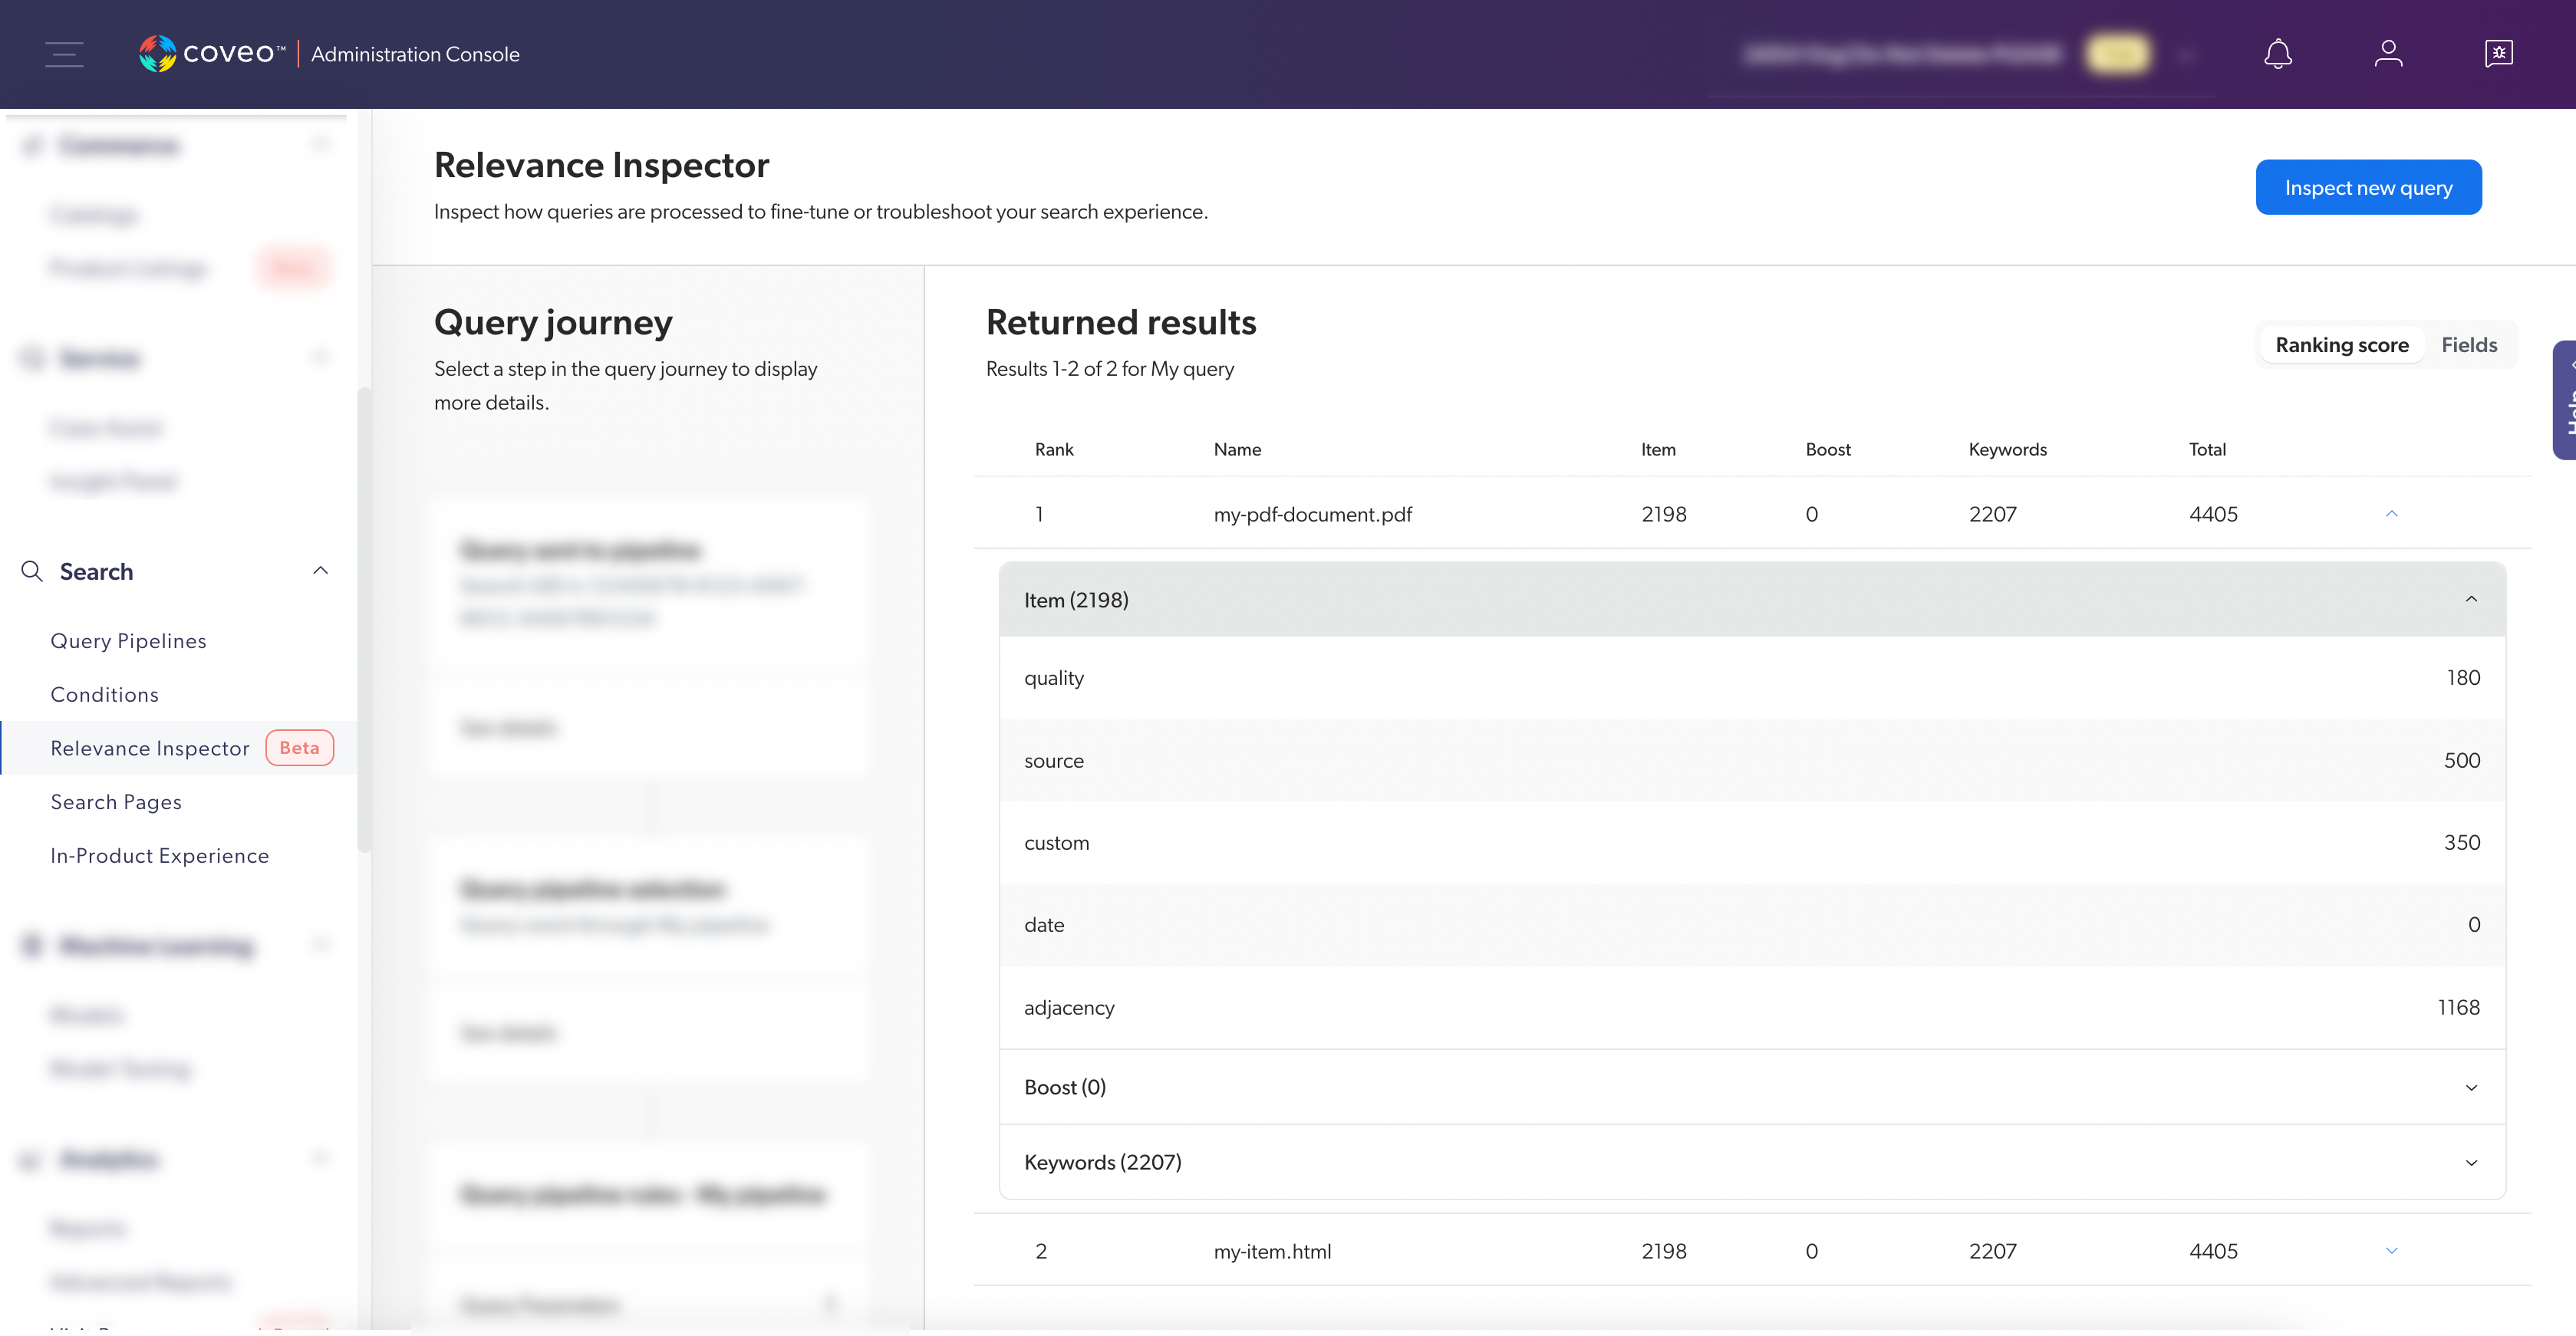
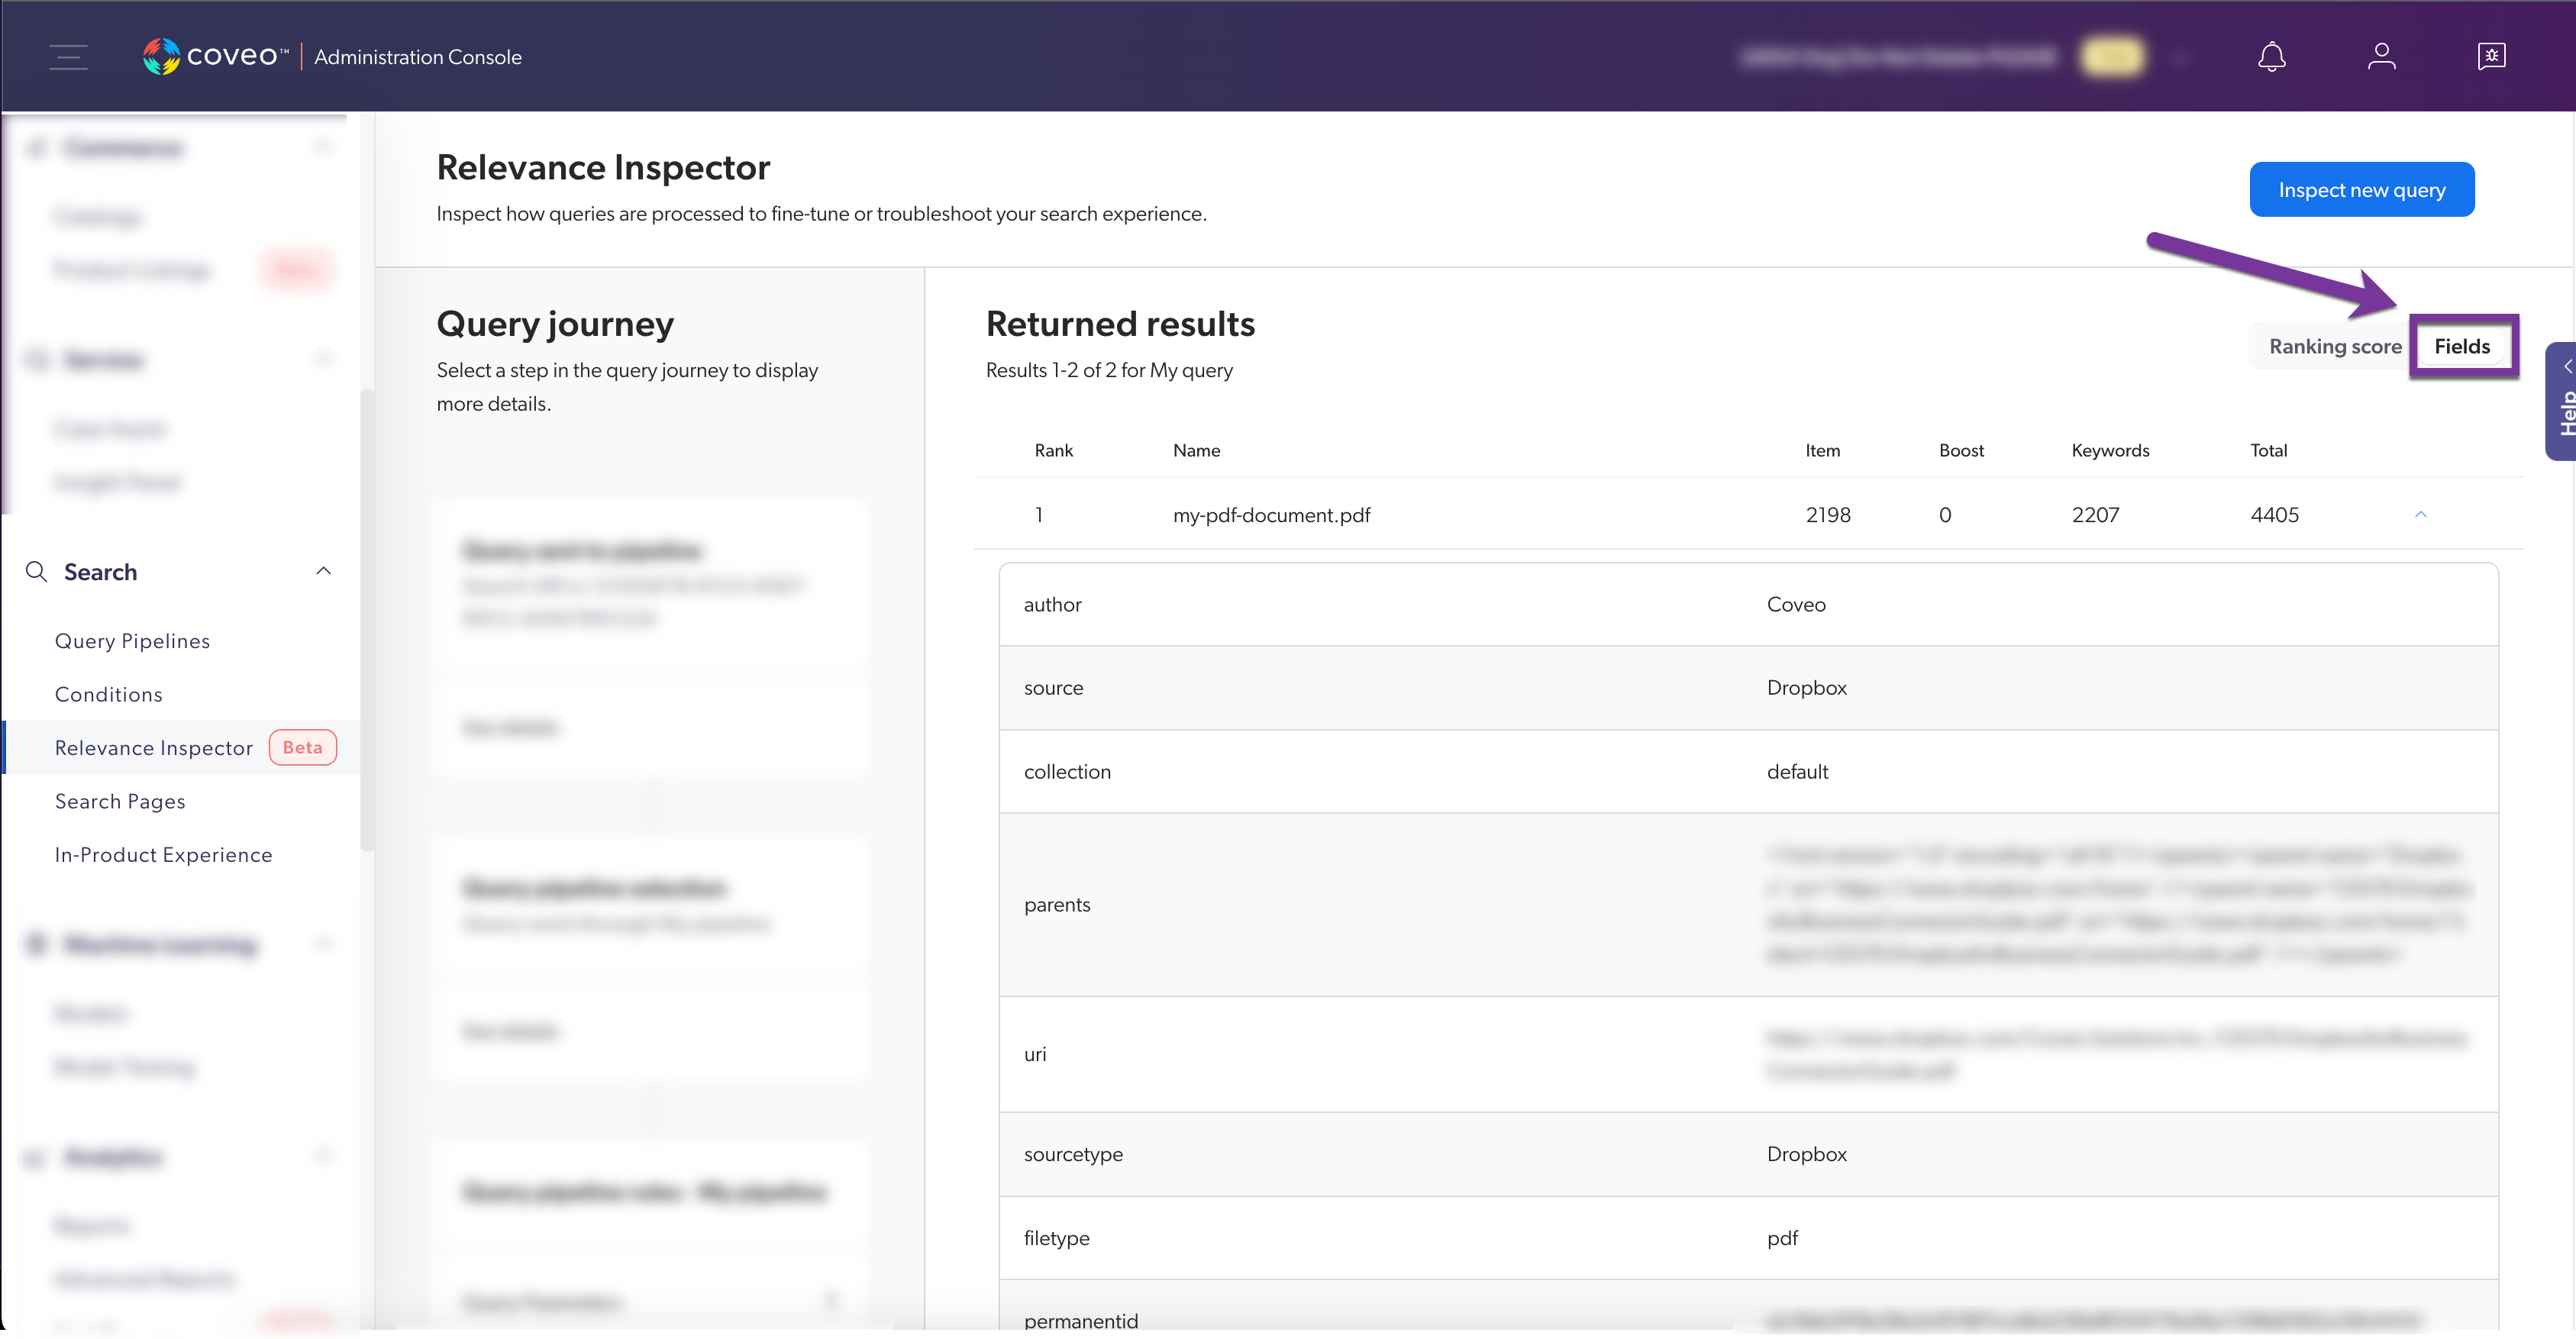
This section shows the result items that the query returned, as shown in the search interface where the query was performed.
The table shows the score that was attributed by each ranking factor of the index.
You can also expand a given search result to get more information about ranking scores attributed by Coveo Machine Learning (Coveo ML) models or query ranking expressions (QREs).
|
|
Note
When using RI, the original user query is replayed. However, the results may vary because RI considers the current indexed items, pipeline configuration, and user permissions of the person replaying the query. Therefore, if there are any differences in the indexed items, pipeline configuration, or user permissions between the person using RI and the original user who executed the query, RI may display different results compared to what the original user obtained. |
Fields
In the Returned results section, you can select the Fields tab to get information about the fields and field values available for each returned result item.
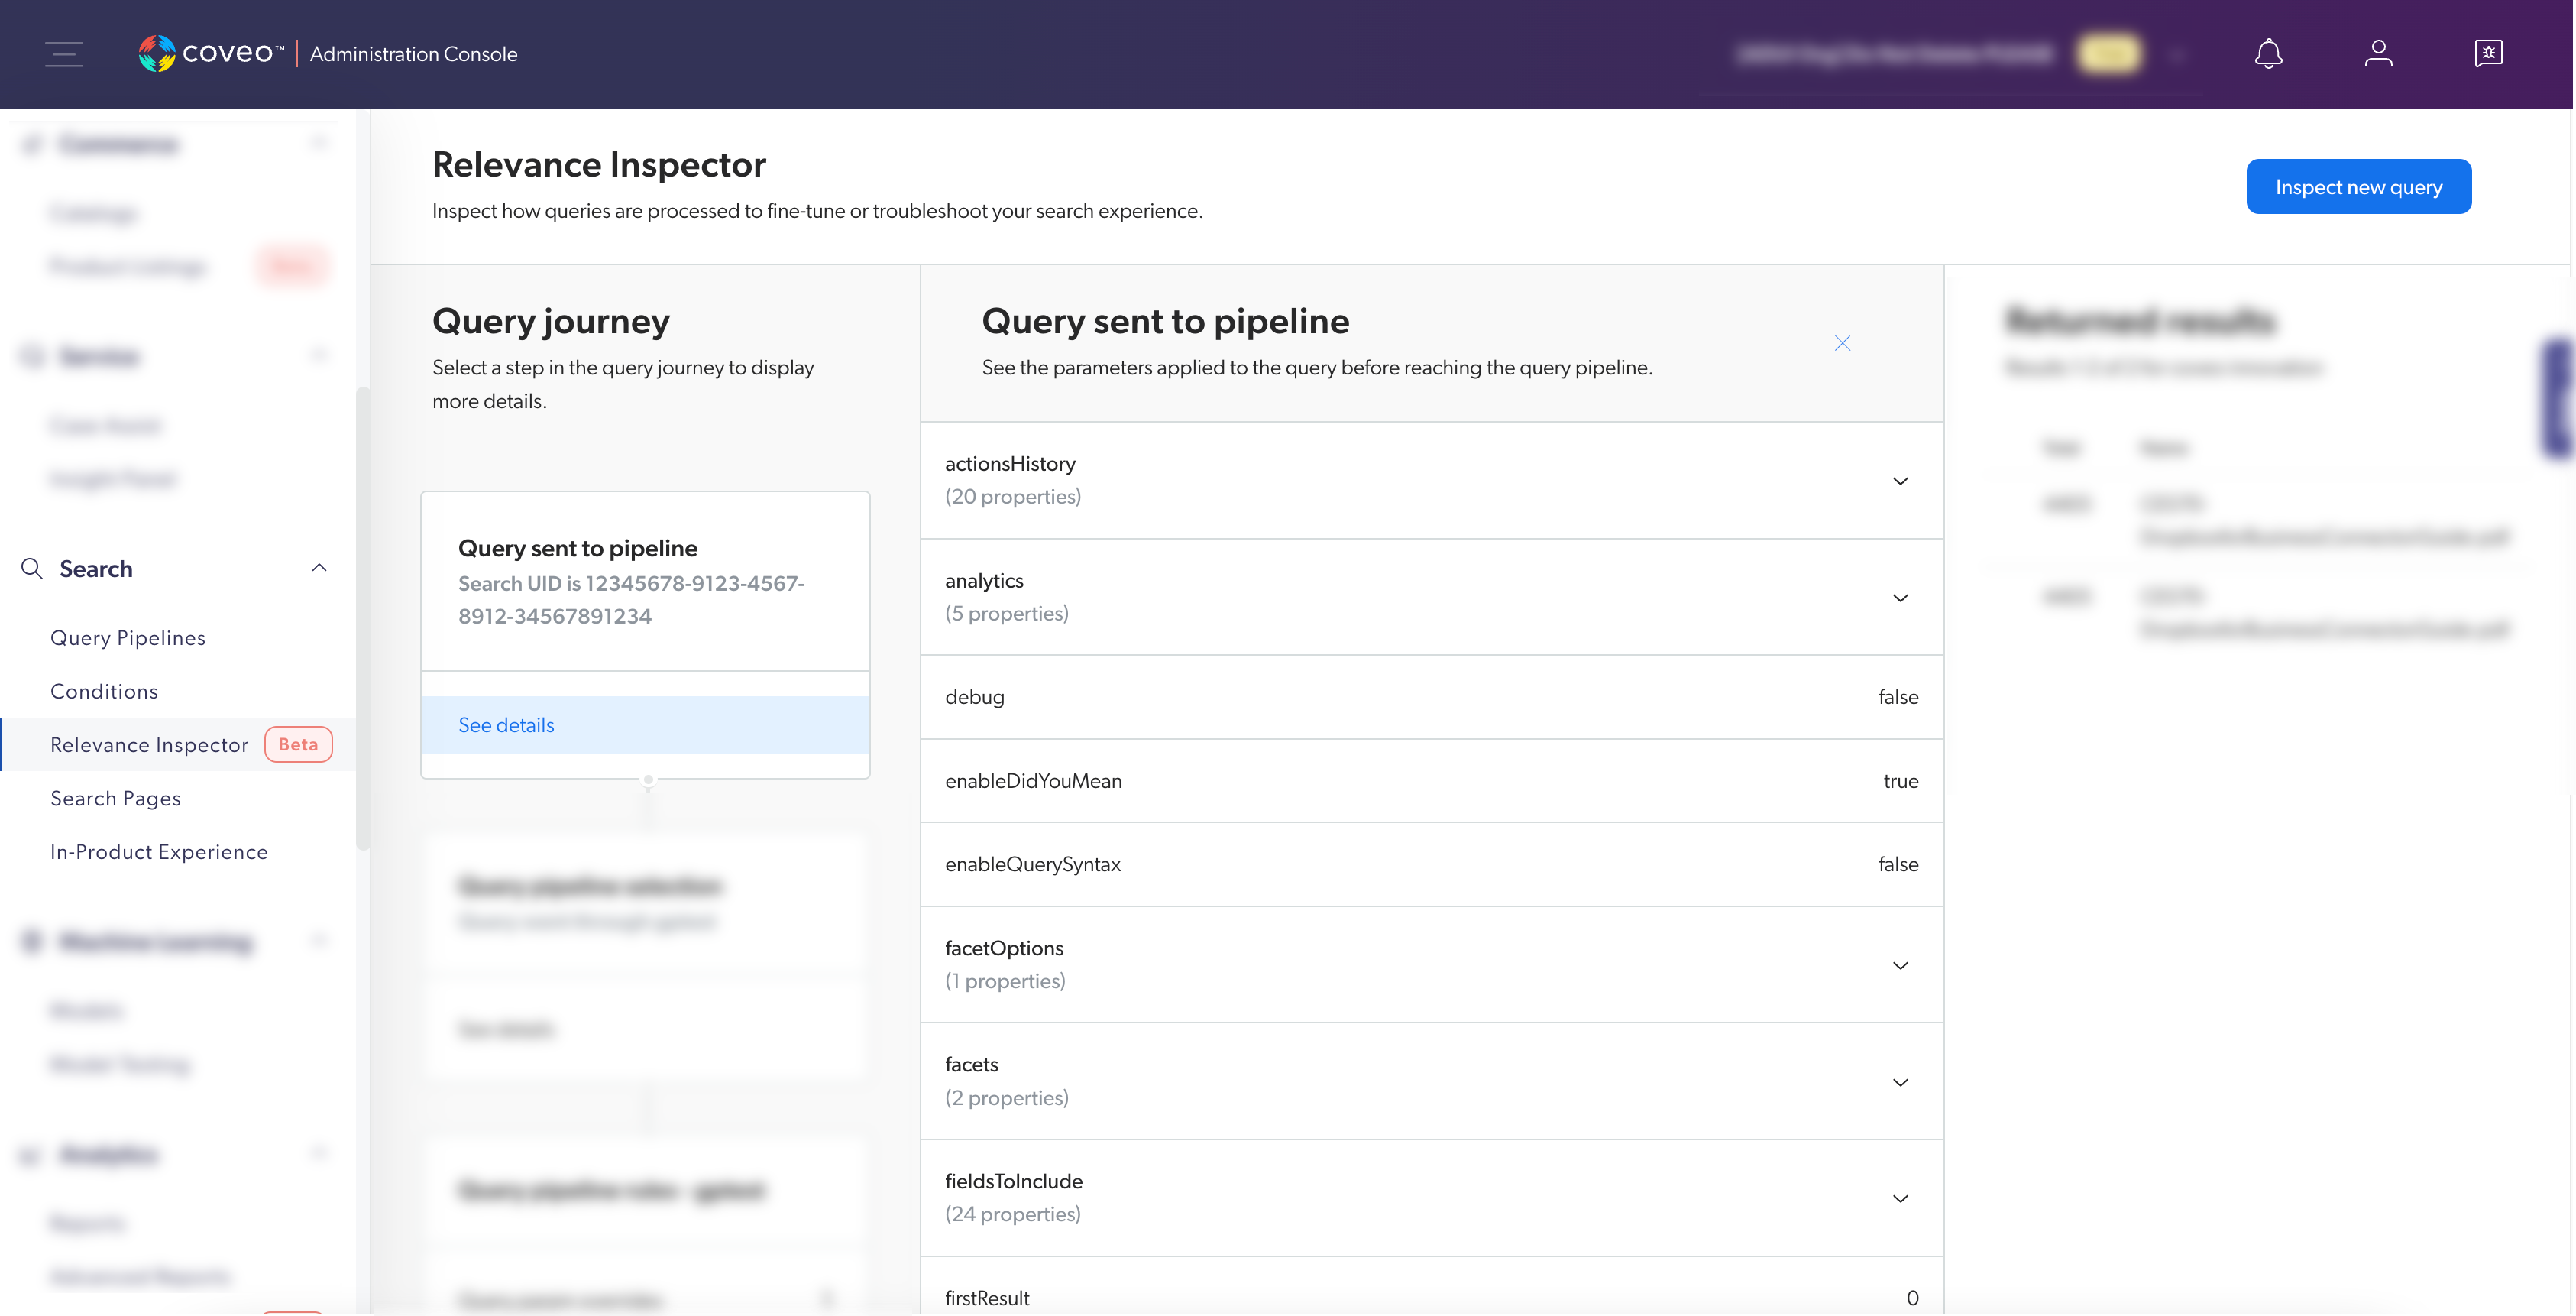
Query sent to pipeline
When you click See details, this section shows the query parameters that were applied to the query before it reached the query pipeline. Those represent the request payload sent to the Search API.
|
|
Note
Some available parameters are JSON objects (for example, |
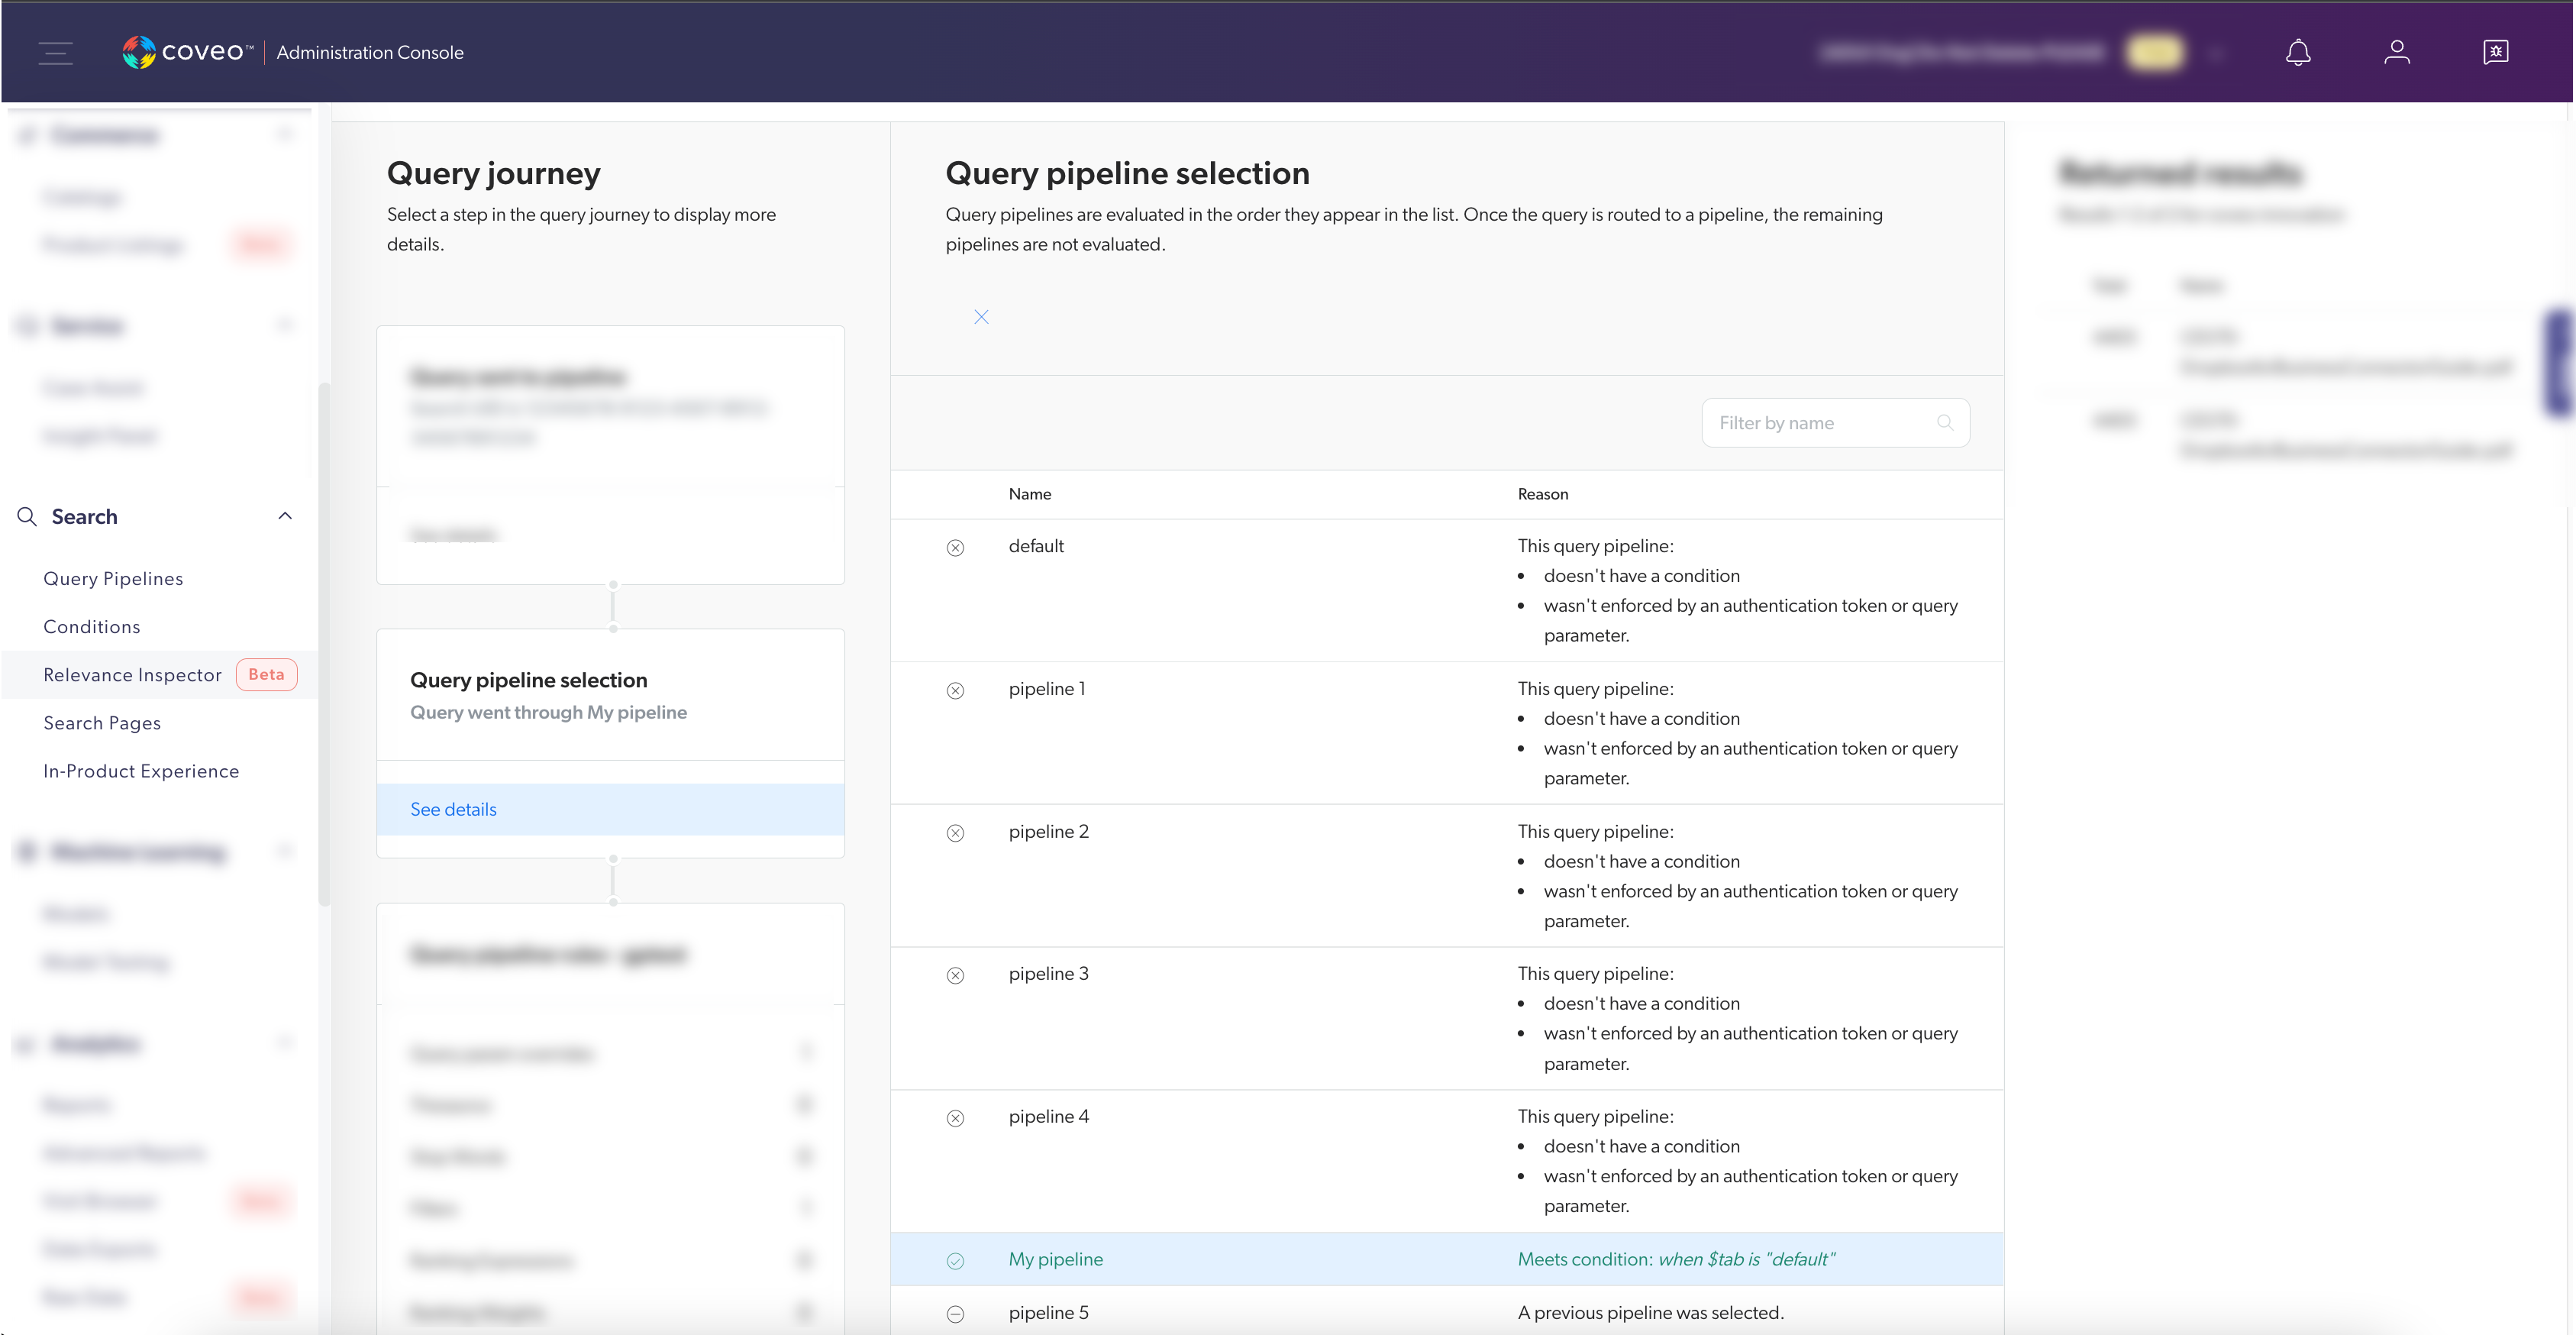
Query pipeline selection
This section shows in which query pipeline the query was routed. See Query pipeline routing mechanisms and rules for further information about query routing.
When you click See details, this section lists all the pipelines available in the Coveo organization along with the reason why a given query pipeline was selected or not.
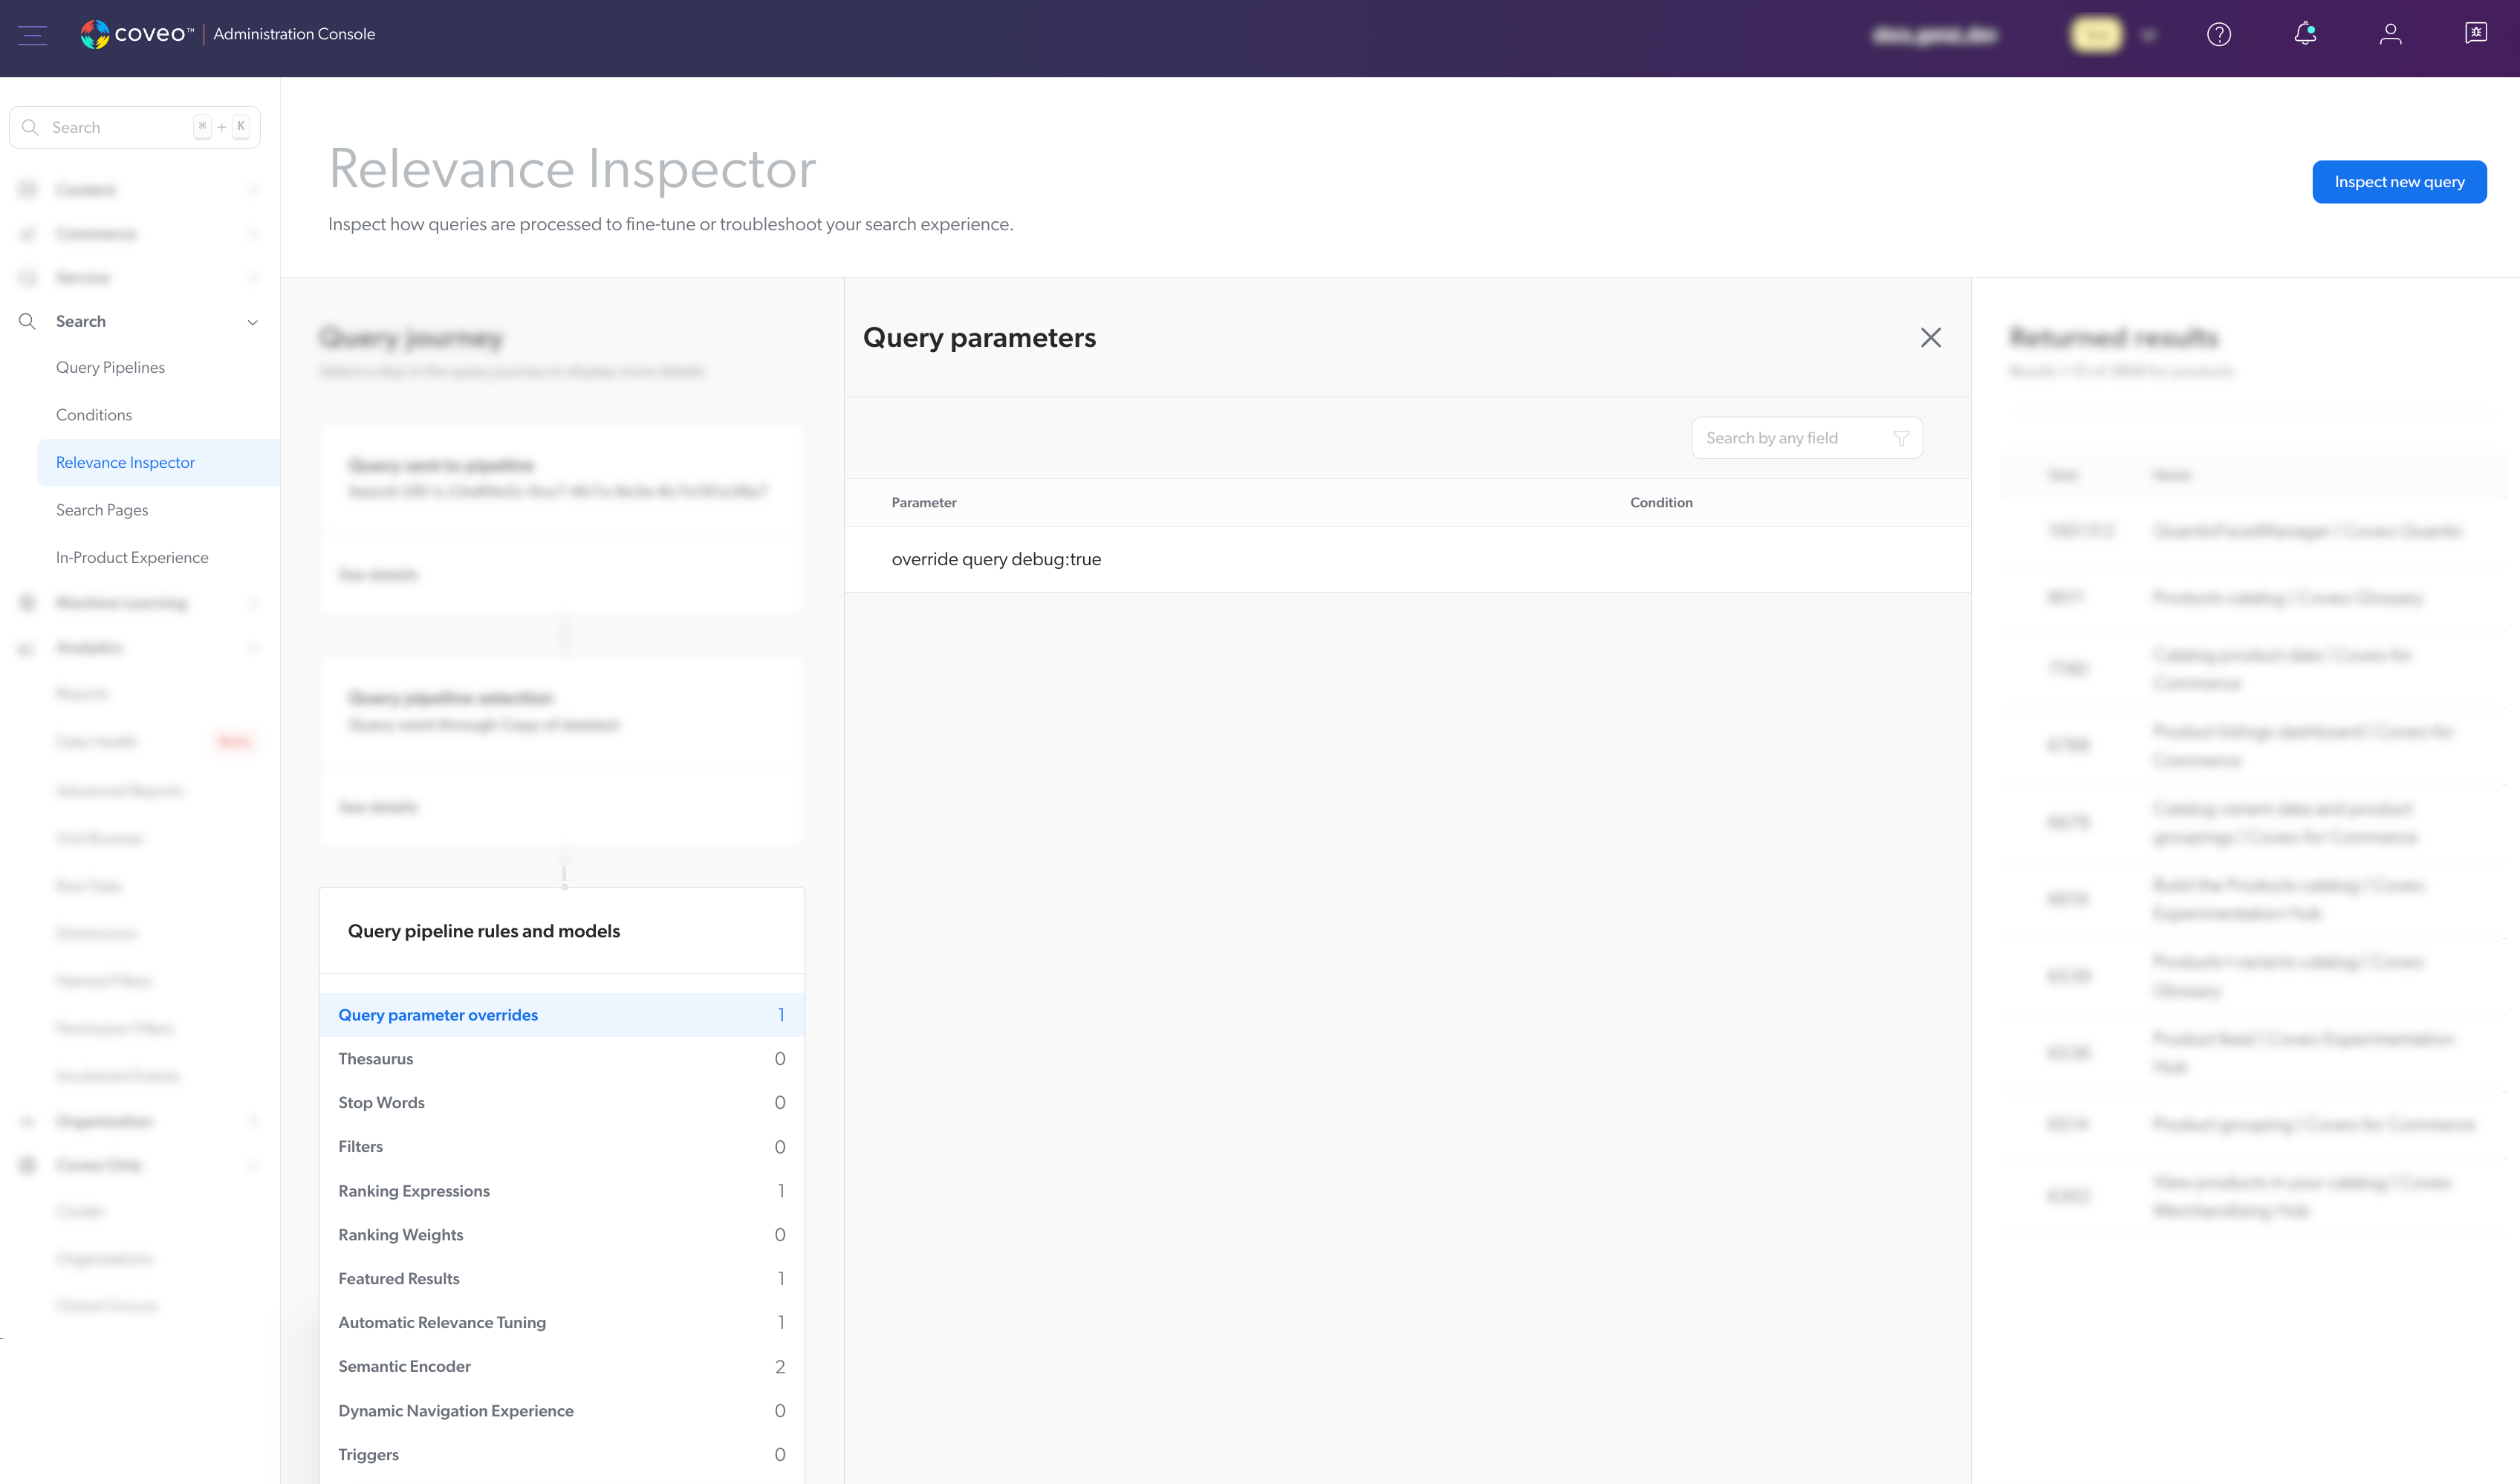
Query pipeline rules and models
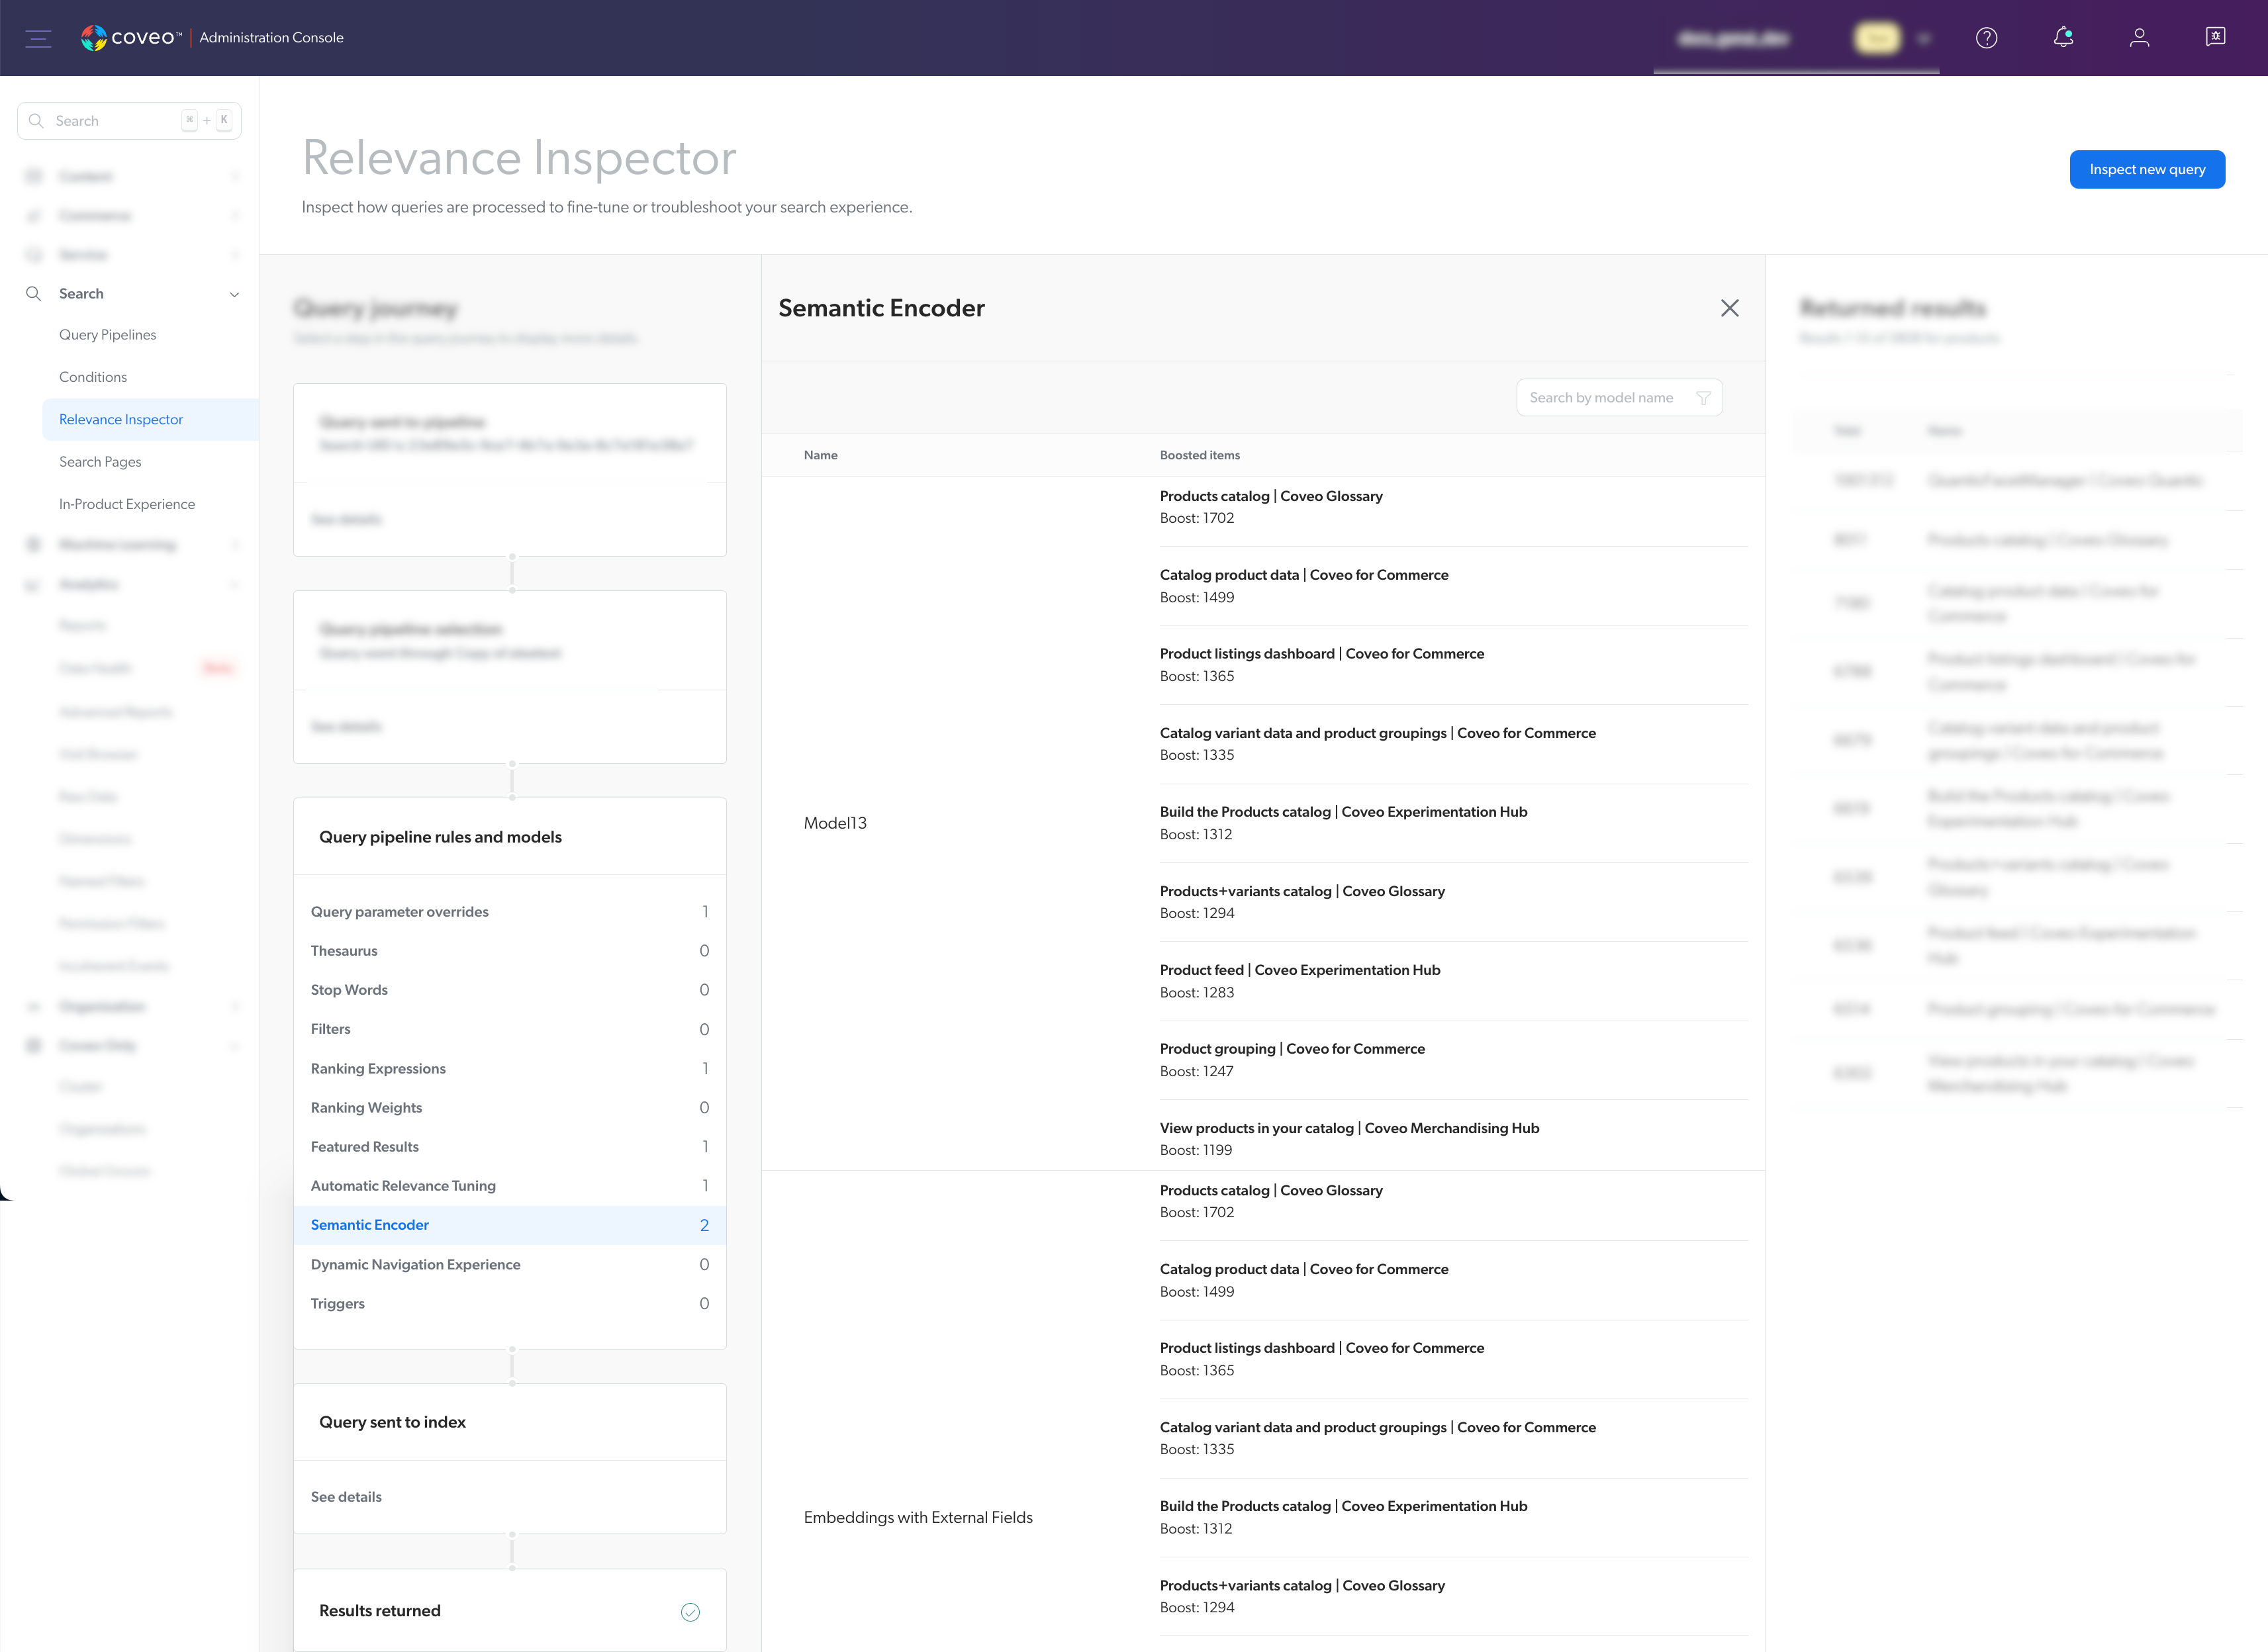
This section shows how the query pipeline rules along with the associated ML models were evaluated and executed according to the query you’re inspecting.
-
Click a type of rule to see more details on the execution of a specific rule and how it modified the query.
-
If a ML model was applied to the query, click the model name to see more details on how it modified the query.
Query sent to index
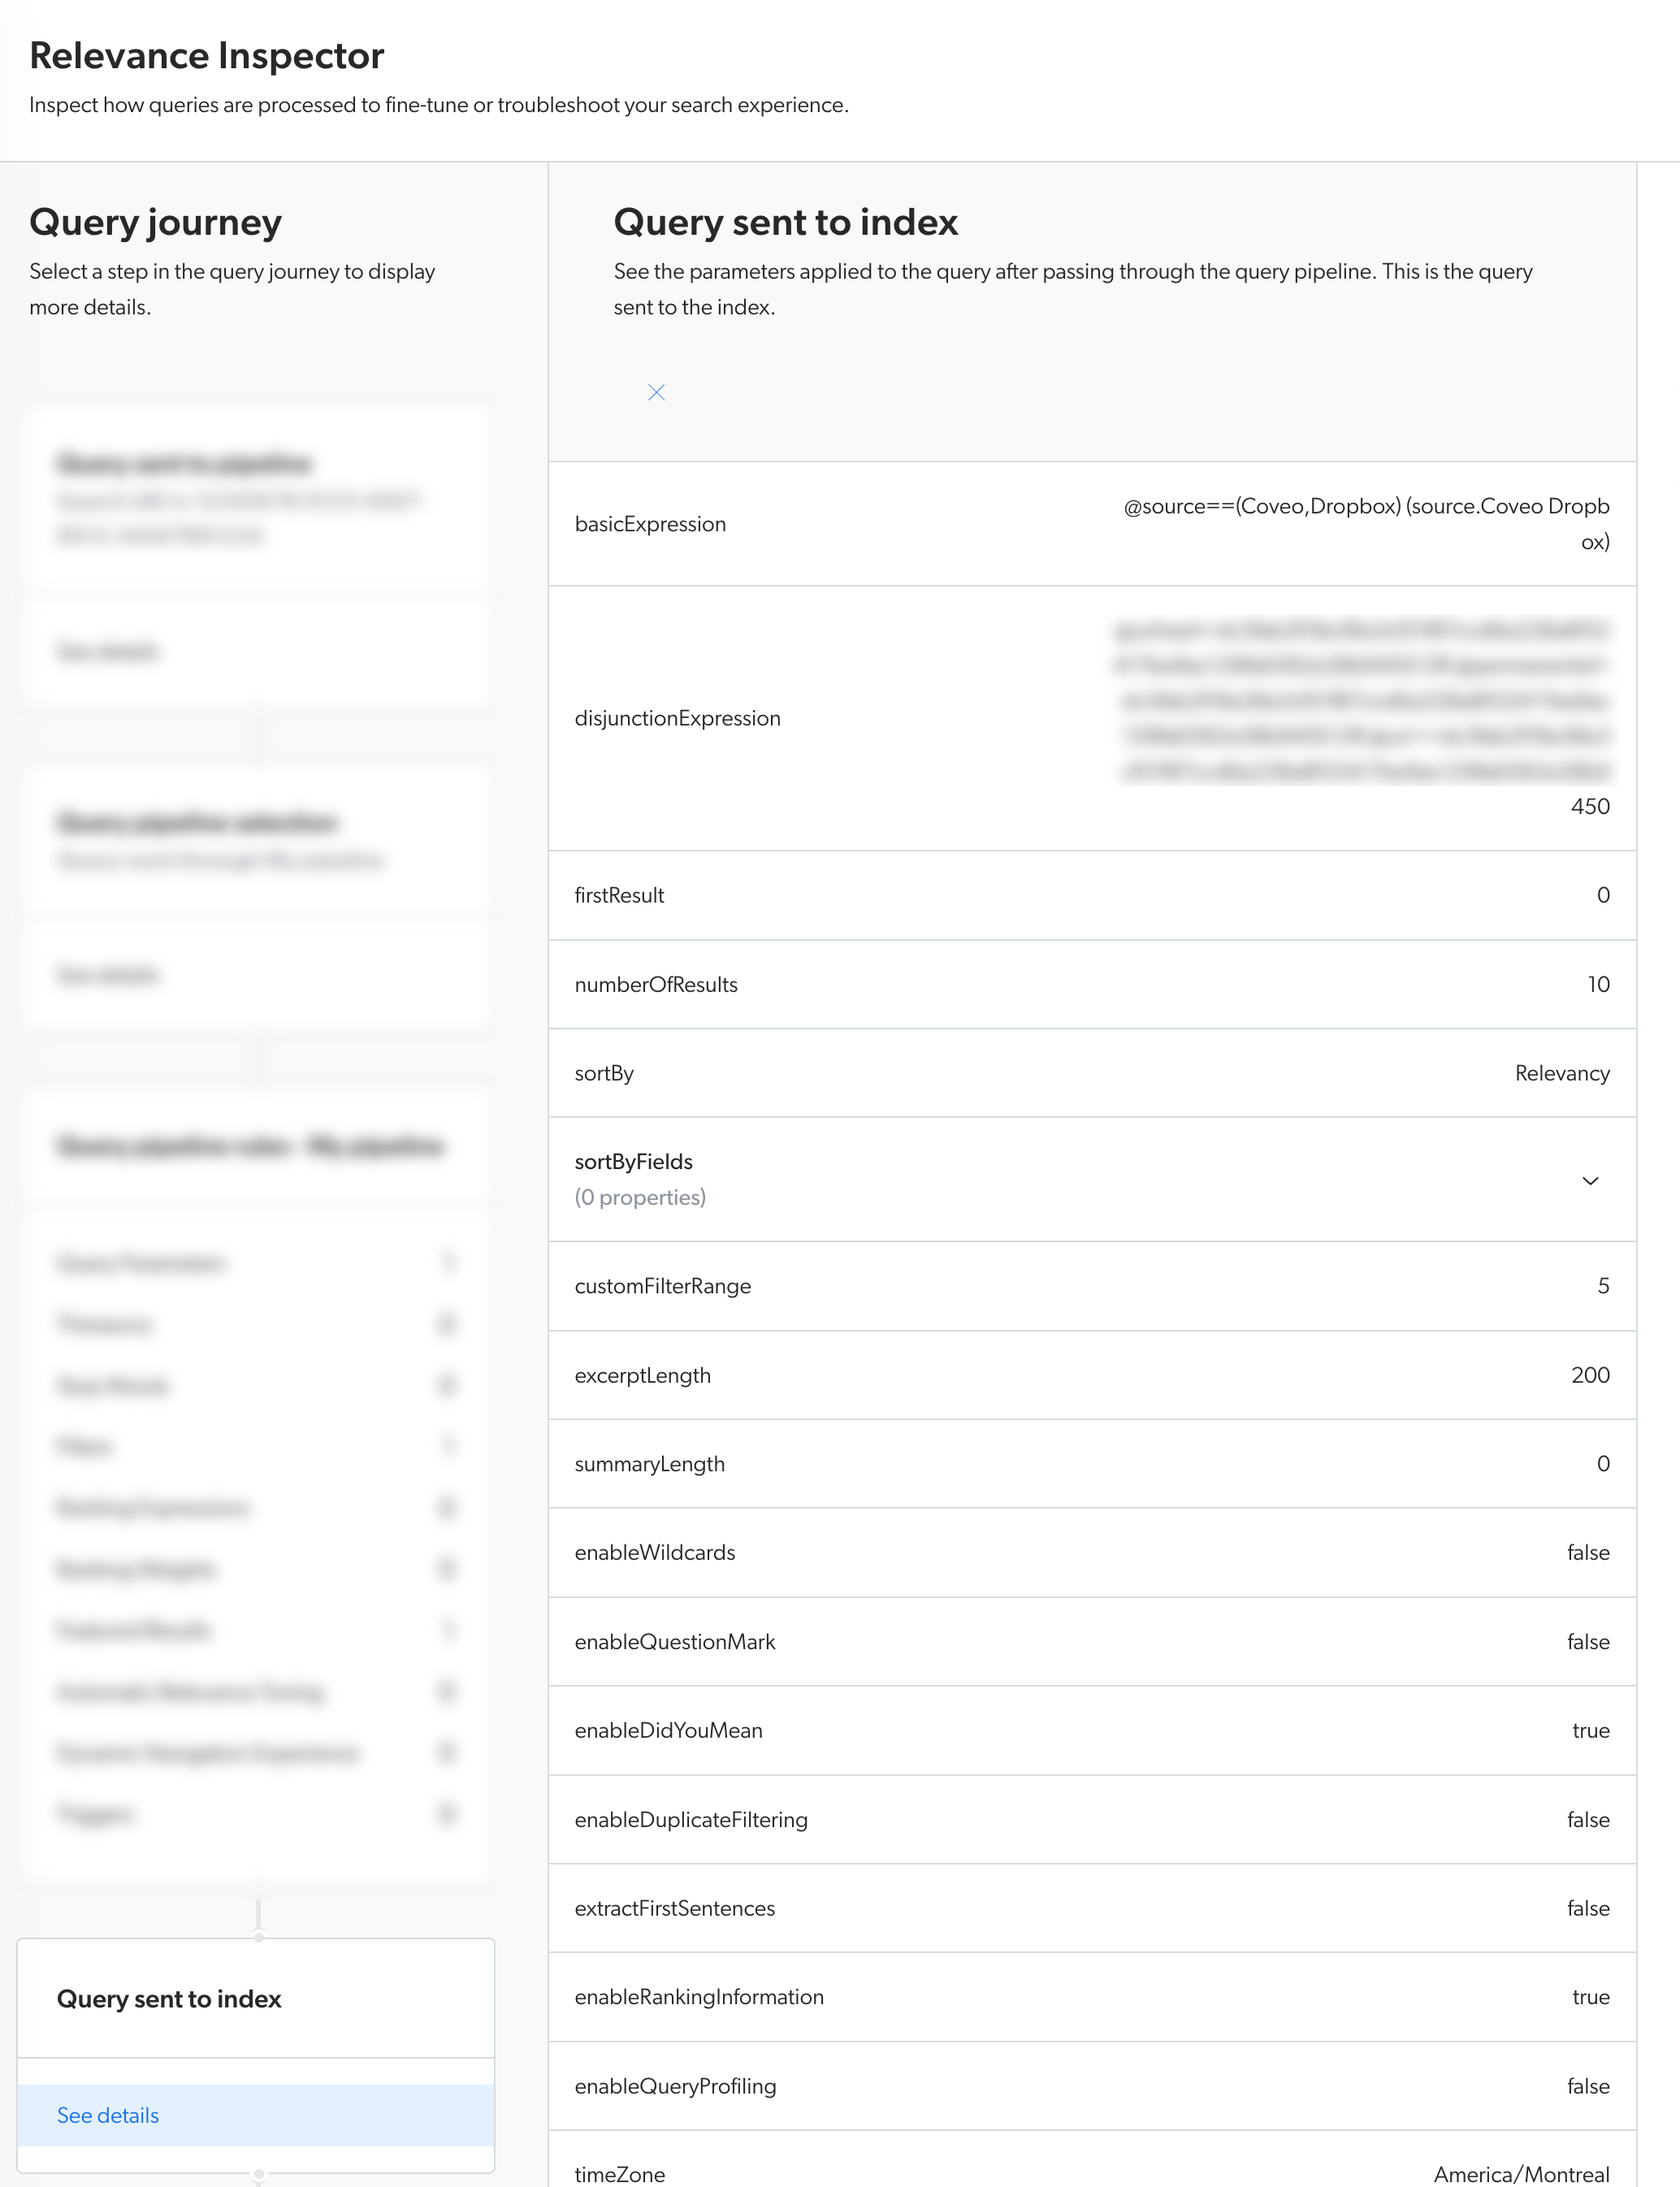
When you click See details, this section shows the query parameters that were applied to the query after it went through the query pipeline. This represents the final information sent to query the index.
|
|
Note
Some available parameters are JSON objects (for example, |
Required privileges
The following table indicates the privileges required to access the Relevance Inspector.
| Action | Service - Domain | Required access level |
|---|---|---|
Access the Relevance Inspector |
Organization - Organization |
View |
Search - Execute queries |
Allowed |