Troubleshoot query pipeline rules
Troubleshoot query pipeline rules
If one or more query pipeline rules aren’t behaving as you expect, you can find useful troubleshooting information in the execution report. This report contains query evaluation details such as which query pipeline features were applied and in what order, what the final query sent to the index was, and so on.
Access the execution report
|
|
Note
Google Chrome is the browser used for this tutorial. Although you can access the execution report using any browser you like, the process may differ. |
-
In the page where your search component is integrated, access the Network tab of the Google Chrome developer tools by either:
-
Selecting F12.
-
Right-clicking anywhere on the page, selecting the Inspect option, and selecting the Network tab.

-
-
Type a query in the search box, and then select Enter or click the search button.
-
Enable the debug mode by either:
-
Adding
&debug=trueat the end of the current URL address.
-
Selecting and holding Alt (Windows) or Option (Mac) and double-clicking any search result box. At the upper right of the panel you just opened, make sure the Enable query debug option is selected. You can then close this panel by selecting Esc.

-
-
Return to the developer tools panel you opened in step 1.
-
In the Name column of the network request table, select the HTTP request which corresponds to the query you just submitted. This should be the latest POST or GET request to
https://<ORG_ID>.org.coveo.com/rest/search/v2(where<ORG_ID>is your organization-specific endpoint prefix).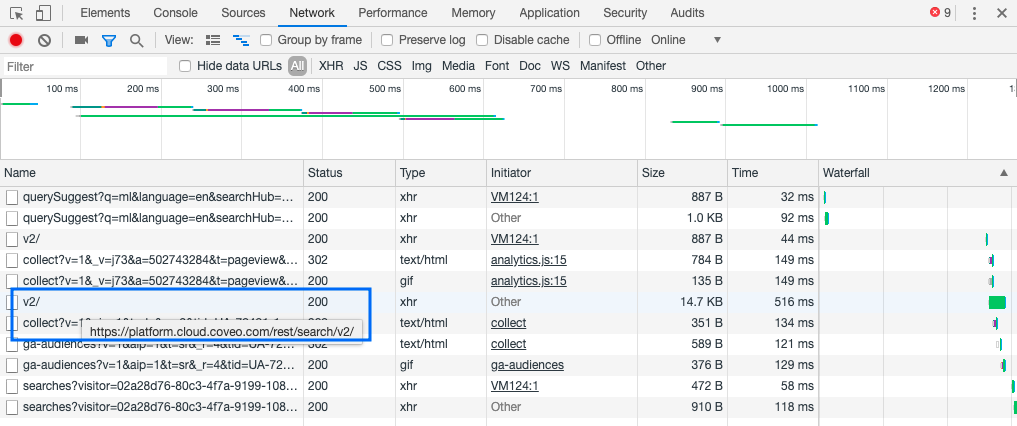
-
Select the Preview tab. You should now see the query response body.
-
Expand the
executionReportproperty. -
Expand the
childrenproperty. You should now be able to visualize the whole path your query took before the results were returned to search interface.
|
|
Note
In the execution report, some query pipeline features have different names than in the Coveo Administration Console (see Query pipeline features). |
-
In a new query pipeline named
My Pipeline, you create the following Filters rule:Add
@source=="movie"to the advanced query expression (aq). -
In the same pipeline, you create the following Thesaurus rule:
Replace
The Lord of the Ringsin the current query byThe Fellowship of the Ringif the advanced query is@source=="movie". -
To test your changes in the query pipeline, you send this query to the search interface:
The Lord of the Rings. You realize that rule 2. was never applied. -
To understand what went wrong with the query going through
My Pipeline, you access the execution report, which gives you the following information: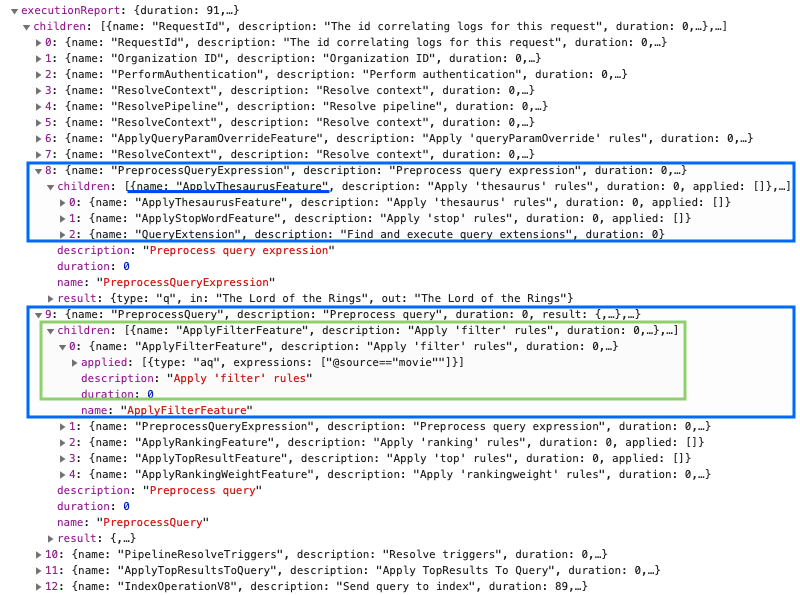
As the items in the execution report children subsection appear in the actual order they were executed on the pipeline, you see that the Thesaurus rule executes before the Filters rule.
Because of this, the advanced query (aq) remains undefined until later in the execution when the Filters rule is executed, therefore failing to satisfy your Thesaurus rule (see Order of execution of query pipeline features).