Analyze RGA implementation performance
Analyze RGA implementation performance
|
|
The Coveo Knowledge Hub is currently available as a beta to early-access customers only. Contact your Customer Success Manager for early access to this feature. |
You can use the Coveo Knowledge Hub GenAI Performance dashboards to analyze the performance of all your RGA implementations from a single location.
The dashboards include important metrics and information for analyzing RGA coverage and effectiveness, such as answer rate and a list of queries that didn’t generate an answer. The dashboards also include information related to your content, such as a list of the most cited items in generated answers, and behavioral information, such as user engagement with your RGA-generated answers.
By combining both quantitative and qualitative information, the GenAI Performance dashboards allow for a comprehensive analysis of your RGA implementations. All metrics also include trend indicators that show whether values are trending up or down, and adjustable period filters make it possible to view and compare information across different time frames.
The dashboards provide visibility into potential issues or gaps in your RGA implementation. You can use the insights obtained from the GenAI Performance dashboards to make informed decisions on how to improve your RGA implementation.
Following a product release, while looking at the GenAI Performance dashboards, you notice a drop in the overall answer rate. You also notice that answers weren’t generated for a high number of queries related to that new product.
By monitoring the data and identifying a potential issue, you can investigate and address issues in your RGA implementation before they significantly impact user experience. For example, you may need to create new content for the product, adjust the RGA model configuration to include relevant content, or modify the associated query pipeline settings to better capture queries related to the new product.
Access the GenAI Performance dashboards
Users with the required privileges can access the Knowledge Hub's GenAI Performance dashboards to analyze the performance of their RGA implementations.
The GenAI Performance dashboards include an overview dashboard that shows metrics for all of your RGA search interfaces (search hubs), and search hub dashboards that show detailed metrics and information for each search hub.
-
Access the Knowledge Hub by selecting Knowledge Hub in the application picker in the Coveo Administration Console header.

-
In the Knowledge Hub navigation menu, select GenAI Performance.
-
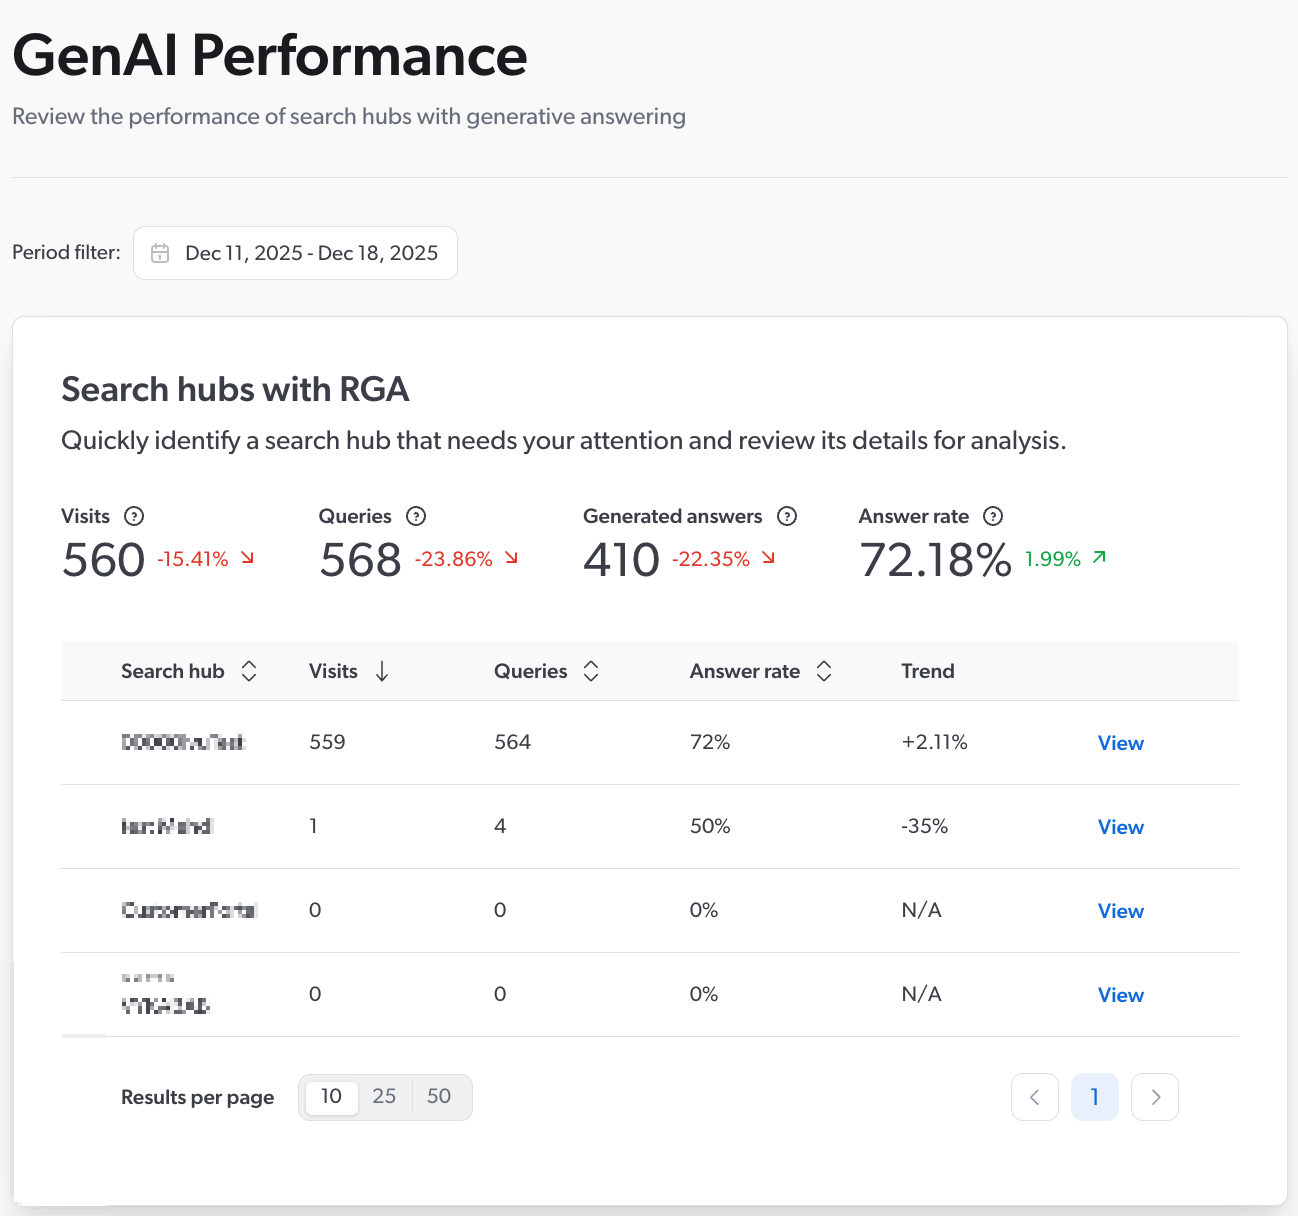
The GenAI Performance tool opens on the overview dashboard that shows metrics for all of your Coveo organization's search interfaces (search hubs) that use RGA. By default, the Period filter is set to show data based on the last 7 days.
 Note
NoteA search hub appears in the list only if it processed at least one query that used an RGA model during the selected period. Depending on your configuration, a query that didn’t use an RGA model might still qualify. For more information, see About the dashboard data.
The overview dashboard shows answer-rate data for all your RGA implementations, showing both combined and individual metrics. This lets you quickly see how your RGA implementations are performing, and identify search hubs that may need your attention for further investigation. For information on the available metrics, see the Overview dashboard.
-
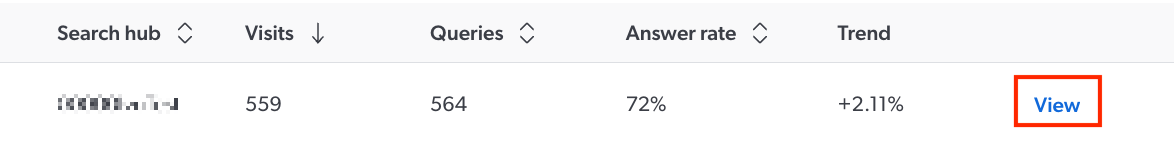
In the overview dashboard, click View next to a search hub to open the search hub dashboard.
The search hub dashboard shows detailed information related to:
-
(Optional) Use the insights obtained from the GenAI Performance dashboards to improve your RGA implementation.
Dashboard metrics and information
This section details the metrics and information that appear in the GenAI Performance dashboards, and describes the dashboard period filters and trend indicators.
About the dashboard data
The GenAI Performance dashboards include data only from search interfaces that processed queries that used an RGA model.
If an RGA model doesn’t run for a given query, such as when the RGA model condition isn’t met in the associated query pipeline, the data related to that query is included only if the search interface is associated with an answer configuration in the Answer Manager.
Depending on your configuration, the answer rate can represent two different things:
-
If the search interface isn’t associated with an answer configuration in the Answer Manager, the answer rate is calculated based only on queries that triggered the RGA model. Queries for which the RGA model didn’t run aren’t included in the calculation.
-
If the search interface is associated with an answer configuration in the Answer Manager, the answer rate is calculated based on all queries processed by the search interface, whether the query triggers the RGA model or not.
Coveo respects the Do Not Track (DNT) (or similar) setting in browsers like Google Chrome, which allows users to express their preference against being tracked. The GenAI Performance dashboards don’t include data from queries originating from a browser session where the user has opted out of being tracked, either via a DNT browser setting, or through other methods or applications that prevent tracking.
|
|
Note
It takes between one and two hours for new data to appear in the GenAI Performance dashboards. |
About the period filter and timezones
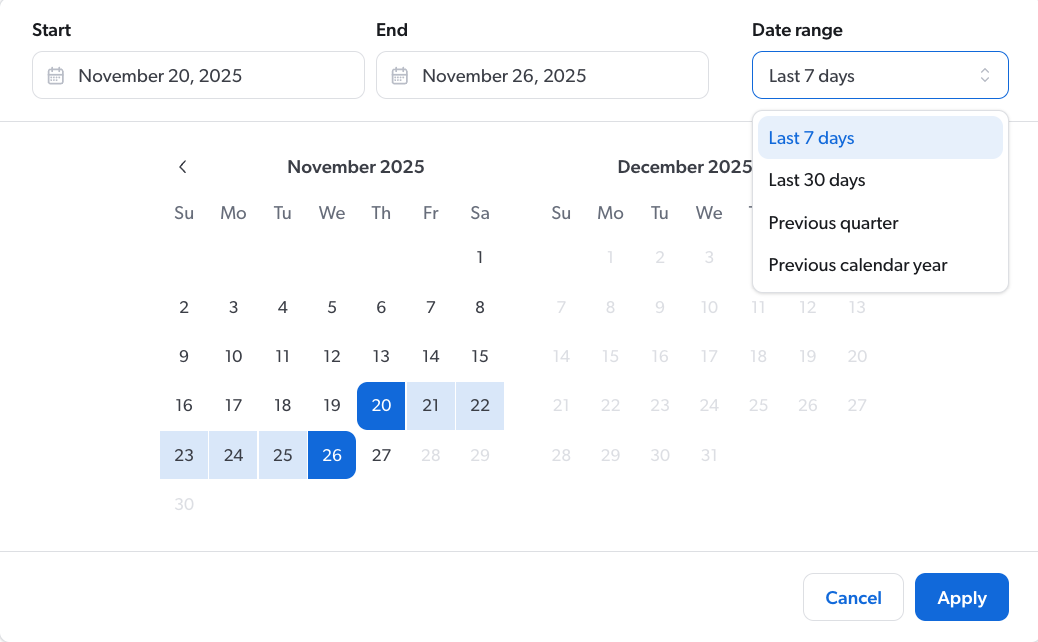
You can use the Period filter settings available throughout the dashboards to select the date range for which you want to view the corresponding information.
Choose from one of the preset date ranges (Last 7 days, Last 30 days, Previous quarter, and Previous calendar year), or set a custom date range by selecting a start and end date in the calendar.
The data in the GenAI Performance dashboards is adjusted to the local timezone of the viewing browser.
A user in Munich performs a query at 1:00 AM on January 12 (Munich local time). That event is logged with the Munich timestamp.
You later access the GenAI Performance dashboards from Montreal and select a date range of January 12 to January 15. The data for the query performed in Munich won’t appear. This is because converting the Munich timestamp to Montreal local time places the query at 7:00 PM on January 11, which falls outside the selected date range.
About the trend indicators
All metrics include a trend indicator that shows whether the currently displayed value is trending up or down as compared to the previous similar period. For example, if the current date is 2025-12-17 and the Period filter is set to Last 30 days, it compares the last 30 days (2025-11-18 to 2025-12-17) to the previous 30 days before that (2025-10-19 to 2025-11-17). If the Period filter is set to a custom date range of 42 days, it compares that range to the 42 days before that.
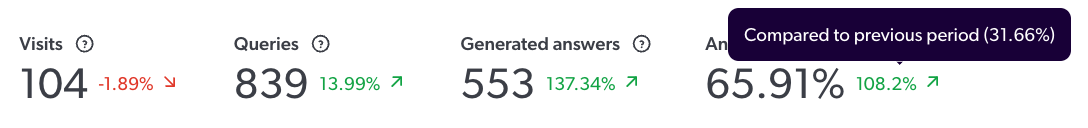
Trend data is shown as a percentage value. You can hover over the trend value to see the metric’s value for the previous period.
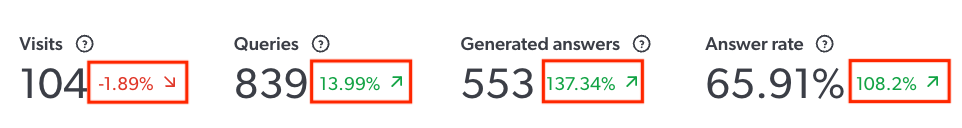
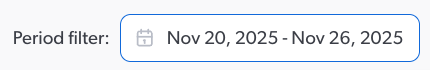
The Period filter is set to show data for the last 7 days (November 20 to November 26).
The answer rate shows an increase of 108.2% compared to the prior 7-day period (November 13 to November 19). Hovering over the trend value shows that the answer rate for the previous period was 31.66%.
|
|
Note
If there’s insufficient data in the previous period to which to compare the currently displayed value, N/A appears instead of a trend value. |
Overview dashboard
This section describes the metrics that are available in the GenAI Performance overview dashboard.
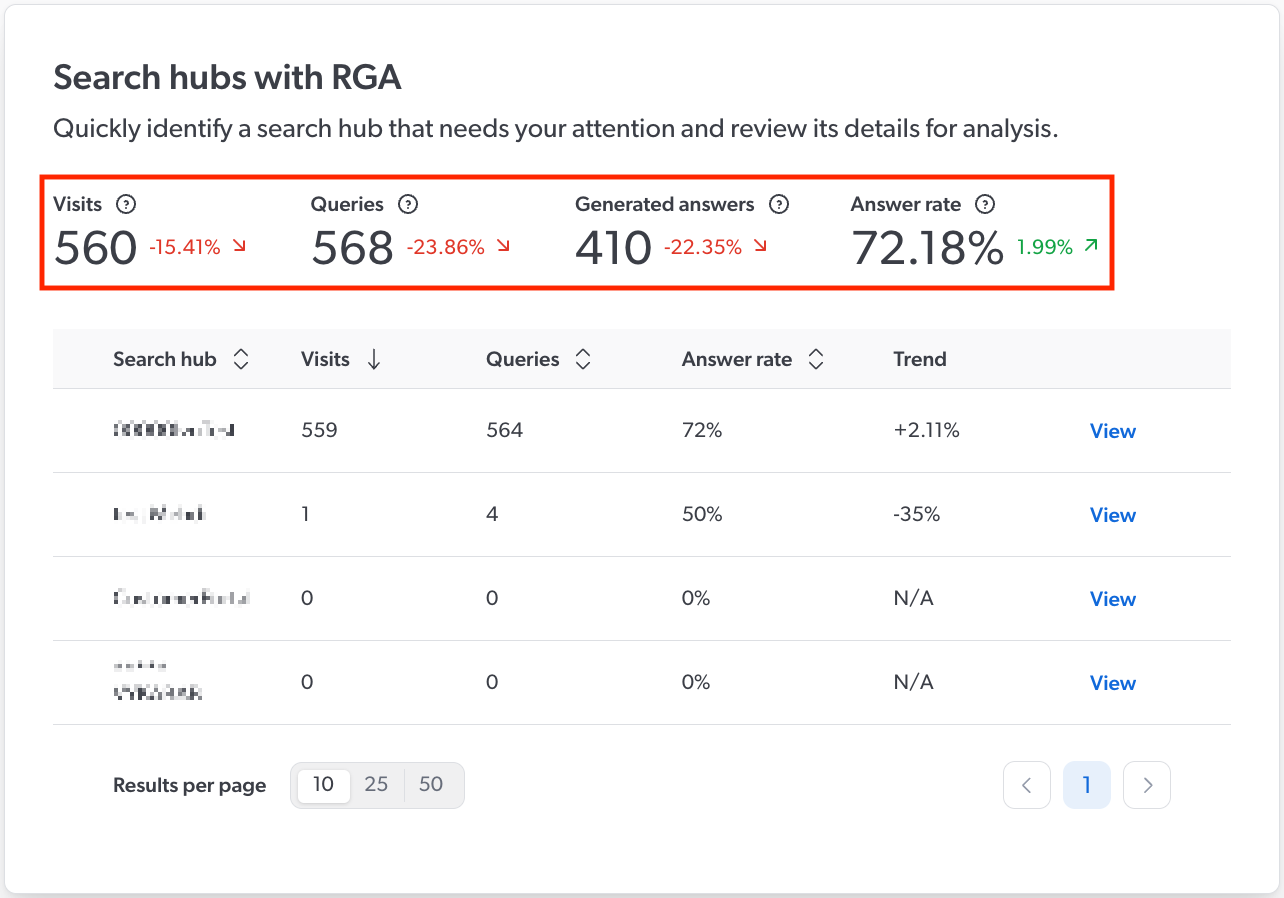
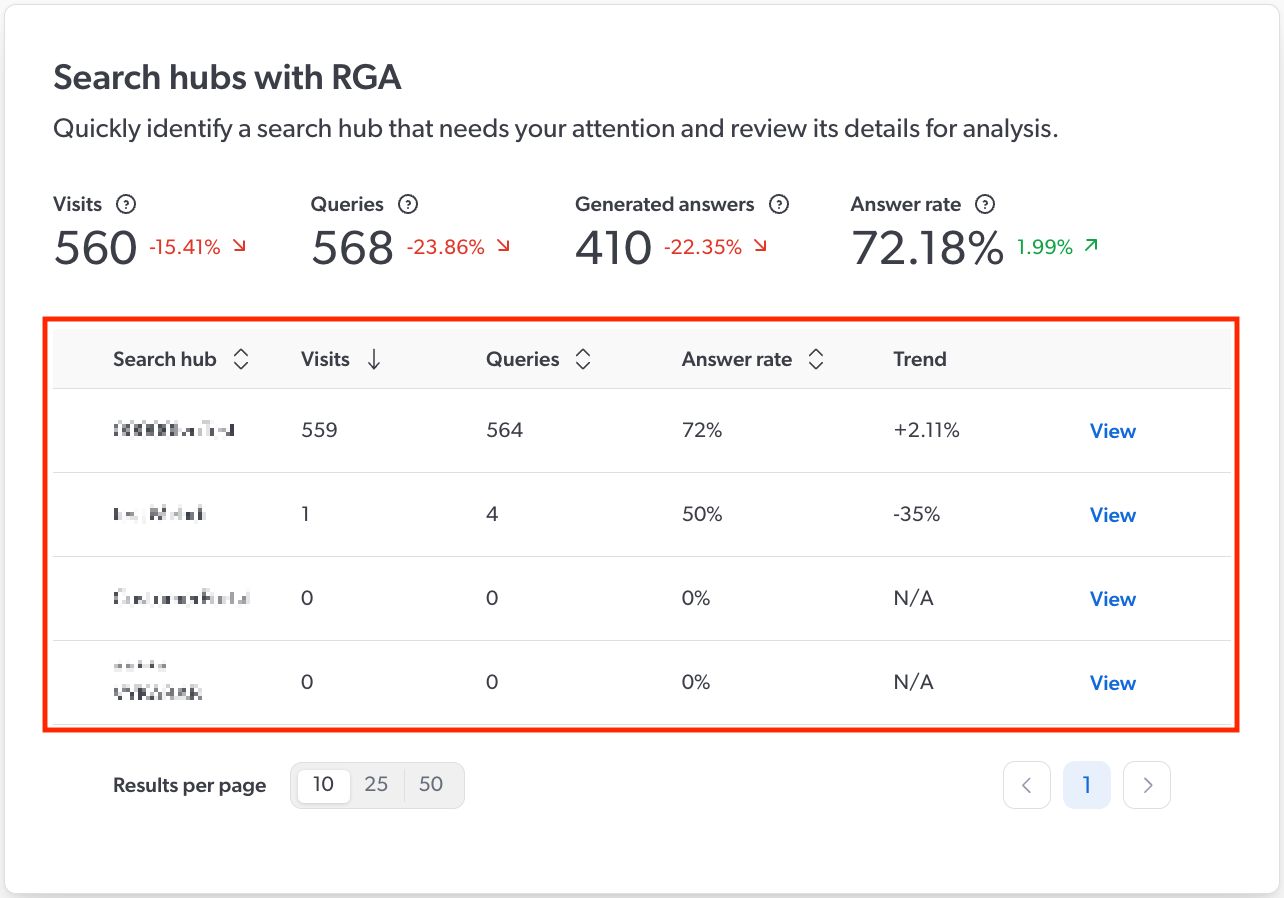
The overview dashboard shows combined and individual metrics for all of your RGA search hubs with at least one query during the currently selected period. You can use the overview page to analyze the overall performance of your RGA implementations, and to identify specific search hubs that may need your attention for further investigation.
Combined metrics
The combined metrics for all currently displayed RGA search hubs are shown above the list of search hubs.
| Metric | Description |
|---|---|
Visits |
Total number of distinct user visits across all listed search hubs. |
Queries |
Total number of queries across all listed search hubs. |
Generated answers |
Total number of generated answers across all listed search hubs. |
Answer rate |
The percentage of queries across all listed search hubs for which an answer was generated. |
Search hub metrics
Search-hub specific metrics are shown in the list of search hubs.
|
|
Note
A search hub appears in the list only if it processed at least one query that used an RGA model during the selected period. Depending on your configuration, a query that didn’t use an RGA model might still qualify. For more information, see About the dashboard data. |
| Metric | Description |
|---|---|
Visits |
Total number of distinct user visits. |
Queries |
Total number of queries. |
Generated answers |
Total number of generated answers. |
Answer rate |
The percentage of queries for which an answer was generated. |
Trend |
The change in answer rate for the search hub between the currently selected period and the previous similar period, as a percentage. A positive value indicates an increase in answer rate, while a negative value indicates a decrease. For example, if the current date is 2025-12-17 and the Period filter is set to Last 30 days, the answer rate for the last 30 days (2025-11-18 to 2025-12-17) is compared to the previous 30 days before that (2025-10-19 to 2025-11-17). If the Period filter is set to a custom date range of 42 days, it compares that range to the 42 days before that. |
|
|
Note
Click View next to a search hub to open the search hub dashboard, where you can see more detailed information.
|
Search hub dashboard
When you click View next to a search hub in the overview dashboard, the search hub dashboard opens with detailed information that you can use to analyze the following aspects of your RGA implementation:
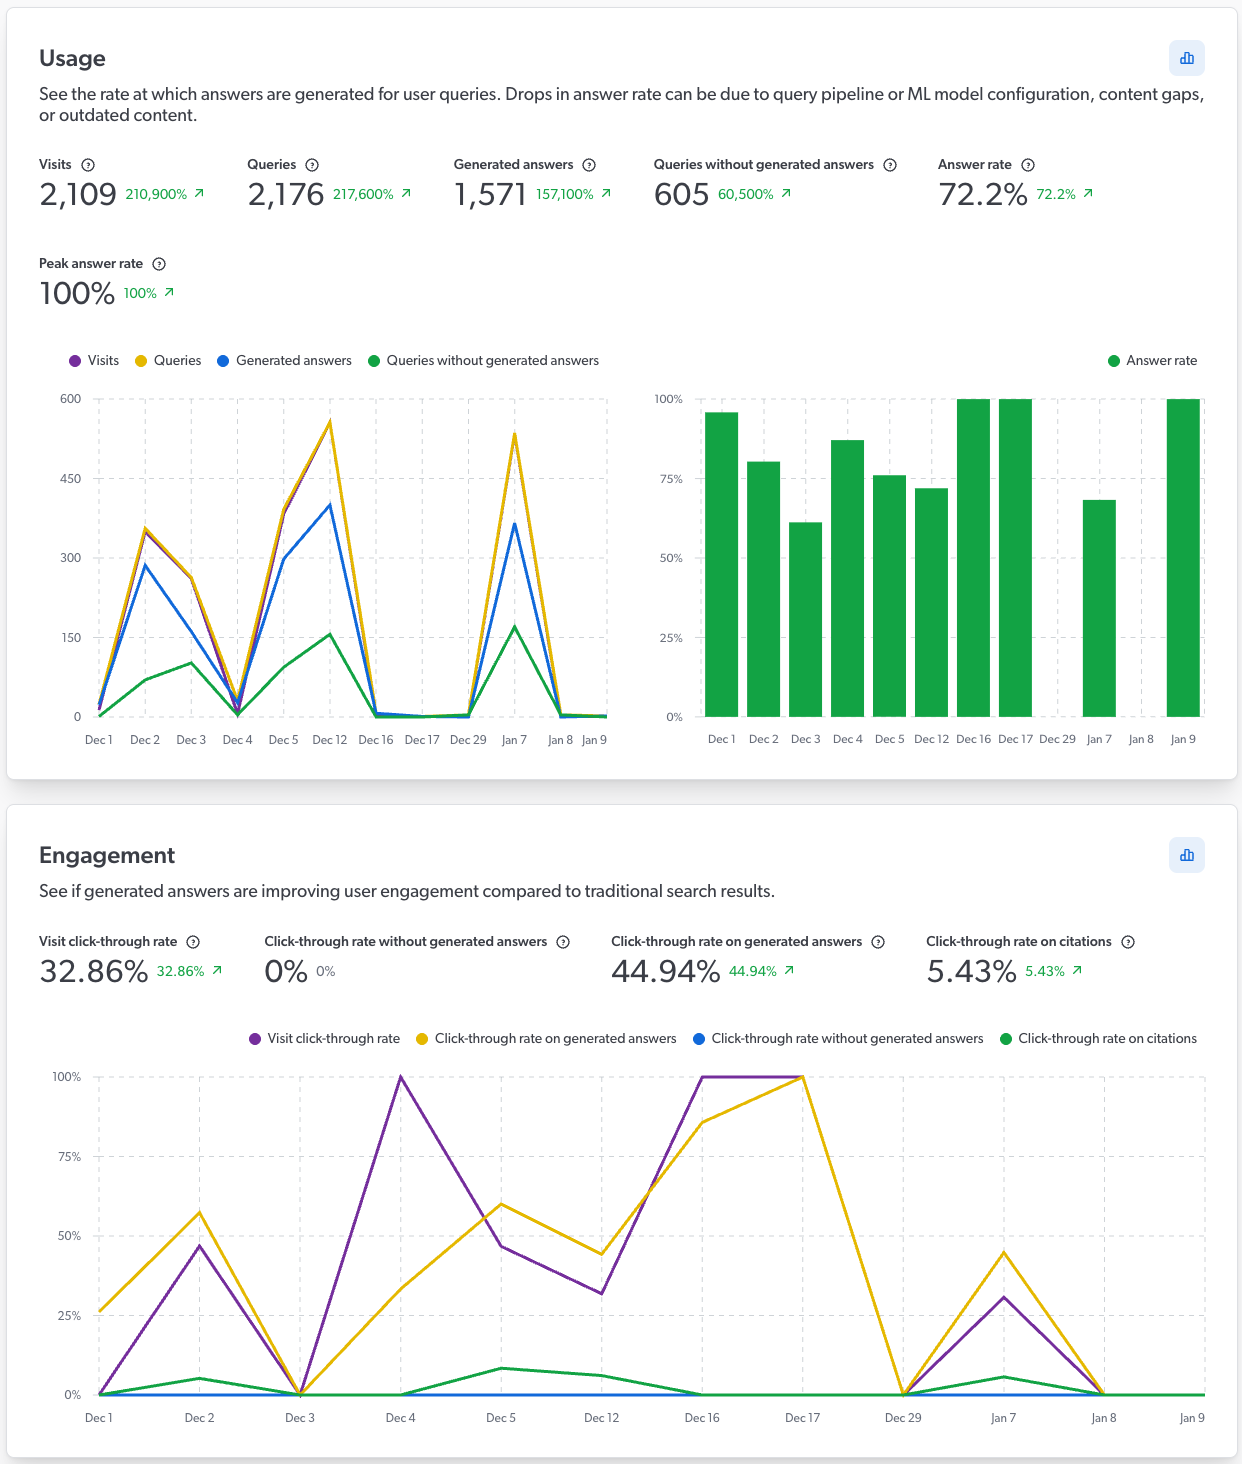
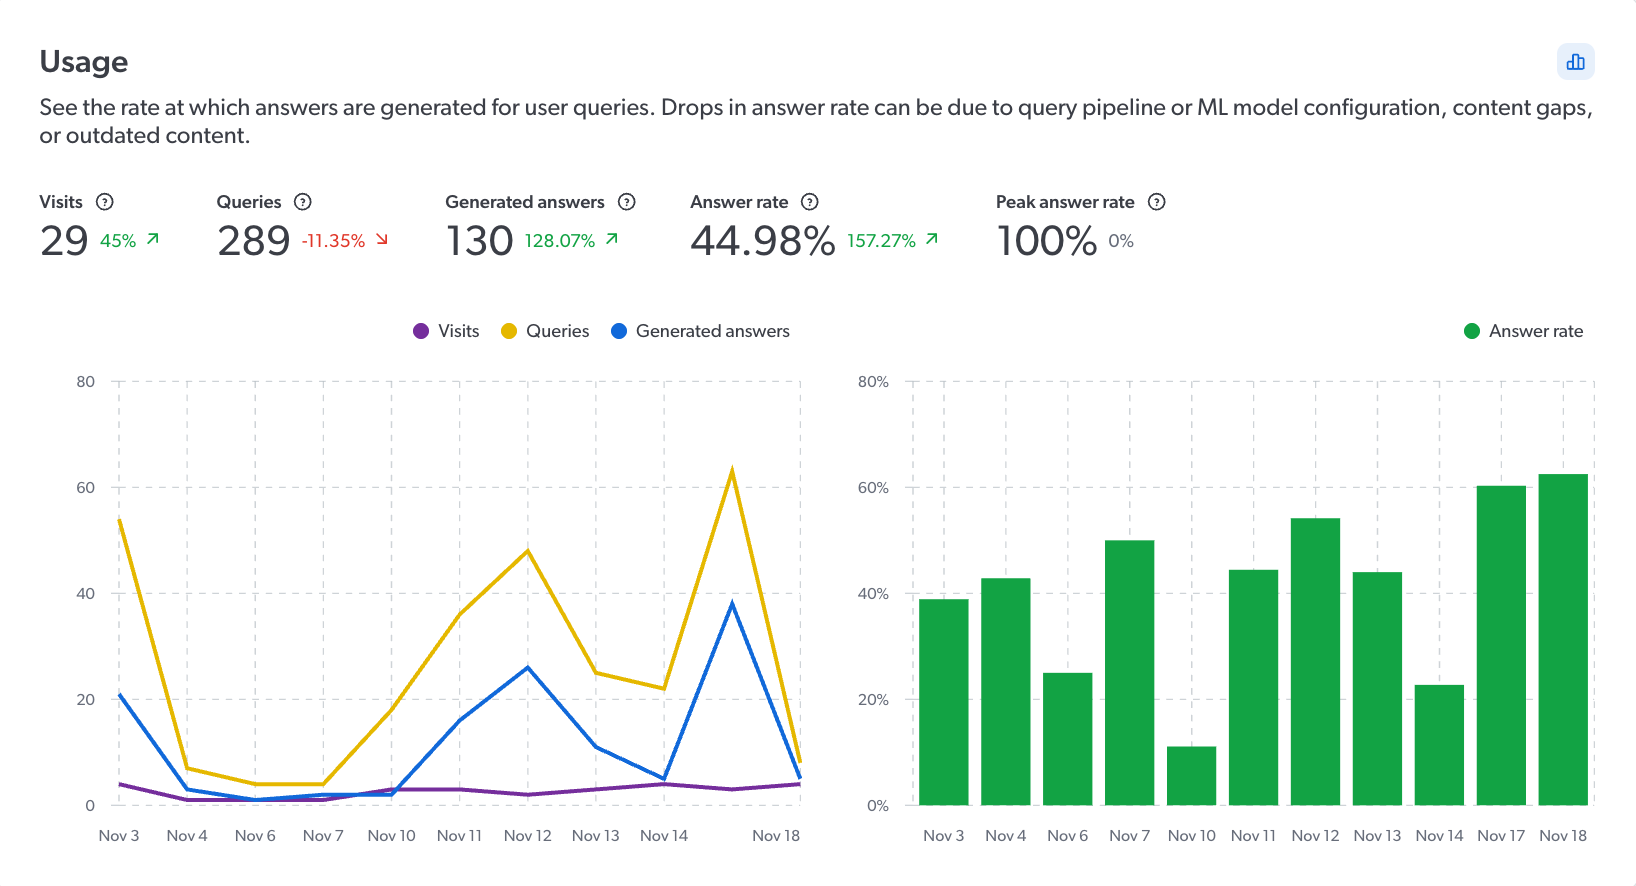
Usage
The Usage card provides insights into the rate at which answers are generated in the RGA search hub.
|
|
Note
To analyze the usage data for a different date range without affecting the date range for the other dashboard cards on the screen, click |
| Metric | Description |
|---|---|
Visits |
Total number of distinct user visits. |
Queries |
Total number of queries. |
Generated answers |
Total number of generated answers. |
Queries without generated answers |
Total number of queries for which an answer wasn’t generated. |
Answer rate |
The percentage of queries for which an answer was generated. |
Peak answer rate |
The highest answer rate achieved in a single day during the selected period. |
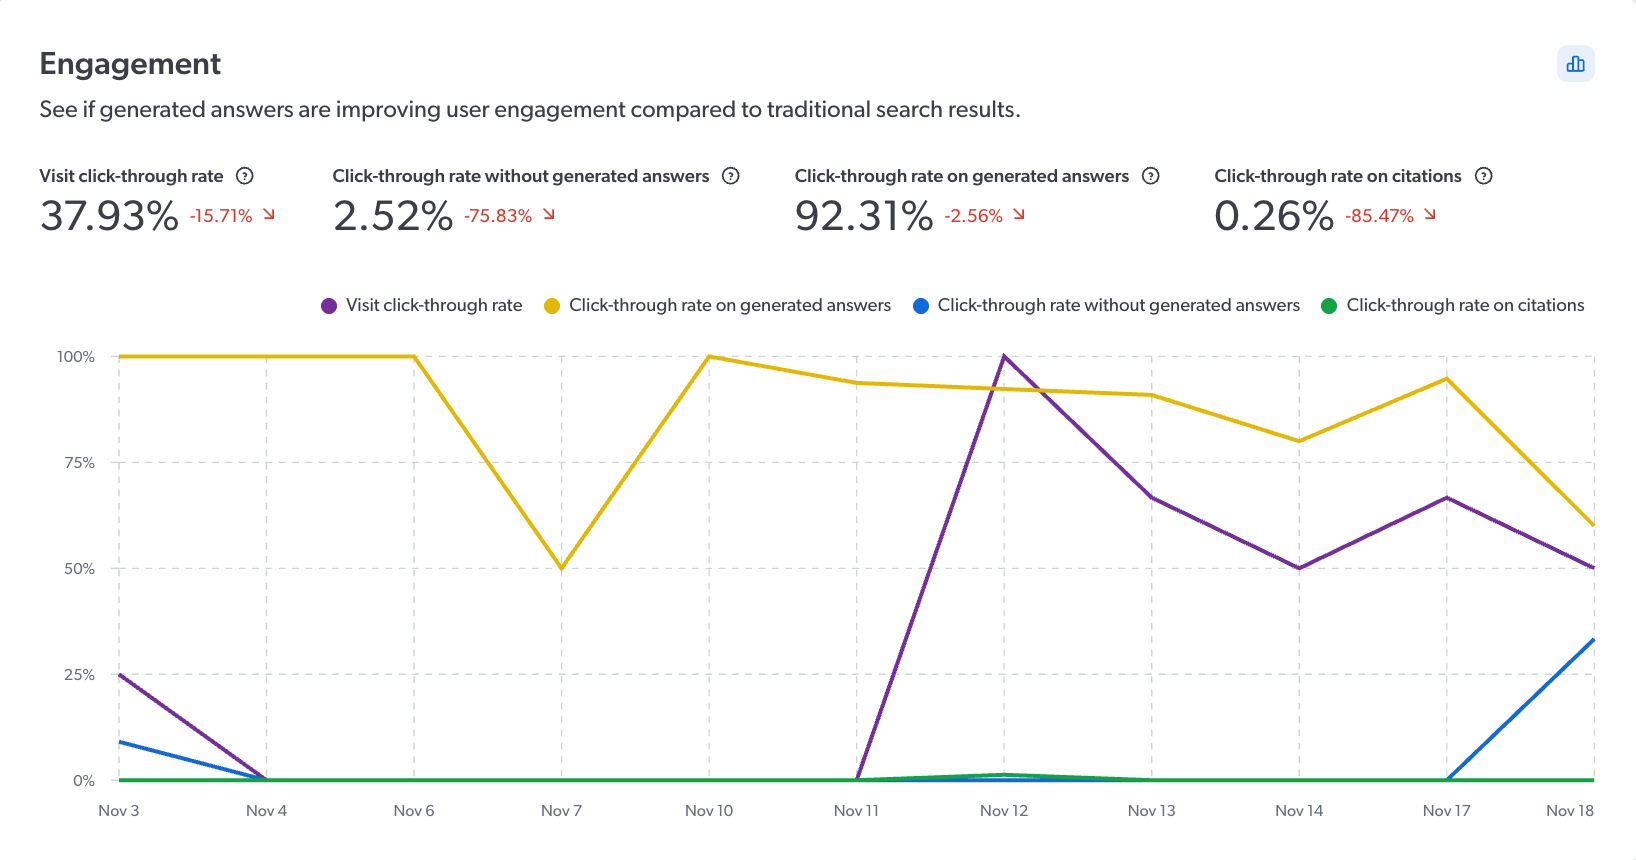
Engagement
The Engagement card provides insights into user interaction with generated answers, such as the number of clicks on citations compared with clicks on traditional search results.
|
|
Note
To analyze the engagement data for a different date range without affecting the date range for the other dashboard cards on the screen, click |
| Metric | Description |
|---|---|
Visit click-through rate |
The percentage of distinct user visits with at least one click on either a traditional search result or a generated answer, indicating overall user engagement. |
Click-through rate without generated answers |
The percentage of queries that didn’t generate an answer with at least one click on a traditional search result. |
Click-through rate on generated answers |
The percentage of queries that generated an answer with at least one click on the generated answer. This includes an interaction with any of the RGA component elements, such as citations (click or hover), copy or feedback buttons, or expand and collapse function. |
Click-through rate on citations |
The percentage of citations that were clicked across all citations in generated answers. |
Generated answers with feedback
The Generated answers with feedback card provides a list of the generated answers that users flagged as helpful and unhelpful using the RGA answer feedback feature.
|
|
Note
The Generated answers with feedback card appears only if you have the GenAI analytics index content privilege. |
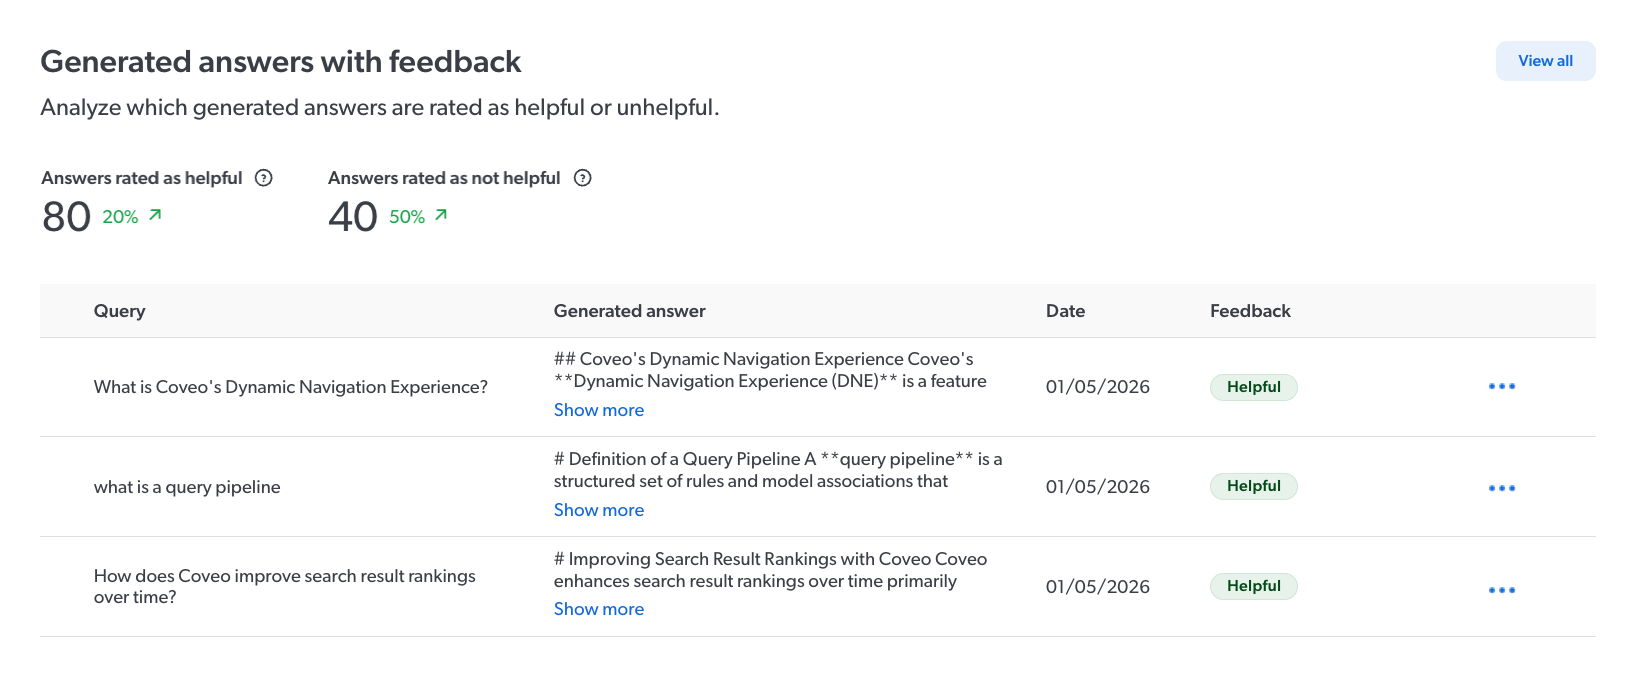
The list shows the Query and the associated Generated answer. You can click Show more to expand the generated answer, or inspect the chunks that were used to generate it.
|
|
Notes
|
| Metric | Description |
|---|---|
Answers rated as helpful |
Total number of generated answers that were rated as helpful by users. |
Answers rated as unhelpful |
Total number of generated answers that were rated as unhelpful by users. |
To inspect the chunks used to generate a specific answer
If you have the required privileges, you can launch the Knowledge Hub’s Chunk Inspector directly from the list of answers to inspect the chunks that were used to generate a specific answer. Inspecting the chunks that were used by RGA to generate an answer provides you with information that you can then use to make adjustments to improve your generative-answering experience.
-
Click
 next to the generated answer, and then click Inspect.
The Chunk Inspector opens in a new browser tab, and runs automatically based on the generated answer’s ID.
next to the generated answer, and then click Inspect.
The Chunk Inspector opens in a new browser tab, and runs automatically based on the generated answer’s ID.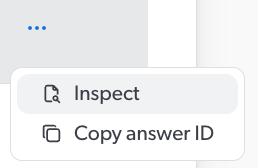

Click Copy answer ID to copy the answer ID to your clipboard, such as to use in the Chunk Inspector later, or for troubleshooting with Coveo Support.
-
In the Chunk Inspector, review the chunk details that appear.
-
(Optional) Use the information in the Chunk Inspector to improve your RGA implementation.
Examples-
While inspecting the chunks that were used to generate the answer, you notice that low-relevance chunks were sent to the LLM for answer generation. A potential solution might be to increase the chunk relevancy threshold so that only higher-relevance chunks are sent to the LLM.
-
While inspecting the chunks that were used to generate the answer, you notice that the information in the most-relevant chunks is outdated or missing crucial information. A potential solution might be to update the content for that product to address any content gaps or misinformation.
-
Top 50 cited items
The Top 50 cited items card provides a list of the most frequently cited items in generated answers. A cited item refers to an indexed item that contains a segment of text (chunk) that was used by the RGA model to generate an answer. Click View all to see the complete list.
|
|
Note
The Top 50 cited items card appears only if you have the GenAI analytics index content privilege. |
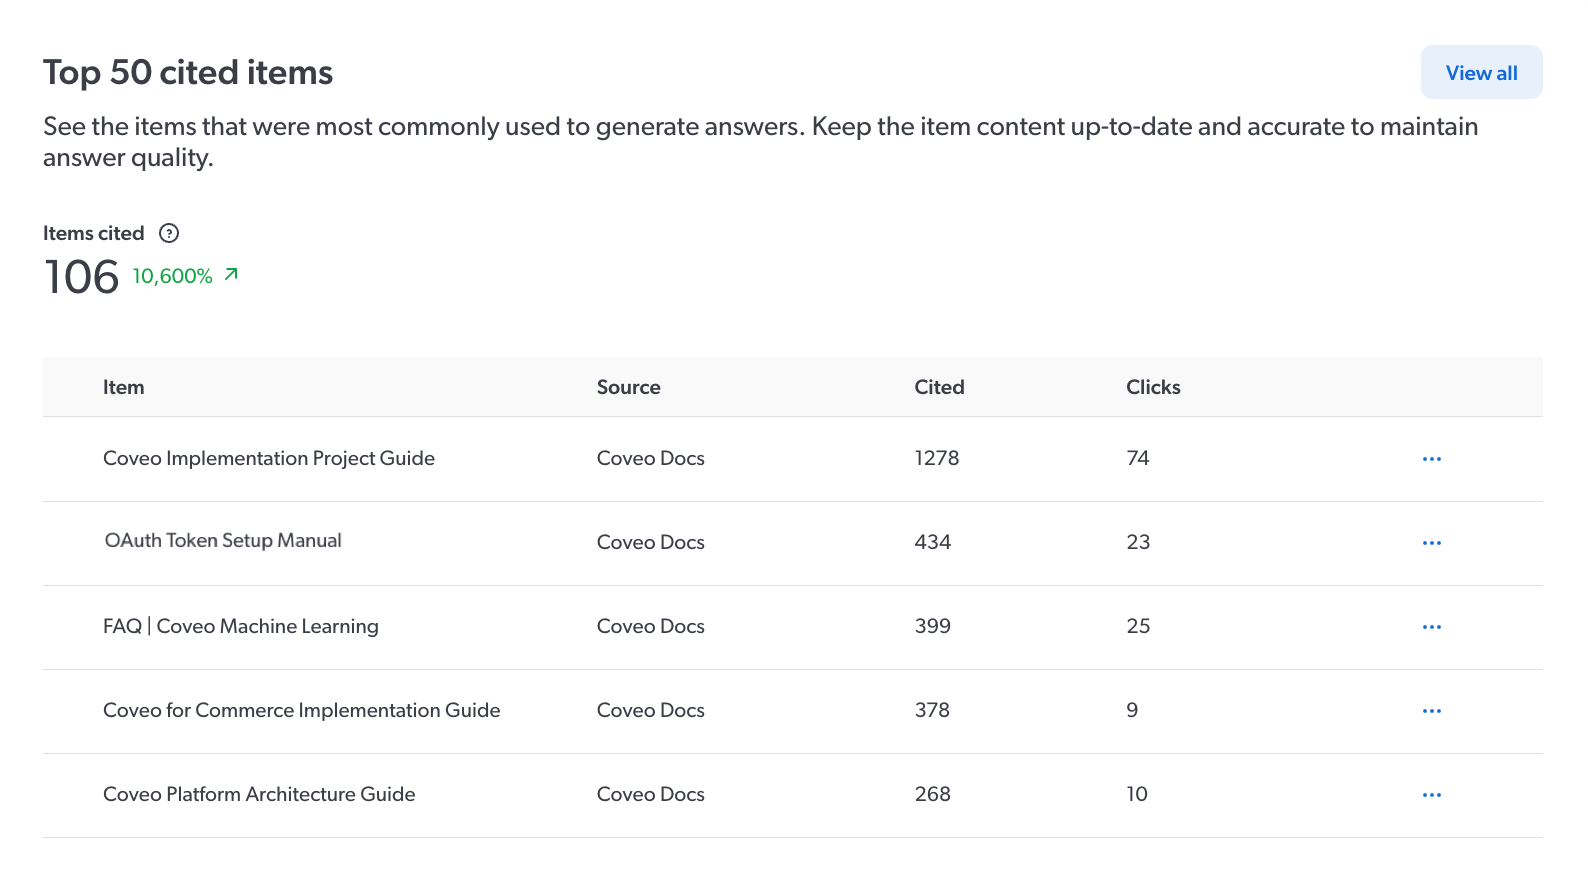
The more frequently an item is cited, the more critical it is to keep the item’s content up-to-date and accurate. Conversely, an item that is rarely cited may indicate outdated or less relevant content, which could make the item a candidate for review.
| Metric | Description | ||
|---|---|---|---|
Items cited |
Total number of unique indexed items cited in generated answers. |
||
Item |
The title of the unique indexed item.
|
||
Source |
The name of the source in your Coveo organization that contains the indexed item. |
||
Cited |
Total number of times the item was cited in generated answers. If an item is cited multiple times in a single generated answer, each citation counts separately. |
||
Clicks |
Total number of times the item citation was clicked to open the item. If a citation is clicked multiple times in a single generated answer, it counts as a single click. |
|
|
Note
An item’s |
|
|
Citations appear in the RGA component to indicate the source of the information that was used to generate the answer. The Engagement card’s Click-through rate on citations metric tracks user interactions with these citations. |
To view the item details
You can view the details for any item in the list using the Content Browser in the Coveo Administration Console.
-
Click
next to the item, and then click Open in Content Browser.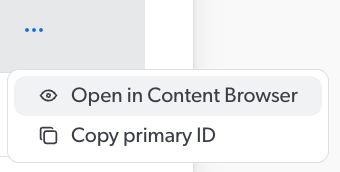
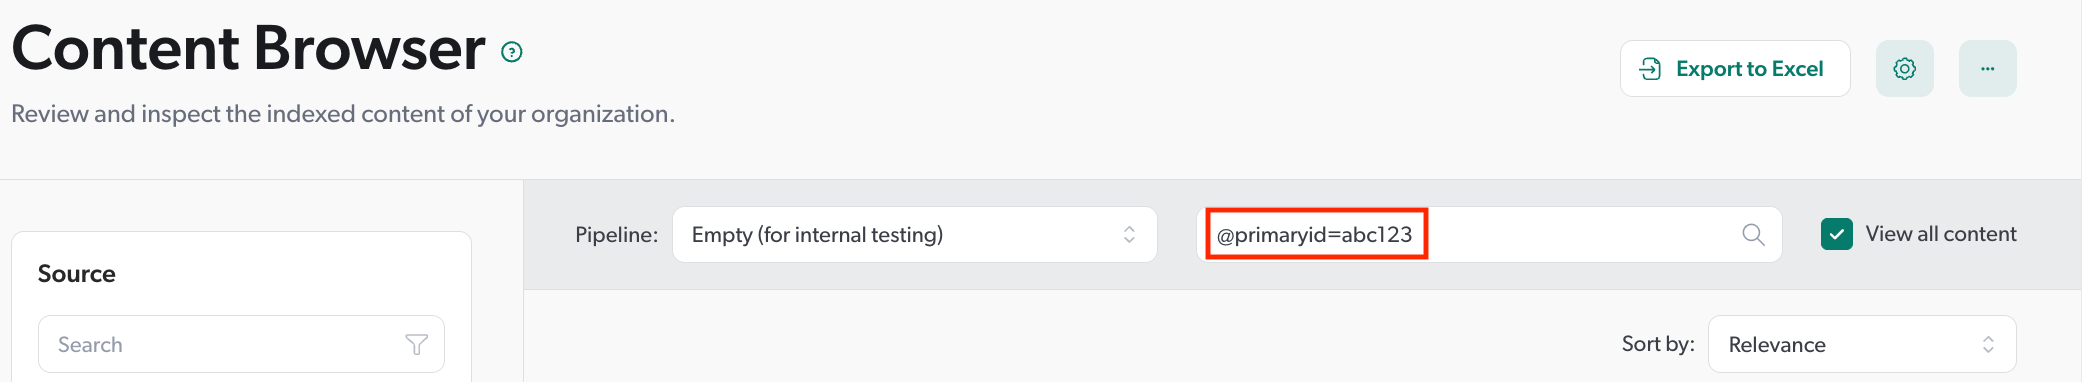
The Content Browser opens in a new browser tab, with the item in the search result.
-
In the Content Browser, double-click the item to view the item properties.
|
|
Notes
|
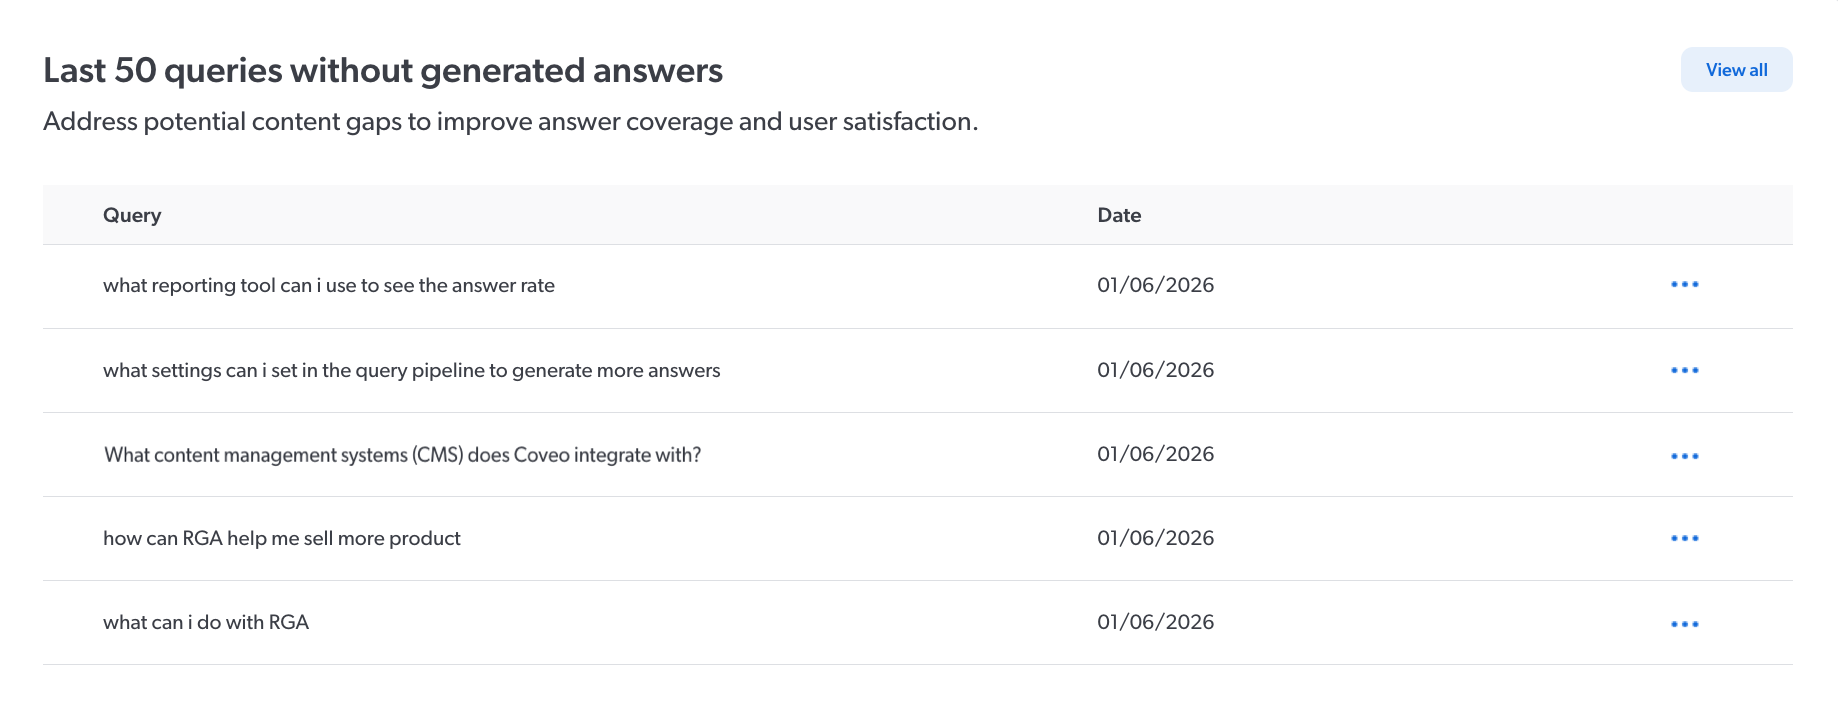
Last 50 queries without generated answers
The Last 50 queries without generated answers card lists the last 50 queries for which an answer wasn’t generated.
To better understand why an answer wasn’t generated for a query, you can inspect the chunks that were retrieved for the query. Click View all to see the complete list.
|
|
Notes
|
To inspect the chunks that were retrieved for the query
If you have the required privileges, you can launch the Chunk Inspector directly from the list of queries to inspect the chunks that were retrieved for the query. When an answer isn’t generated, inspecting the chunks that were retrieved for a query can provide you with information that you can then use to make adjustments to improve your answer rate.
-
Click
next to the generated answer, and then click Inspect.
The Chunk Inspector opens in a new browser tab, and runs automatically based on the generated answer’s answer ID.
Click Copy answer ID to copy the answer ID to your clipboard, such as to use in the Chunk Inspector later, or for troubleshooting with Coveo Support.
-
In the Chunk Inspector, review the chunk details that appear.
-
(Optional) Use the information in the Chunk Inspector to improve your RGA implementation.
ExampleWhile inspecting the chunks that were retrieved for a query, you notice that relevant chunks were retrieved, but they weren’t sent to the LLM for answer generation because the chunks didn’t meet the chunk relevancy threshold. A potential solution might be to lower the chunk relevancy threshold.
Required privileges
The following table indicates the privileges required to access the Coveo Knowledge Hub, and view elements of the GenAI Performance dashboards and associated panels (see Manage privileges and Privilege reference).
|
|
The Allowed access level on the GenAI analytics domain allows the member to view metrics related to all RGA implementations in your organization. The View access level on the GenAI analytics index content domain exposes index content that the member may not otherwise have access to through the repository’s permission system. Exercise caution when granting these privileges to members. |
| Action | Service - Domain | Required access level |
|---|---|---|
Access the Coveo Knowledge Hub |
Knowledge - Knowledge hub |
Enable |
Organization - Organization |
View |
|
Access the GenAI Performance dashboards |
Knowledge - GenAI analytics |
Allowed |
View content in the GenAI Performance dashboards pertaining to indexed items (Top 50 cited items and Generated answers with feedback cards) |
Knowledge - GenAI analytics index content |
View |
Inspect the segment of text (chunks) when analyzing the Generated answers with feedback and Last 50 queries without generated answers cards |
Knowledge - Chunk inspector |
Allowed |