Data exports
Data exports
The Coveo Usage Analytics (Coveo UA) reports offer many features allowing you to monitor and measure the usage of your Coveo search solution. However, when you want to perform custom data processing, create other reporting formats, or integrate UA data into corporate reporting systems, you first need to perform a UA data export.
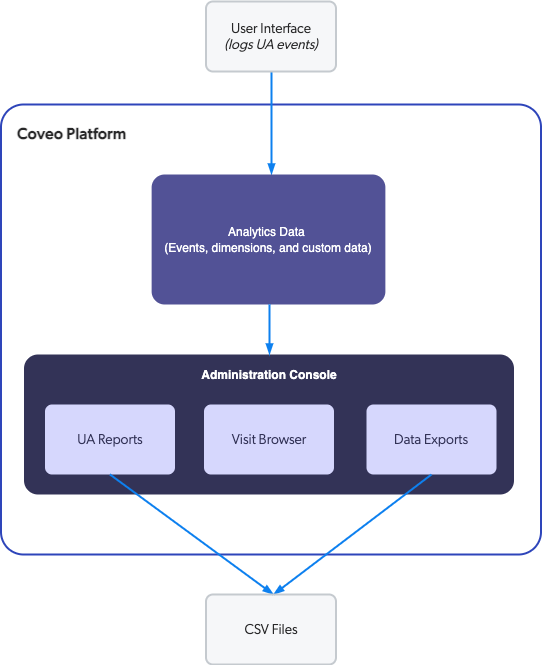
As the schema below illustrates, analytics data is gathered from user interfaces such as case creation panels and search pages that log UA events. This data can be reviewed in the Coveo Administration Console, either in Coveo UA reports or in the Visit browser (platform-ca | platform-eu | platform-au) page, in which you can follow the user journey on your web pages (see Review and manage dashboards, Review and manage explorers, and Review user visits with the Visit Browser).

You can export any data found in the reports or from the Visit Browser. On the Data Exports tab of the Raw Data (platform-ca | platform-eu | platform-au) page, you can also export specific data to one or more comma-separated value (CSV) files for a given time interval. You can then import the data in a spreadsheet or any other data analysis application for more reporting and analysis purposes.
Export methods
You can export UA data using different methods:
Manual export
On the Data Exports tab of the Raw Data (platform-ca | platform-eu | platform-au) page, you can create a manual export in the Create CSV Export panel. Once the export is completed, you can download it in the Action bar.
You can also manually export the data of any UA explorer or report card as a CSV file.
Automatic scheduled export
On the Data Exports tab of the Raw Data (platform-ca | platform-eu | platform-au) page, you can schedule your exports in your Coveo organization to extract data by day, week, or month. The export will be separated in many CSV files.
Manual visits export
On the Visit browser (platform-ca | platform-eu | platform-au) page, you can download all your visit data in your Coveo organization, which will then be saved in the Data Exports tab of the Raw Data (platform-ca | platform-eu | platform-au) page. All events are recorded in one CSV file,
You export the click events that occurred in the past week on your search hub. You then open the downloaded file in a spreadsheet application to see the metadata (for example, the exported dimension values) related to each click event (see What’s the Database Schema of the Different Tables That I See When Doing an Export?).

Usage Analytics Read API
Instead of using the Administration Console, you can create exports using the Usage Analytics Read API as it exposes the /exports endpoints.
For steps on how to use the Read API for data exports, see Create and retrieve data exports
What’s next?
-
Learn more about data export management.
-
Filter your reports with selected dimensions to get more precise data.