Use the Debug Panel
Use the Debug Panel
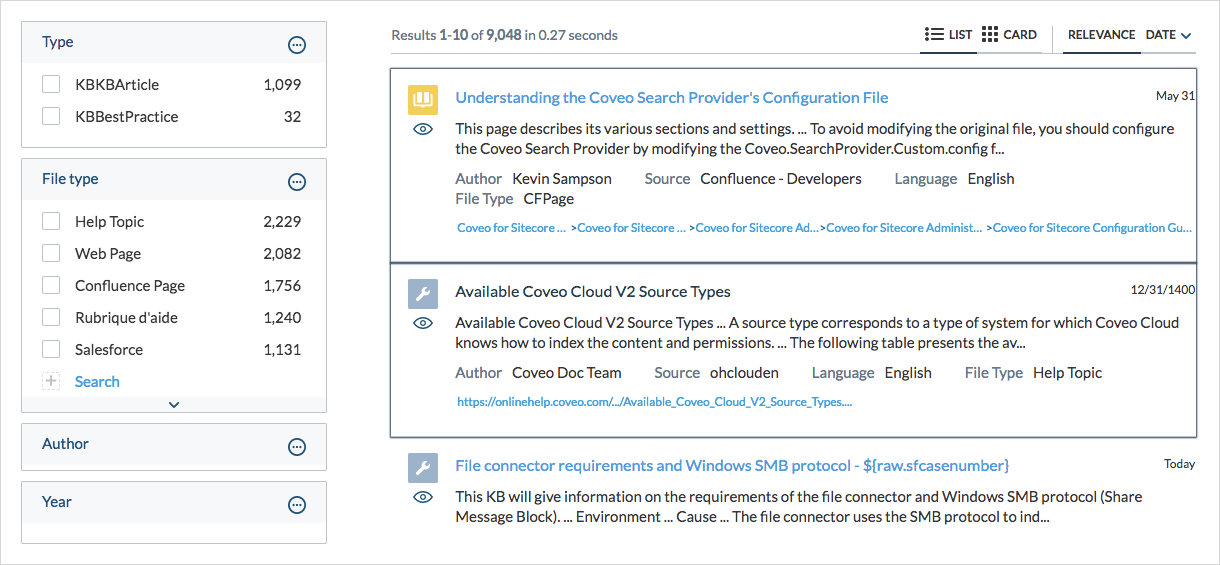
You can use the Coveo JavaScript Search Framework Debug Panel to get detailed information about specific results or component instances in your search page (for example, a result in the ResultList, a certain Facet, etc.). The information includes at least the component options and their values.

The panel can present information in several expandable sections for some components and results.

The Debug Panel is particularly useful in the following situations:
-
Investigating relevance issues in search results (see rankingInfo section).
-
Validating that a search result template has been correctly applied (see template section).
-
Verifying which query pipeline is applied to a specific search result (see result section).
-
Consulting field values for a search result (see fields section).
-
Consulting component options without using the browser developer console (see Component sections).
|
|
Note
All of the information presented in the Debug Panel is also available through the browser developer console. The Debug Panel gives quick and convenient access to a collection of handpicked information. |
Accessing the Debug Panel for a given component or result
-
Hover over the Coveo JavaScript Search Framework page component or result for which you want to get detailed information.
-
Select and hold Alt (Windows) or Option (Mac) and then double-click the component or result.
The Debug Panel opens with detailed information about the double-clicked element.
Closing the Debug Panel
There are many ways to exit the Debug Panel:
-
Click anywhere outside the modal of the Debug Panel.
-
On the keyboard, select the Esc key.
-
In the Debug Panel, click anywhere in the header section.
Depending on your Coveo JavaScript Search Framework version, you might need to click a non-clickable area of the header to close the Debug Panel.
Debug Panel header
The Debug Panel header is the grey horizontal bar at the top of the panel.

The header offers the following features:
-
Highlight recommendation checkbox
Select the Highlight recommendation checkbox to highlight results boosted by Automatic Relevance Tuning (ART) models (see About Automatic Relevance Tuning). In the results section of the Debug Panel, you can also determine if a search result has been boosted when its
isRecommendationvalue is set totrue.
-
Enable query debug checkbox
Check this box to fill the rankingInfo expandable section with detailed ranking weights. In the results section, the rankingInfo subsection gets simultaneously populated with the same data, but with a lesser degree of formatting.
-
Enable query syntax in search box checkbox
Check this box to override
data-enable-query-syntaxvalue and set it totrue(see enablequerysyntax). This action enables the use of query syntax directly in the search box. -
Request all fields available checkbox
When
auto-select-fields-to-includeis set totruein the ResultList (see autoSelectFieldsToInclude), the fields section of the Debug Panel is populated only with the necessary fields to render all results. Check the Request all fields available checkbox to consult the complete list of available fields. -
Search in debug text box
Enter a keyword in this box and select Enter to filter the Debug Panel content and quickly find needed information.
-
Download trigger link
Click the Download link in the upper-right corner of the panel to automatically download the Debug Panel content in JSON format. You can now review the JSON locally on your machine using the text editor of your choice.
Debug Panel expandable sections
Each component or result gives access to a different set of information in the Debug Panel. For example, selecting and holding Alt (Windows) or Option (Mac) and double-clicking a result provides different categories such as result, fields, rankingInfo, template, ResultList, all of which are expandable.
result section
When expanding the result section, you get access to relevant information such as ClickUri, PrintableUri, percentScore, pipeline and score.
|
|
In the result section, the raw subsection gives the exact same information as the fields section with some elements formatted differently for a better readability. |
You apply a pipeline and you want to validate that it has been used in your search page.
-
Select and hold Alt (Windows) or Option (Mac) and double-click any result to open the Debug Panel.
-
Type the word
pipelinein the Search in debug filter box. -
Select Enter and expand the result section to see if your pipeline has been applied correctly.

-
If your pipeline isn’t applied to the search result, apply the pipeline to your source (see Apply an extension to a source).
-
If your pipeline is applied to the result and is still ineffective, make modifications to the pipeline (see Manage query pipelines with the Search API).
-
fields section
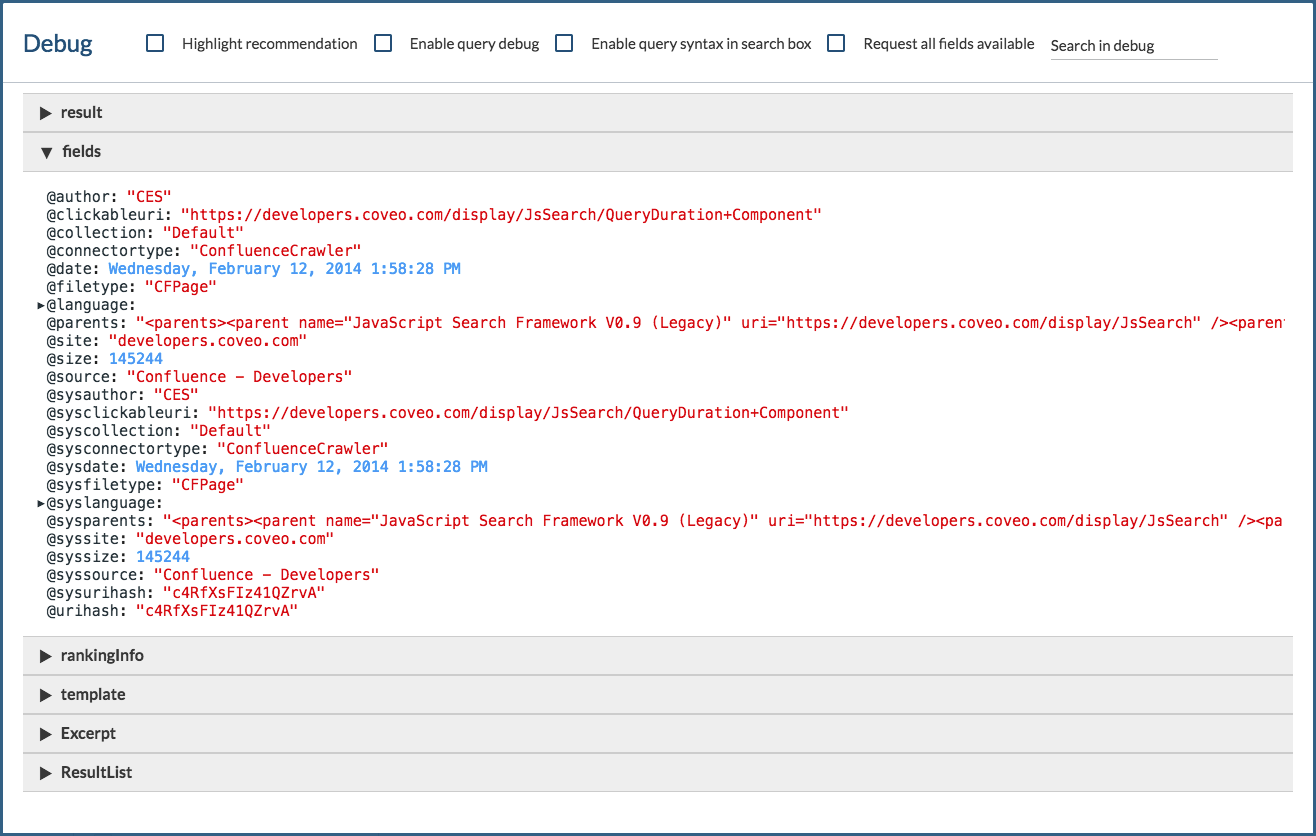
The fields section contains at least the necessary fields to render the search page results expressed as key-value pairs (see Request all fields available).
When Request all fields available is checked or when data-auto-select-fields-to-include option is set to true, the fields section is a complete list of all metadata mappings for this particular result.
You want to validate that the metadata related to the author has been mapped correctly to the field @author.
-
Select and hold Alt (Windows) or Option (Mac) and double-click any result to open the Debug Panel.
-
Expand the fields section.
-
Search the value associated with the key
@authorto validate the data.
rankingInfo section
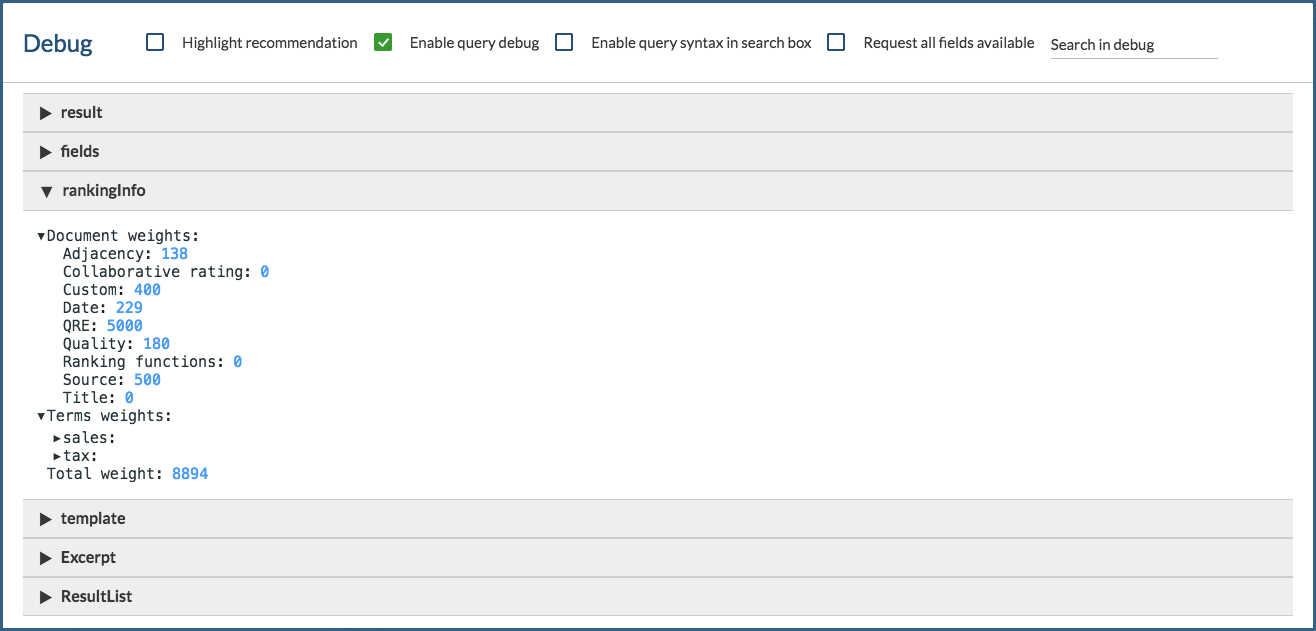
When expanding the rankingInfo section, you get detailed information on Total weight, which is the sum of Document weights and Terms weights [1] (see About search result ranking). Since the more weight a result has, the higher it appears in the results list, this information is useful when investigating relevance issues in search results. Each of these ranking factors can be customized, together with the number of results in each index ranking phases (see Manage ranking weight rules).
A query for sales tax returns unsatisfying results.
-
Select and hold Alt (Windows) or Option (Mac) and double-click a result that needs to be fixed.
The Debug Panel opens.
-
Expand the rankingInfo section (selecting Enable query debug checkbox is mandatory to fill the section with values).
-
Expand the Document weights subsection to consult given weights.[2] [3]

query ranking expressions (QREs) can also significantly affect search results ranking, which can lead to relevance issues (see Manage ranking expression rules). The QRE item weight for an item is viewable under the Document weights subsection of the debug panel, beside QRE.
You want to promote ACME monitors in a Coveo-powered commerce portal.
In the portal’s query pipeline, you define a ranking expression rule that adds a positive modifier to the ranking score for each result item whose @brand field value is ACME when the query contains the terms monitor or screen.

A user accesses the commerce portal and submits the following query: globex computer screen.
Even though the user is apparently searching for Globex-brand monitors, your ranking expression rule is likely to make ACME monitors appear higher in the result list.
template section
When expanding the template section, you get detailed information on the applied result template for a specific result.
You apply a template on all youtubevideo and your template has not been applied correctly to a certain result.
-
Select and hold Alt (Windows) or Option (Mac) and double-click the
youtubevideoresult that needs to be fixed.The Debug Panel opens.
-
Expand the template section to see if the right template has been applied to your result.

-
If your template isn’t applied to the search result, bind it correctly (see About the condition evaluation mechanism).
-
If your template is applied to the result and is still ineffective, modify the template.
-
Component sections
When you select and hold Alt (Windows) or Option (Mac) and double-click any component, the component section appears in the Debug Panel.
If the double-clicked component sits inside a result template, all result-related sections appear in the Debug Panel as well as the component section.
All component sections are filled with their own component options (see Coveo JavaScript Search Framework - Reference Documentation).
-
If the double-clicked component is the Excerpt, when expanding this section, you get a No options response since the Excerpt component doesn’t have options (see Coveo Excerpt Component).

When you select and hold Alt (Windows) or Option (Mac) and double-click the
Iconsitting inside a result template, all result-related sections appear in the Debug Panel as well as theIconsection.
Troubleshooting
If the JavaScript Debug Panel doesn’t open, you might want to look at the following solutions:
-
Enabling the Debug Panel.
The Debug Panel is enabled by default, but a search page administrator or developer can disable it. Ensure that the panel is enabled in the
SearchInterfacecomponent by setting theenableDebugInfooption totrue. -
Selecting a non clickable area to open the panel while selecting and holding Alt (Windows) or Option (Mac) + double-clicking action.
To open the Debug Panel, you should select and hold Alt (Windows) or Option (Mac) and preferably click twice on a non clickable area of the component or result. Performing this action on a clickable area could change the query parameters or prevent the Debug Panel to open.
-
Updating to a newer version of the Coveo JavaScript Search Framework.
Some older versions of the Coveo JavaScript Search Framework don’t support the use of the Debug Panel and return the following error message:
CoveoJsAdmin.Common.Dependencies.min.js:41 Uncaught TypeError: Cannot read property '1' of null(...)Versions prior to v1.1865.18 should be updated to a newer one.
Missing on search results when a query is too vague for the index to compute a Document weight. For example, this can happen when an empty query is performed.
Missing.
Custom weight factor always has a value of 350. Since this value is the same for all items that are returned for a query, this score doesn’t affect item ranking.