Inspect your query pipeline and rules
Inspect your query pipeline and rules
A query pipeline is a set of rules that modifies user queries before they reach the index.
You can manage query pipelines on the Query Pipelines (platform-ca | platform-eu | platform-au) page of the Coveo Administration Console.
If you have multiple search interfaces to serve distinct users and purposes, your Coveo organization may contain several query pipelines.
|
|
Leading practice
Have a separate query pipeline for every search interface. |
This article provides testing guidelines for the most common query pipeline components in a Coveo-powered search implementation.
|
|
This guide provides guidelines to analyze, review, and test different aspects of a Coveo-powered implementation. It shouldn’t be considered an official, definitive guide to testing an implementation before it goes live, but rather a guide showcasing the basic components that Coveo implementations typically include. Every Coveo implementation is different and may require custom configuration. Therefore, you may notice discrepancies between the components and features listed in this guide and those you’re using in your actual implementation. If you encounter issues, or have any questions related to this article, contact Coveo Support for help. |
Access your browser’s network monitoring tool
-
Open your web browser’s developer tools.
 Note
NoteThis article uses the Google Chrome developer tools. For browser-specific information, see:
-
Select the Network tab.
Query routing
You should ensure that queries are directed to the right query pipeline for every search interface.
-
Access the search interface in which you want to test query routing.
-
In the search box, perform a query.
-
Enable debugging mode by appending
&debug=trueto the current URL.
-
In the network monitoring tool, under the Name column, select the latest request to the Search API. The request path should contain
/rest/search/v2. -
Select the Preview tab.
-
Find the
pipelineproperty. Its value should correspond to the name of the query pipeline to which queries originating from this search interface must be routed.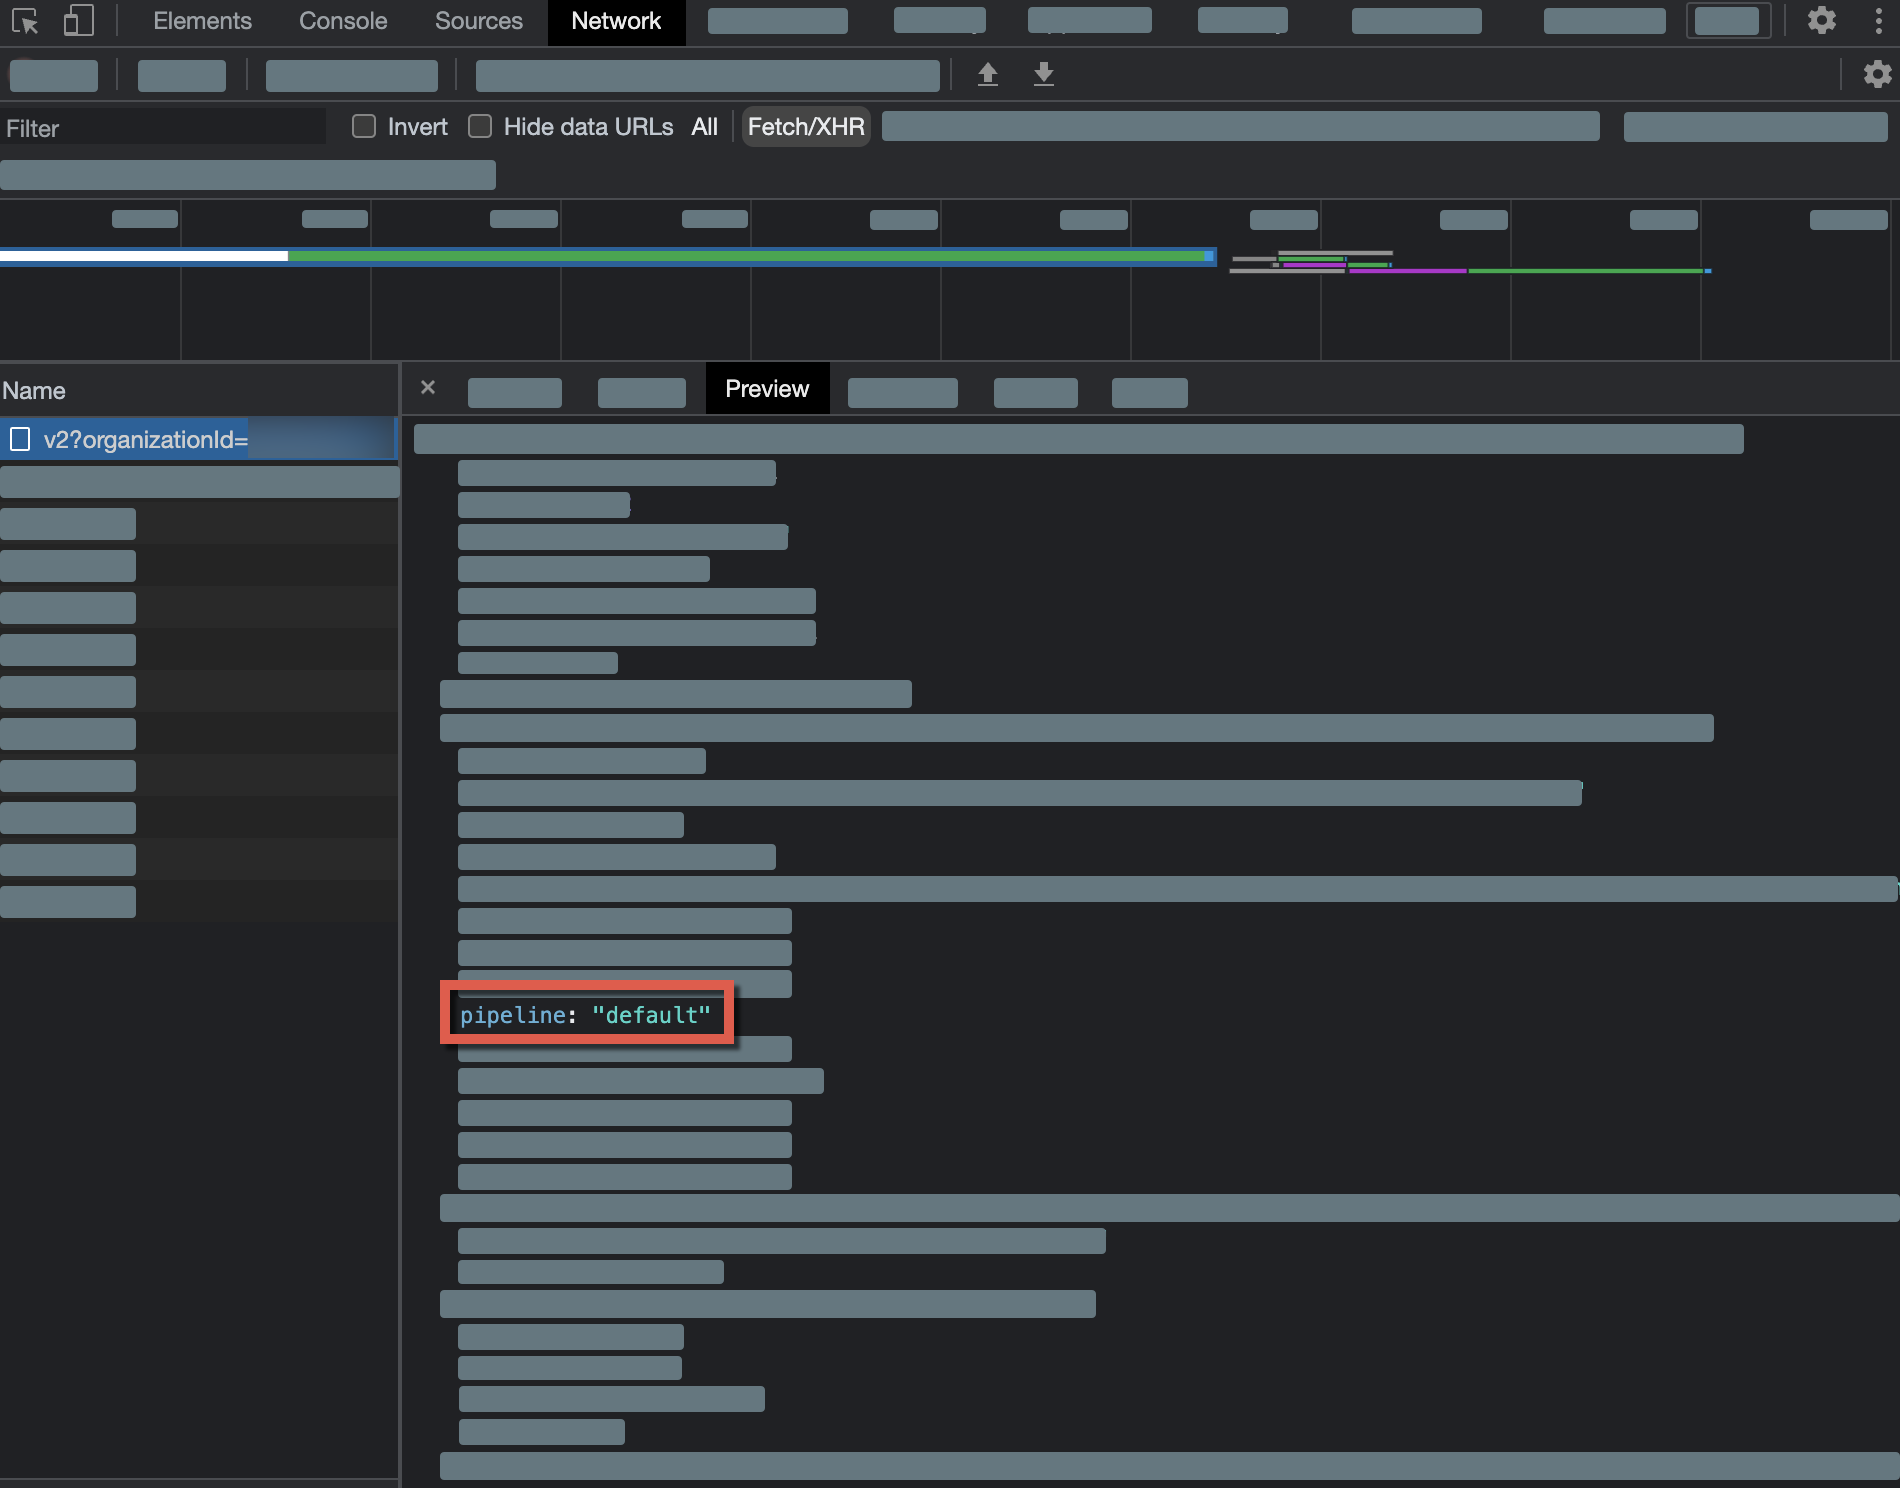
-
Access the Relevance Inspector:
-
If your search interface leverages the Atomic library, select and hold Alt (Windows) or Option (Mac) and double-click any search interface element.
-
In the modal that appears, select
Open, and you’ll be redirected to the Coveo Administration Console. You may have to wait for your query to load.
NoteYou can go directly to the Relevance Inspector (platform-ca | platform-eu | platform-au) page of the Coveo Administration Console. If you do, you’ll need to rerun the query in the Relevance Inspector using the query’s
SearchUid. You can find this value on the Preview tab of your network monitoring tool:
-
-
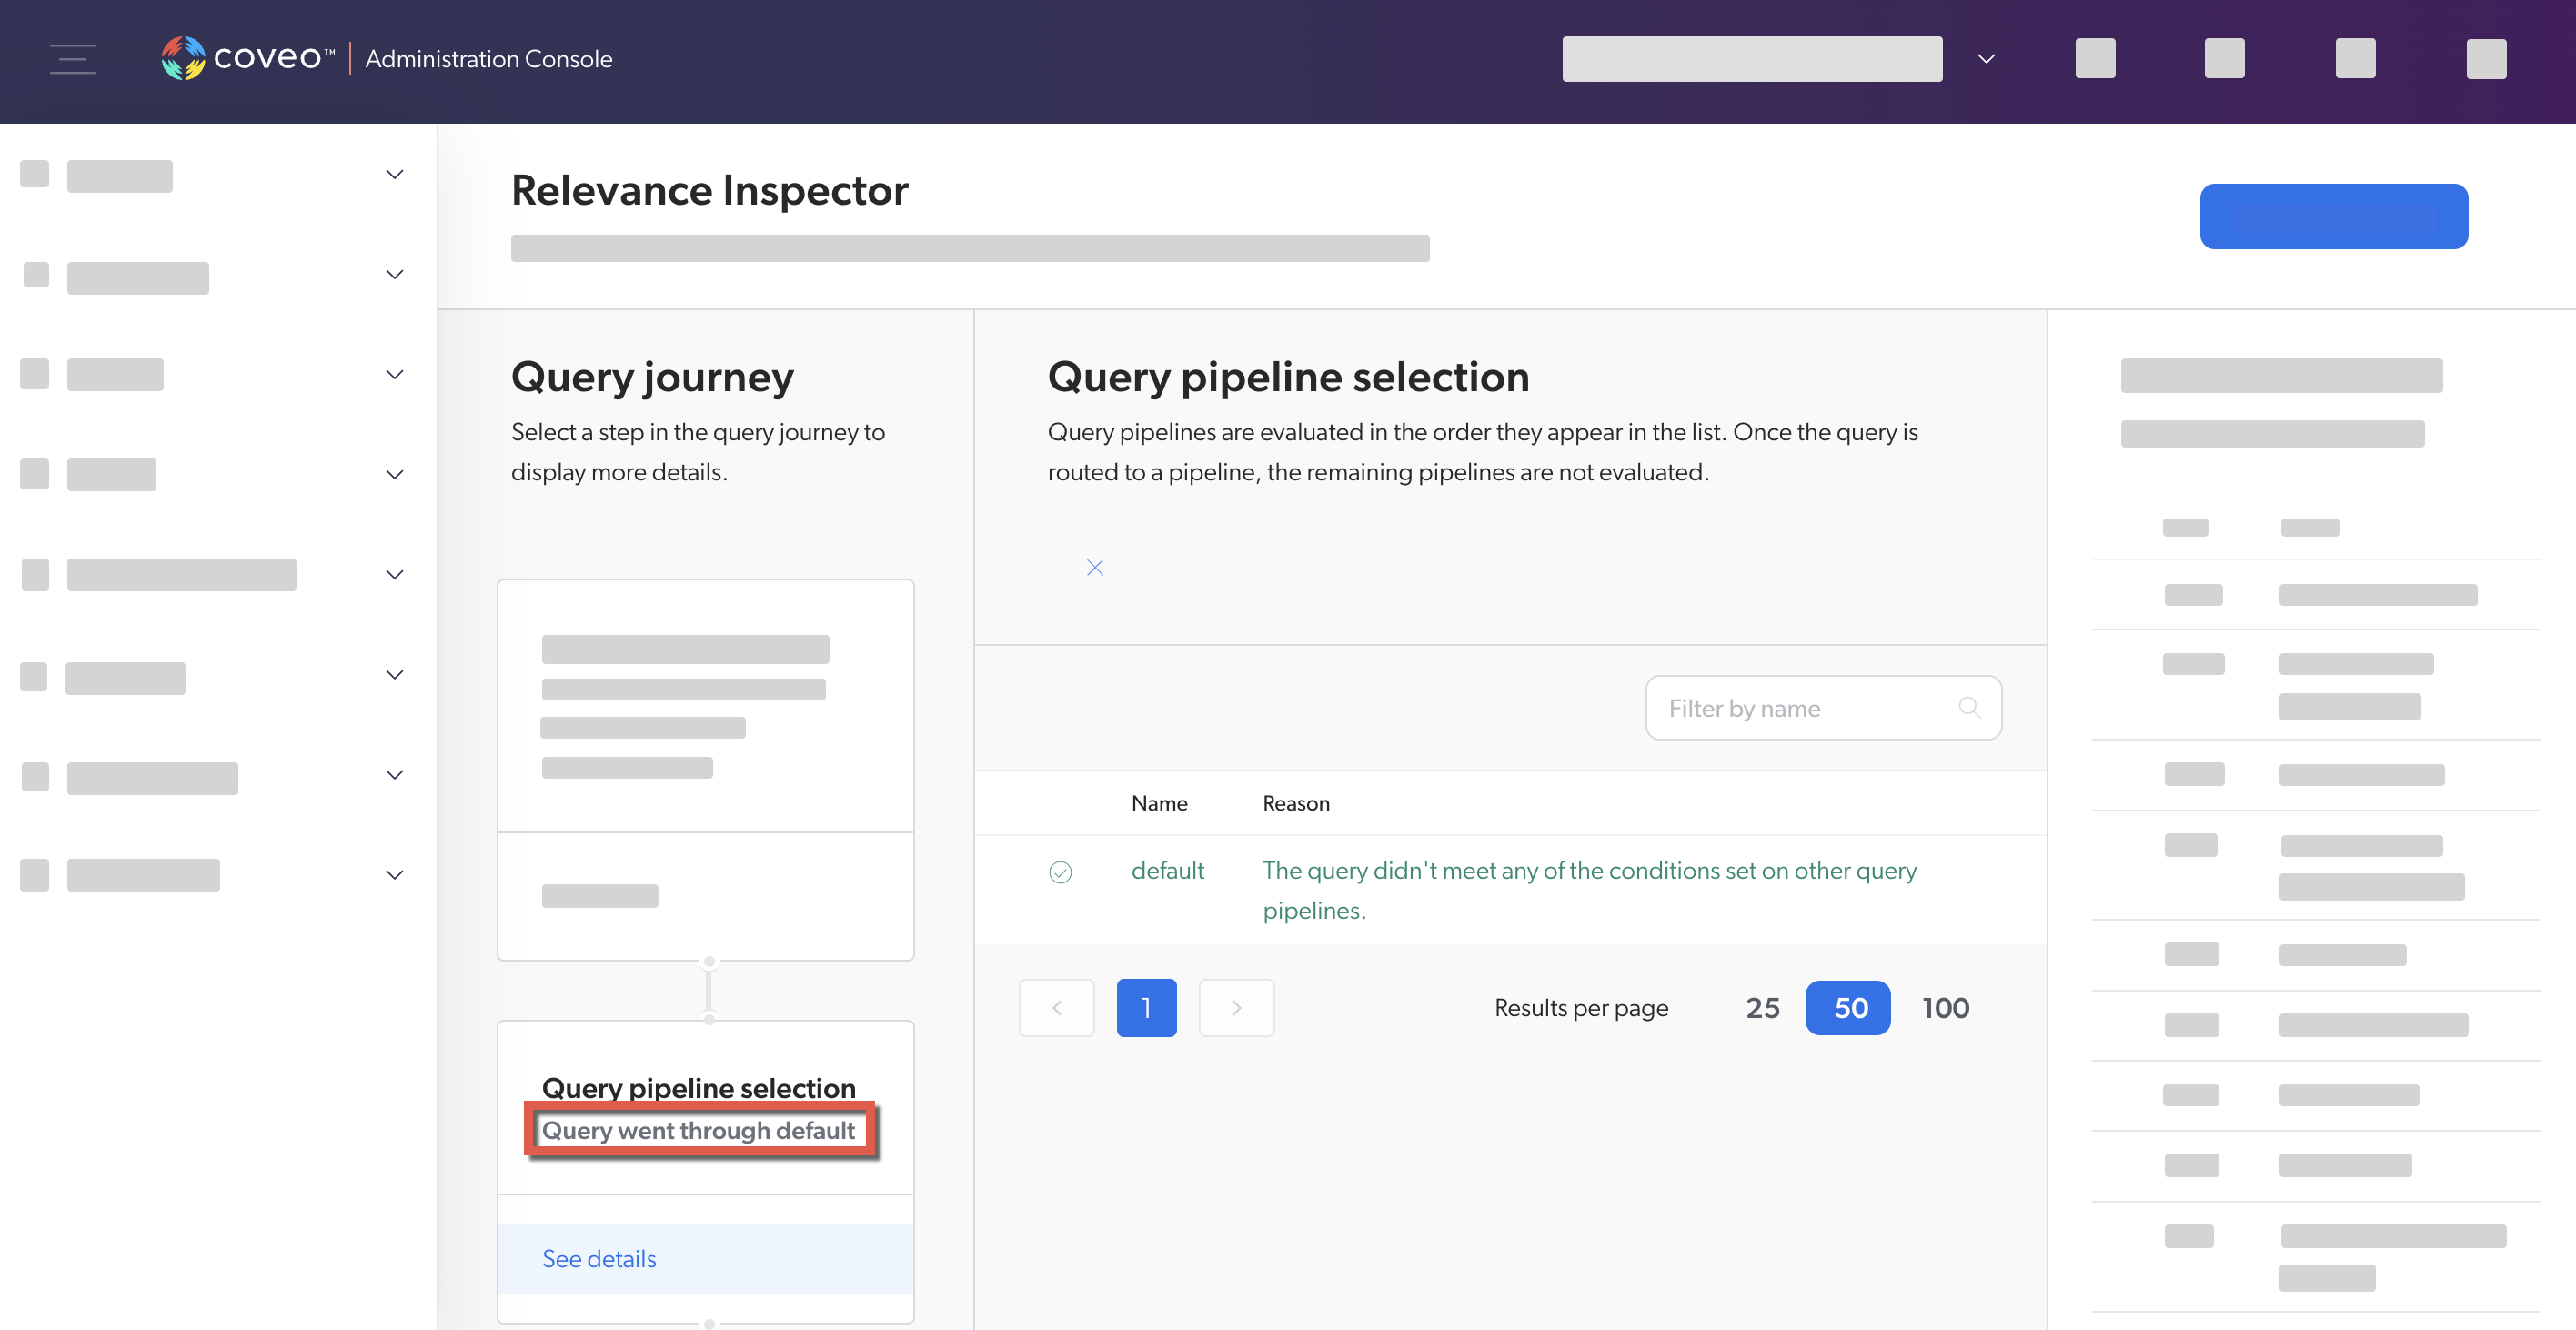
In the Relevance Inspector, the pipeline is displayed under Query pipeline selection (the second step in the Query journey). Click See details for more information about the pipeline through which the query was routed.
Thesaurus
Query pipeline thesaurus rules let you define lists of synonyms to help users find relevant results when they search for specific terms.
If a query pipeline contains thesaurus rules, review its configuration and test several entries in a search interface to ensure that the rules work as expected.
Review thesaurus rules configuration
-
On the Query Pipelines (platform-ca | platform-eu | platform-au) page of the Administration Console, select the query pipeline for which you want to review thesaurus rules configuration. Then, in the Action bar, click Edit components.
-
Select the Search terms tab, and then click Thesaurus.
-
Validate the thesaurus rules' configuration and associated conditions.
Test thesaurus rules in a search interface
-
Access the search interface in which you want to test a thesaurus rule.
-
In the search box, perform a query that would trigger a thesaurus rule.
-
Enable debugging mode by appending
&debug=trueto the current URL.
-
In the network monitoring tool, under the Name column, select the latest request to the Search API. The request path should contain
/rest/search/v2. -
Select the Preview tab.
-
Find and expand the
executionReportproperty, and then expand thechildrensub-property. -
Expand the
PreprocessQueryExpressionproperty, and then expand thechildrensub-property. -
Check for a
ApplyThesaurusFeaturevalue. If you see a value for theappliedsub-property, this means that a thesaurus rule was applied and modified the query. -
Expand the
appliedsub-property to see the definition of the rule that was applied.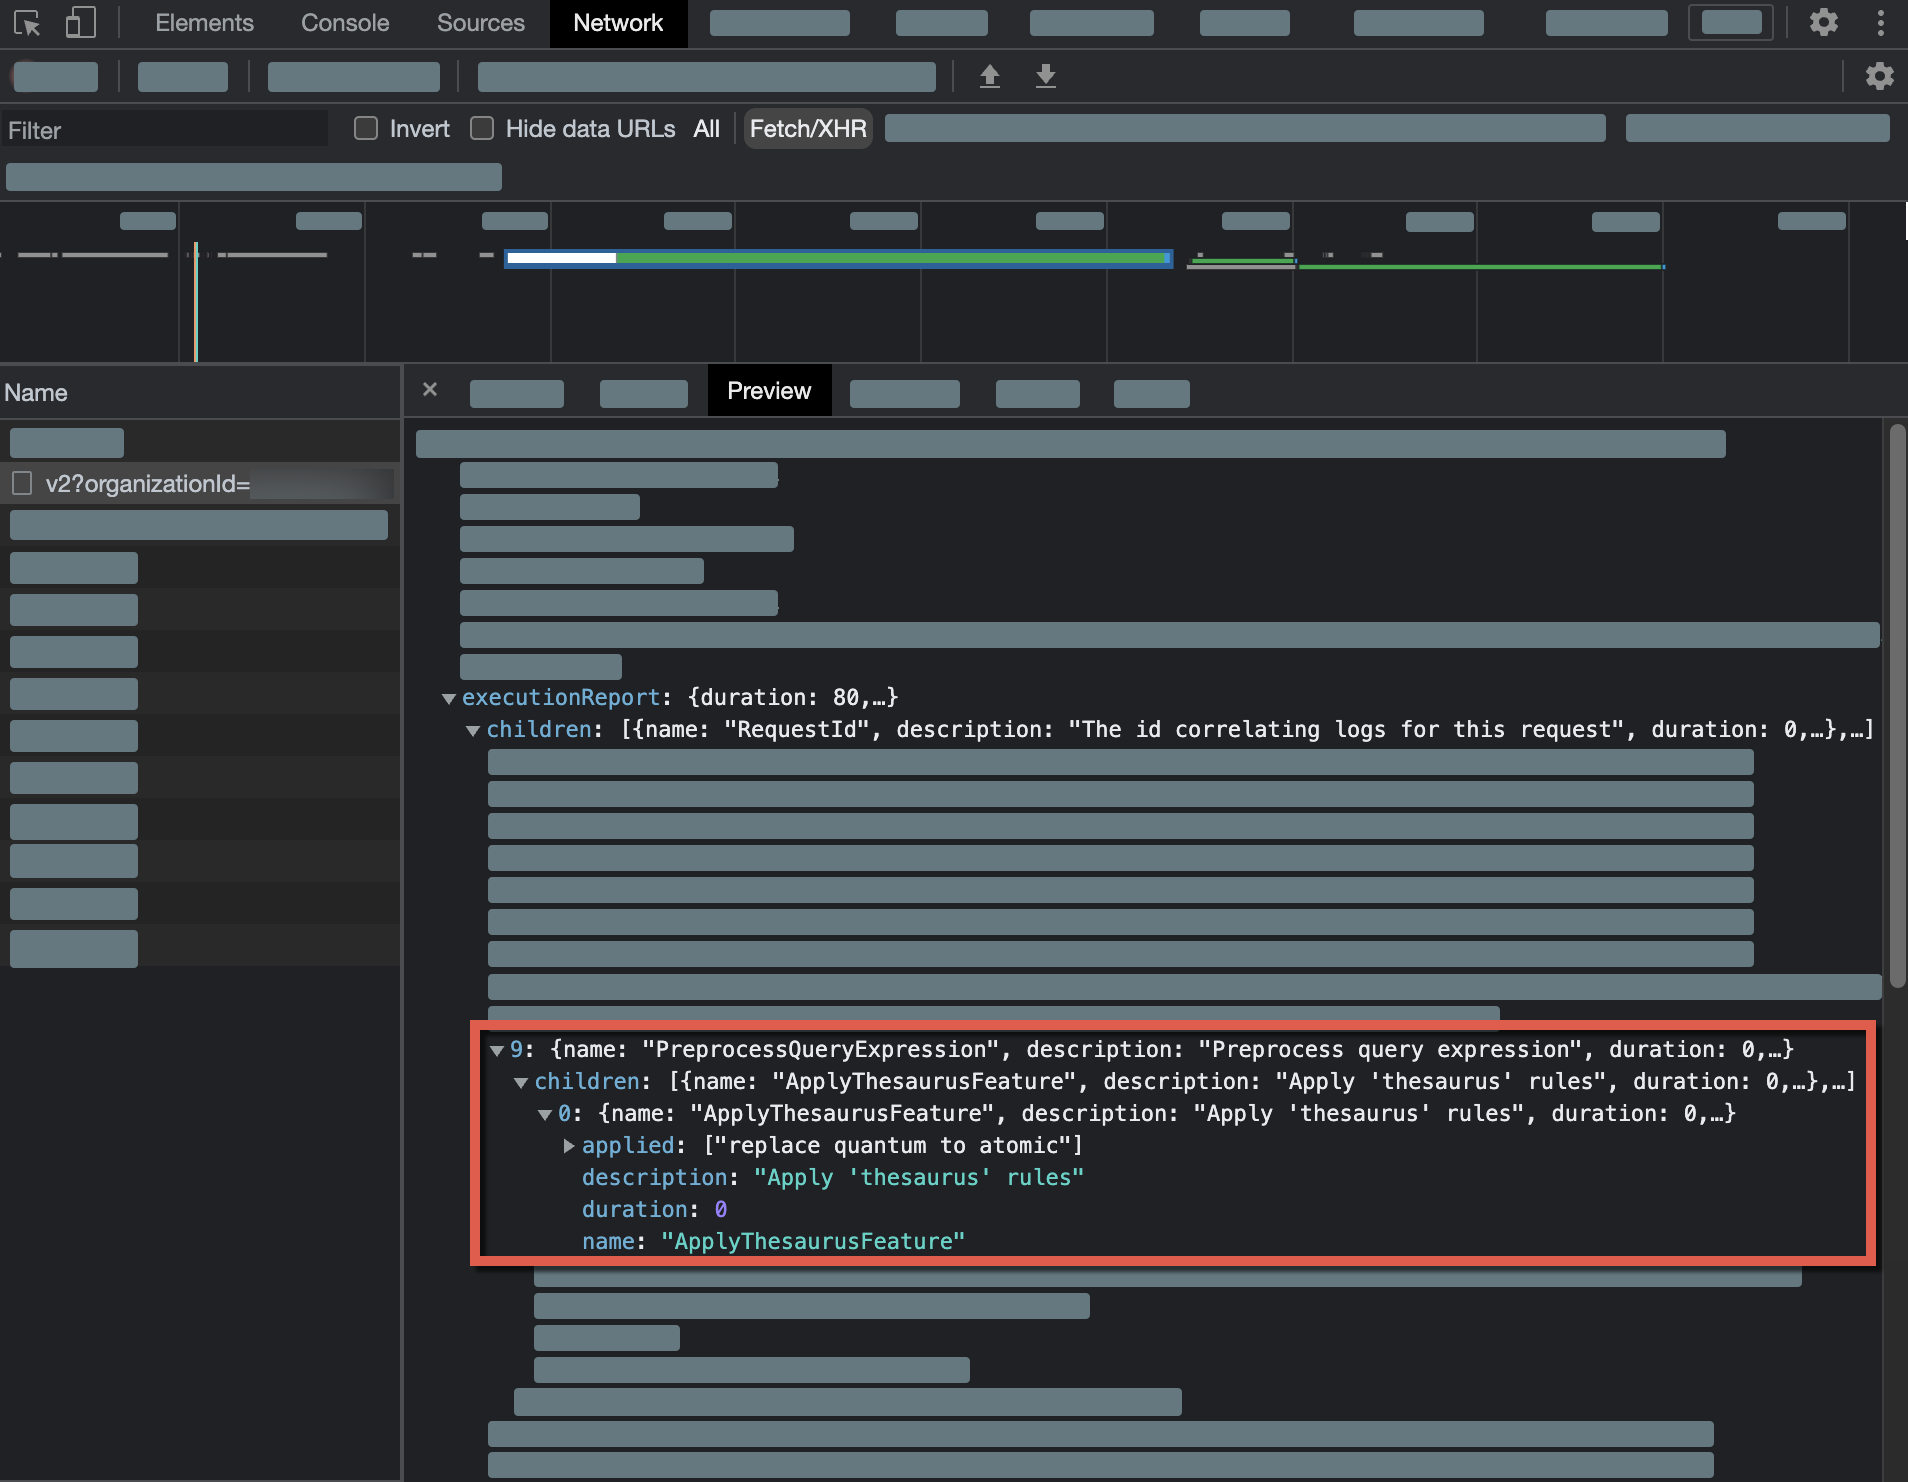
-
By expanding the
resultproperty, you can also see both the query that was initially sent (in) and the query modified by the thesaurus rule (out).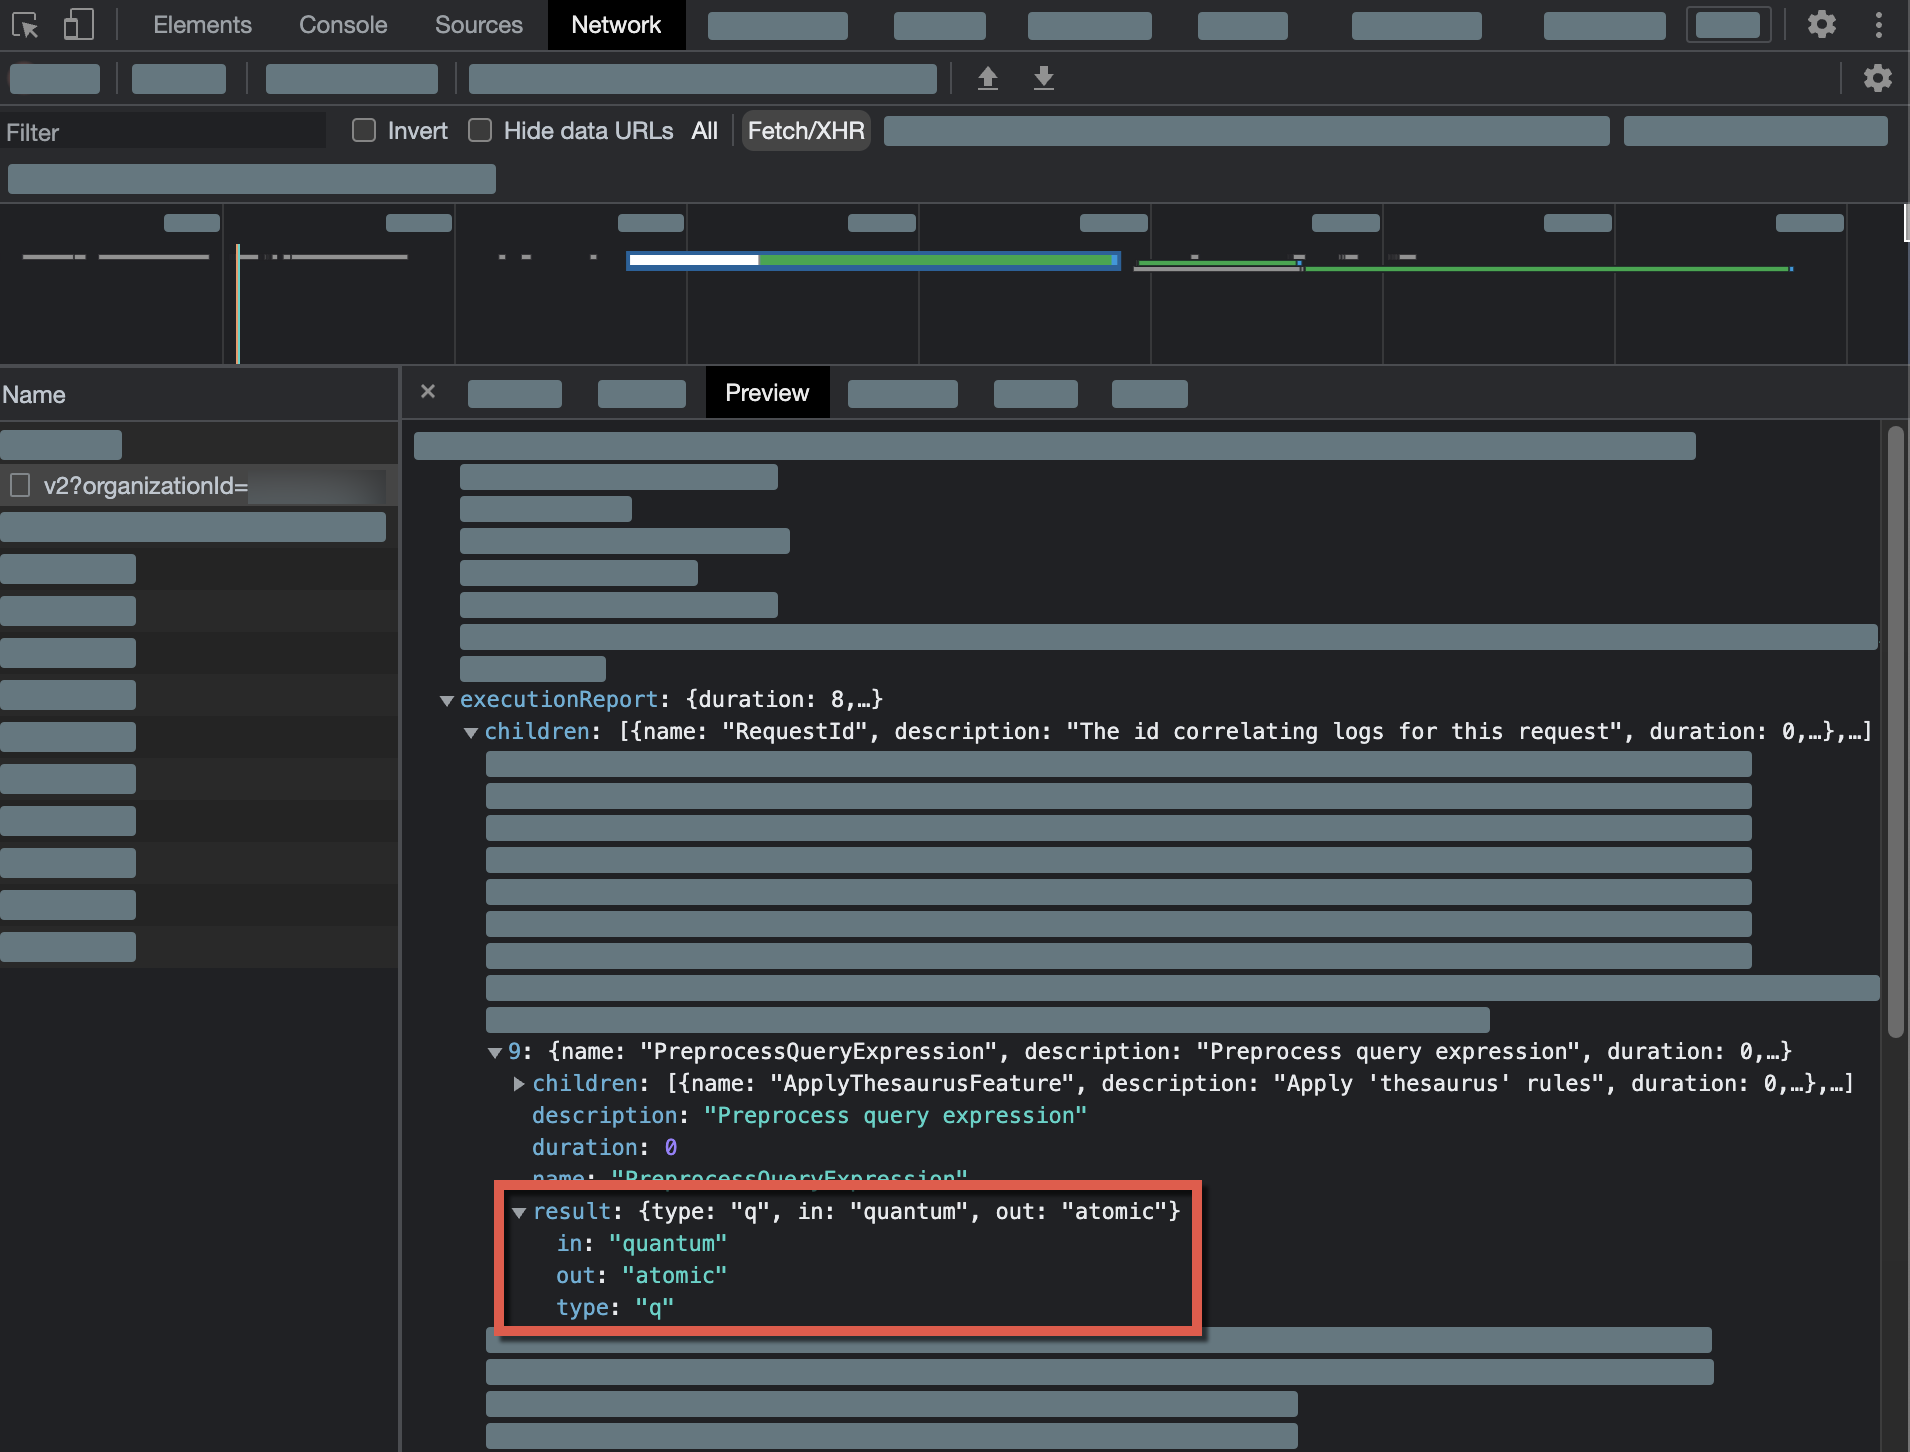
-
Access the Relevance Inspector:
-
If your search interface leverages the Atomic library, select and hold Alt (Windows) or Option (Mac) and double-click any search interface element.
-
In the modal that appears, select
Open, and you’ll be redirected to the Coveo Administration Console. You may have to wait for your query to load.
NoteYou can go directly to the Relevance Inspector (platform-ca | platform-eu | platform-au) page of the Coveo Administration Console. If you do, you’ll need to rerun the query in the Relevance Inspector using the query’s
SearchUid. You can find this value on the Preview tab of your network monitoring tool:
-
-
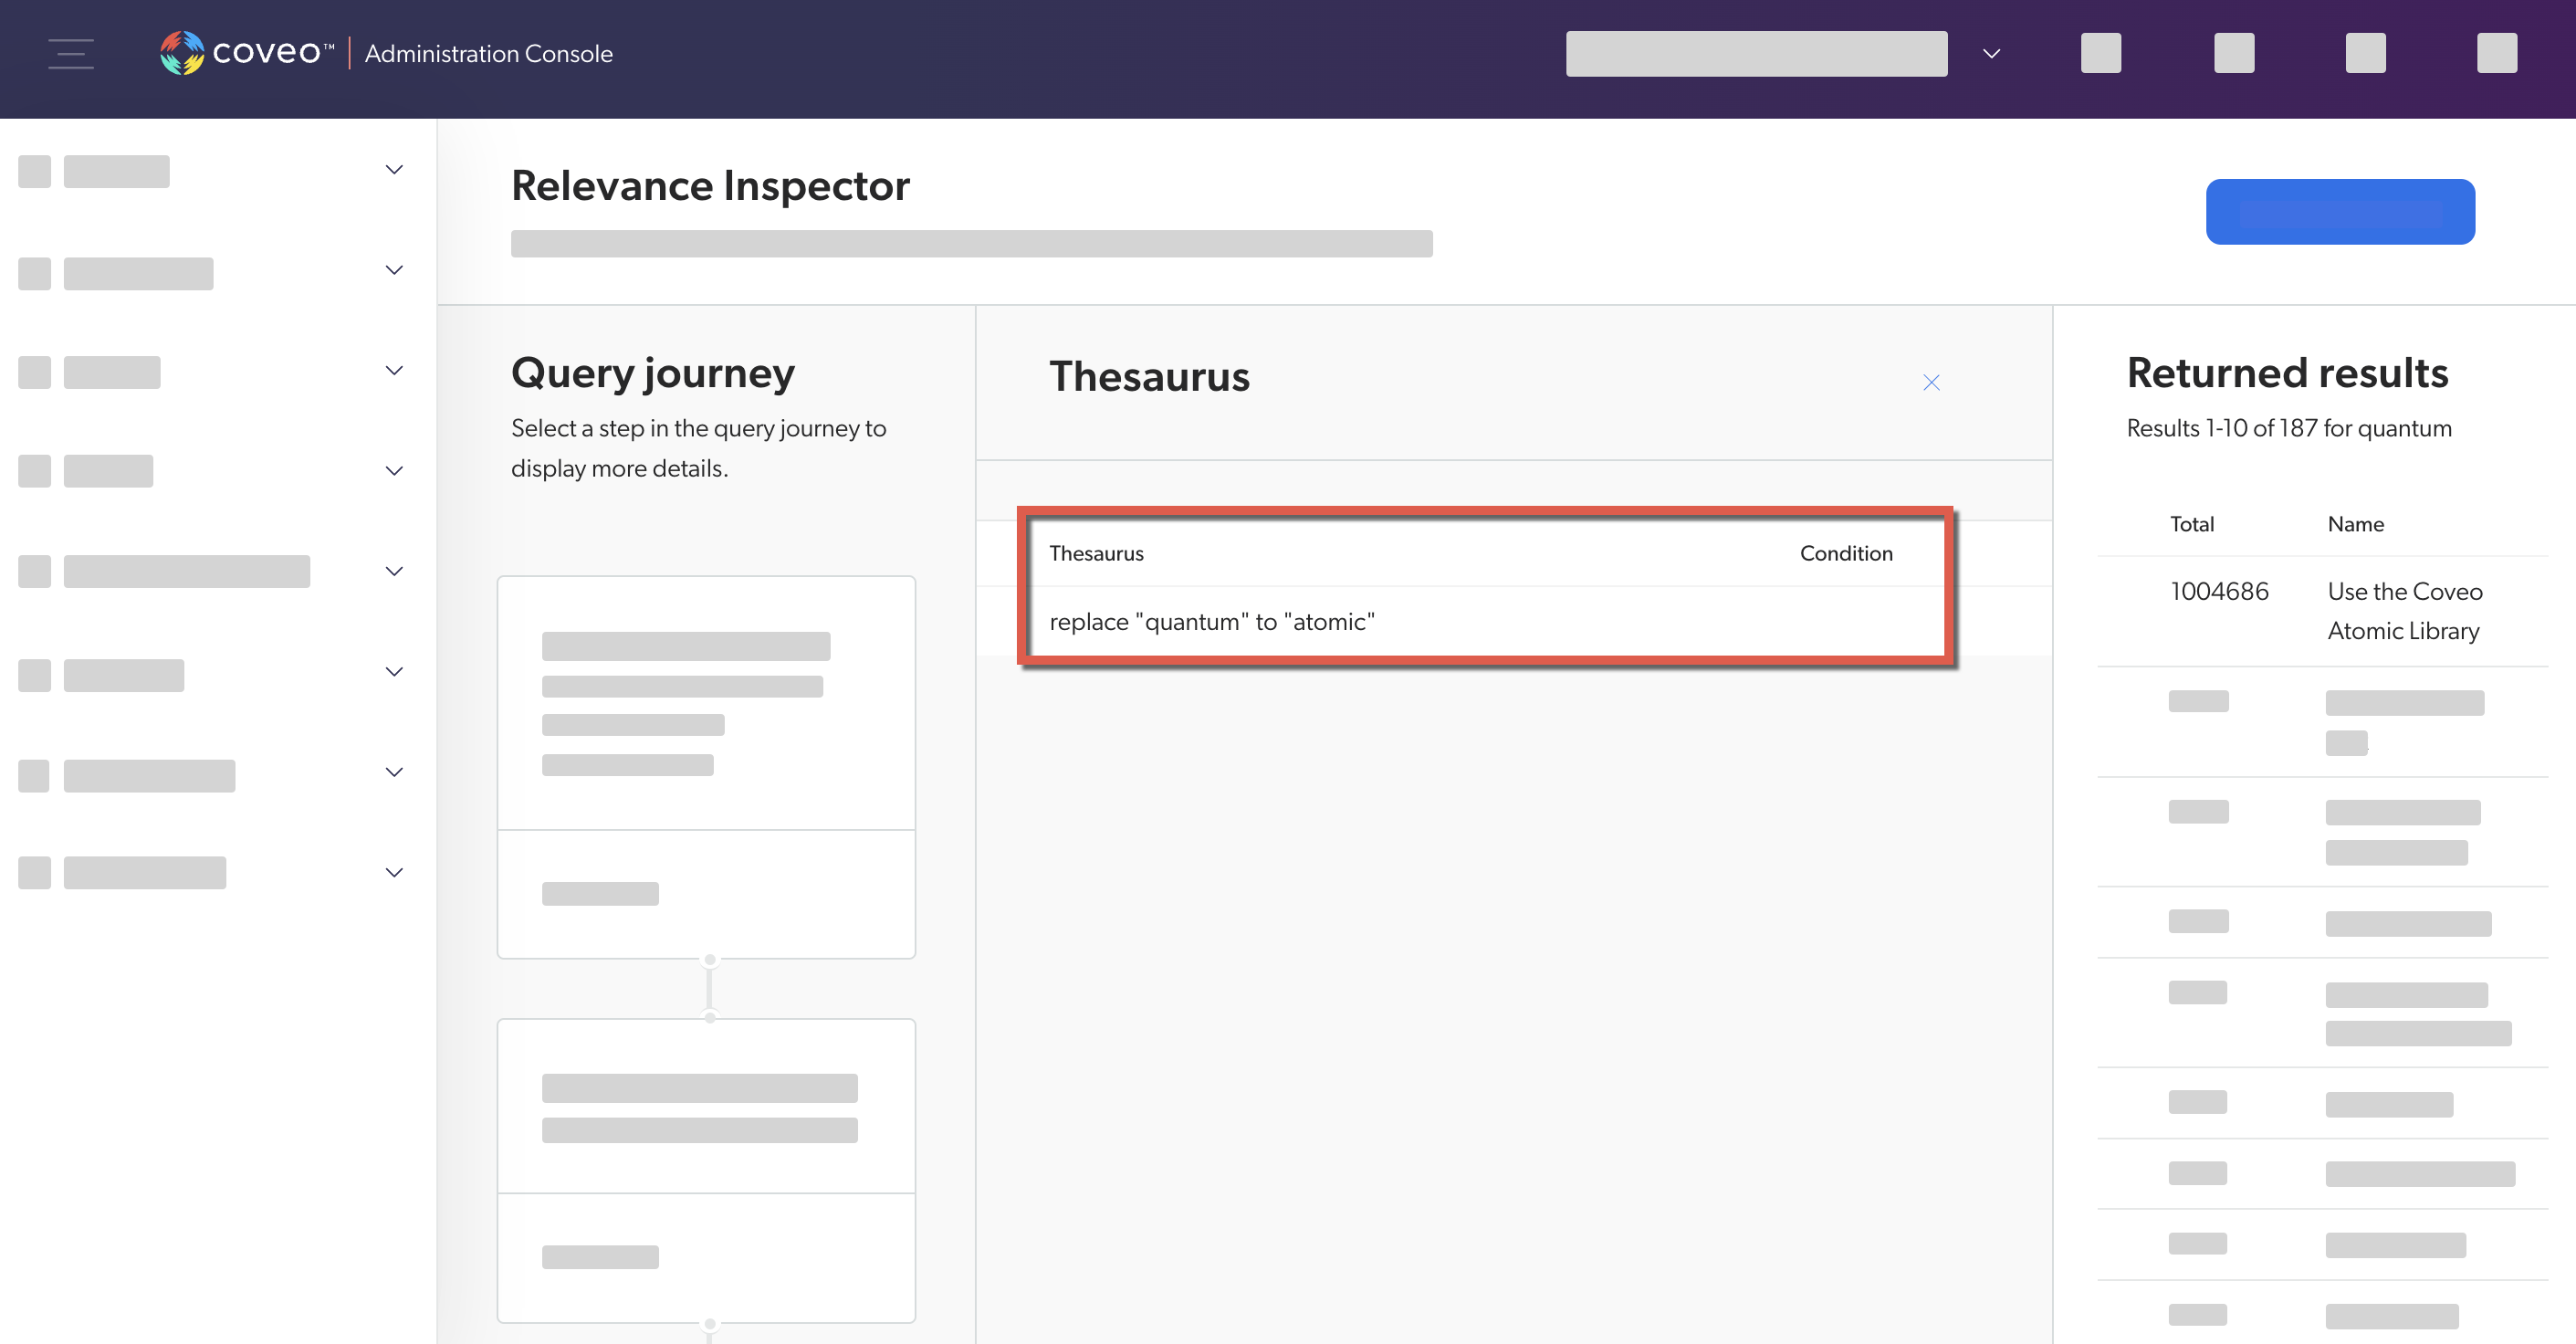
In the Relevance Inspector, the thesaurus rules are displayed under Query pipeline rules (the third step in the Query journey). Click See details for more information about the rule that was applied.
Stop words
Query pipeline stop word rules let you remove terms from a query before it’s sent to the index.
If a query pipeline contains stop word rules, review its configuration and test several entries in a search interface to ensure that the rules work as expected.
Review stop word rules configuration
-
On the Query Pipelines (platform-ca | platform-eu | platform-au) page of the Administration Console, select the query pipeline for which you want to review stop word rules configuration. Then, in the Action bar, click Edit components.
-
Select the Search terms tab, and then click Stop words.
-
Validate the stop word rules' configuration and associated conditions.
Test stop word rules in a search interface
-
Access the search interface in which you want to test a stop word rule.
-
In the search box, perform a query that would trigger a stop word rule.
-
Enable debugging mode by appending
&debug=trueto the current URL.
-
In the network monitoring tool, under the Name column, select the latest request to the Search API. The request path should contain
/rest/search/v2. -
Select the Preview tab, and then find the
basicExpressionproperty. -
The value of the
basicExpressionproperty should reflect the stop word rule (in other words, the stop word terms shouldn’t be present in the query).In the following capture, the term
masswas removed by a stop word rule: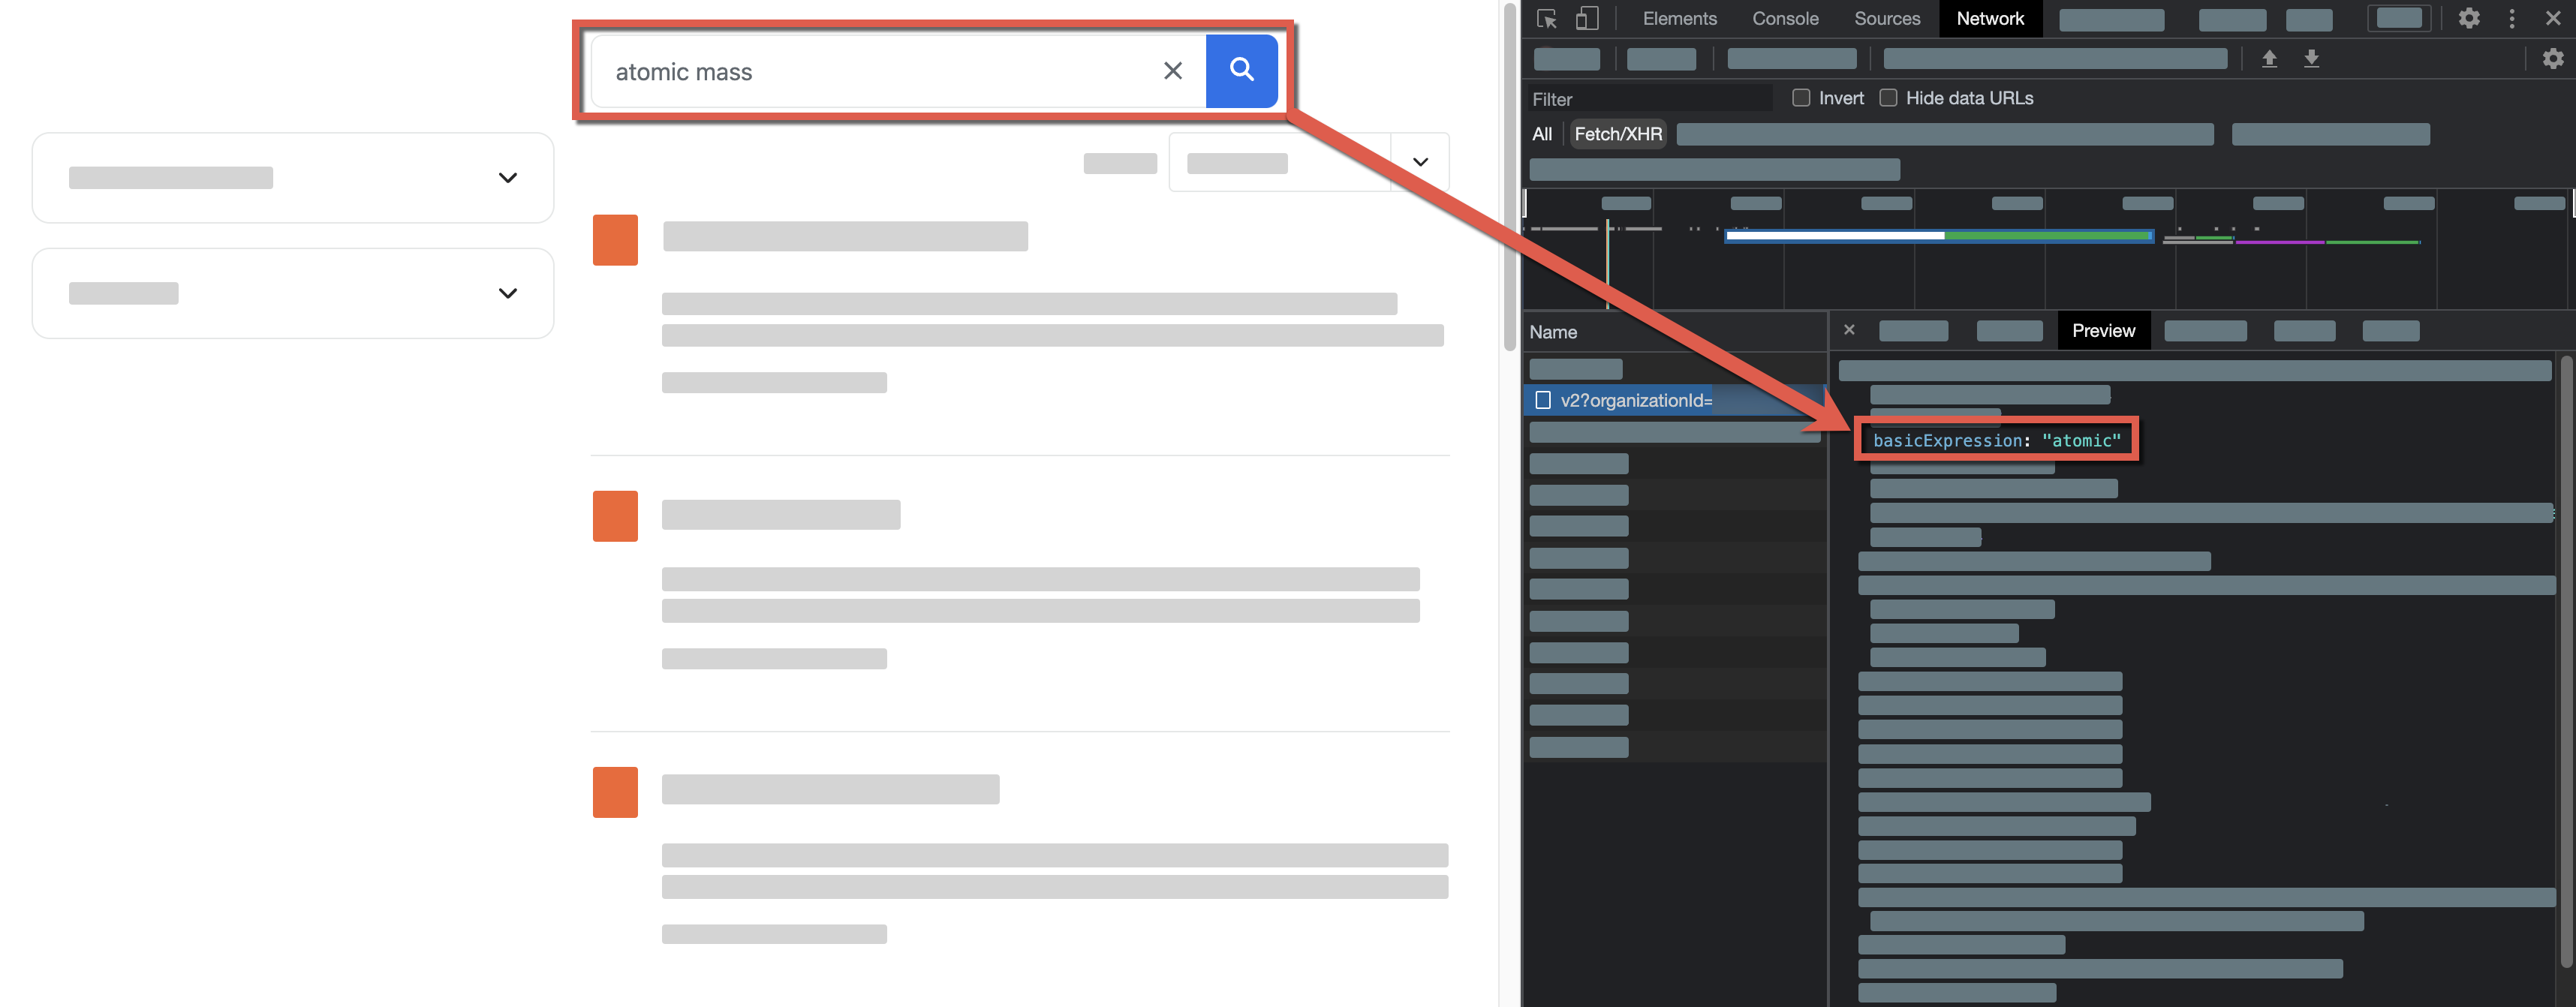
-
Access the Relevance Inspector:
-
If your search interface leverages the Atomic library, select and hold Alt (Windows) or Option (Mac) and double-click any search interface element.
-
In the modal that appears, select
Open, and you’ll be redirected to the Coveo Administration Console. You may have to wait for your query to load.
NoteYou can go directly to the Relevance Inspector (platform-ca | platform-eu | platform-au) page of the Coveo Administration Console. If you do, you’ll need to rerun the query in the Relevance Inspector using the query’s
SearchUid. You can find this value on the Preview tab of your network monitoring tool:
-
-
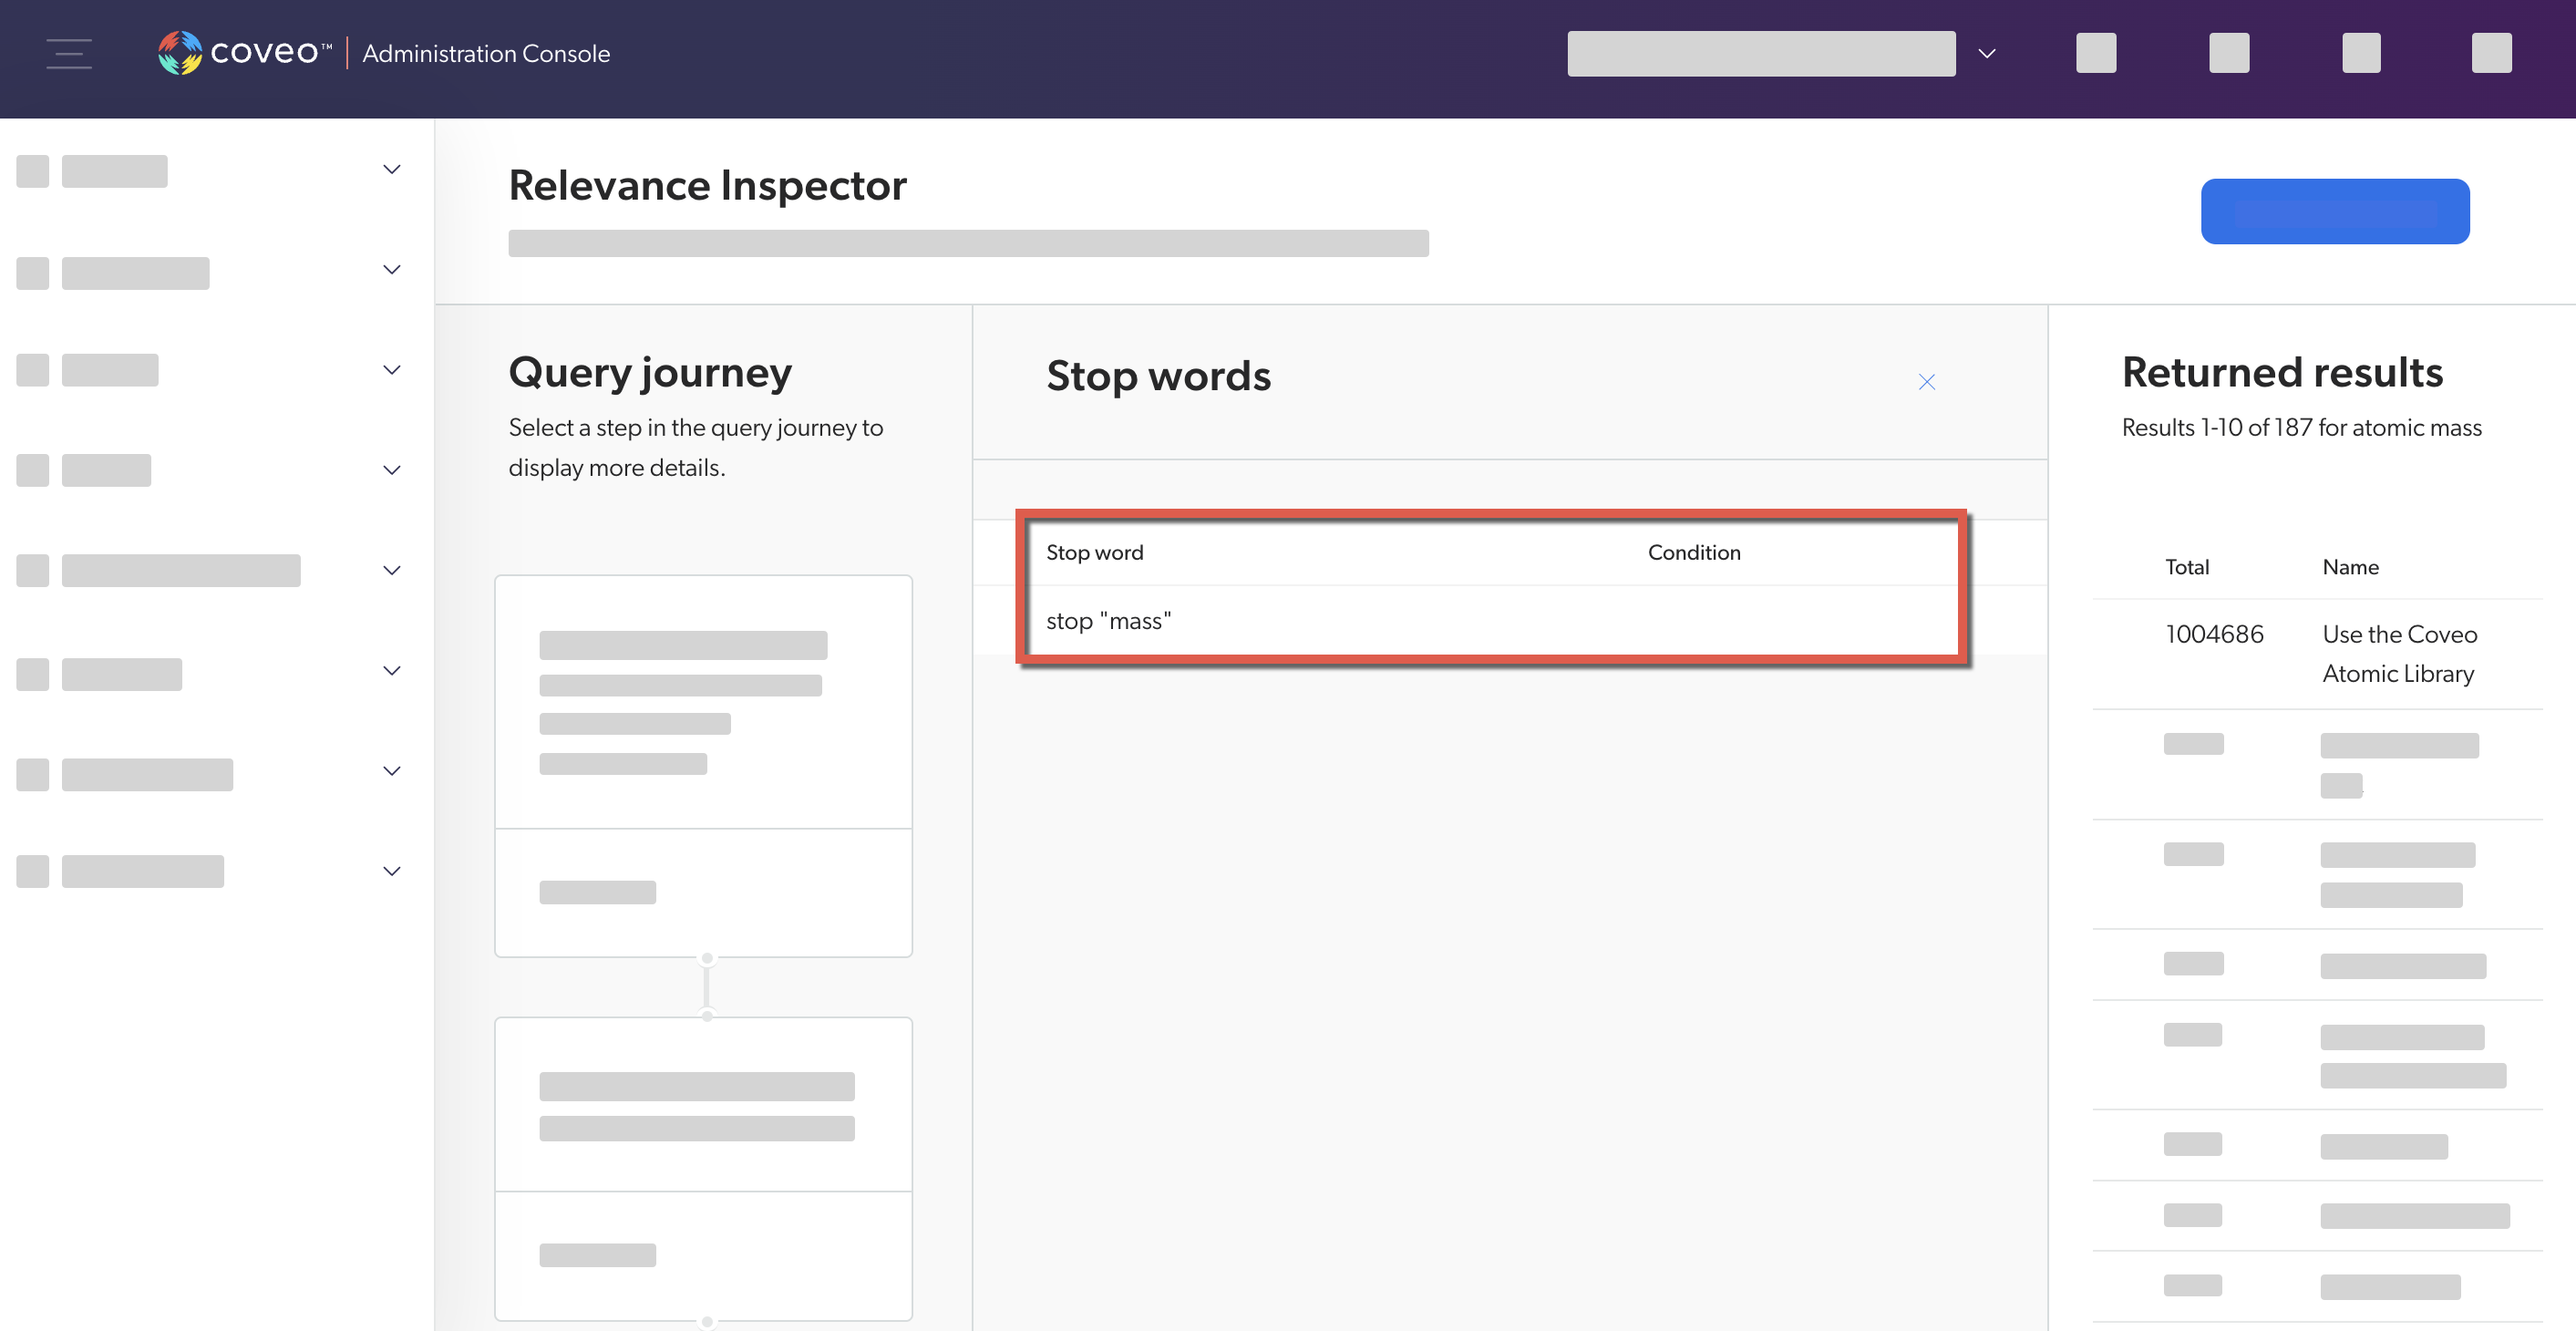
In the Relevance Inspector, the stop word rules are displayed under Query pipeline rules (the third step in the Query journey). Click See details for more information about the rule that was applied.
Ranking expressions
Query pipeline ranking expression rules let you modify the score of specific search results when certain conditions are met.
If a query pipeline contains ranking expression rules, review its configuration and test several entries in a search interface to ensure that the rules work as expected.
Review ranking expression rules configuration
-
On the Query Pipelines (platform-ca | platform-eu | platform-au) page of the Administration Console, select the query pipeline for which you want to review ranking expression rules configuration. Then, in the Action bar, click Edit components.
-
Select the Result ranking tab, and then click a ranking expression rule.
-
In the Action bar, click Edit.
-
Validate the ranking expression rule’s configuration and associated condition.
Test ranking expression rules in a search interface
-
Access the search interface in which you want to test a ranking expression rule.
-
In the search box, perform a query that would trigger a ranking expression rule.
-
Enable debugging mode by appending
&debug=trueto the current URL.
-
In the network monitoring tool, under the Name column, select the latest request to the Search API. The request path should contain
/rest/search/v2. -
Select the Preview tab.
-
Find and expand the
rankingExpressionsproperty, and then validate whether theexpressionandmodifierbehave as expected.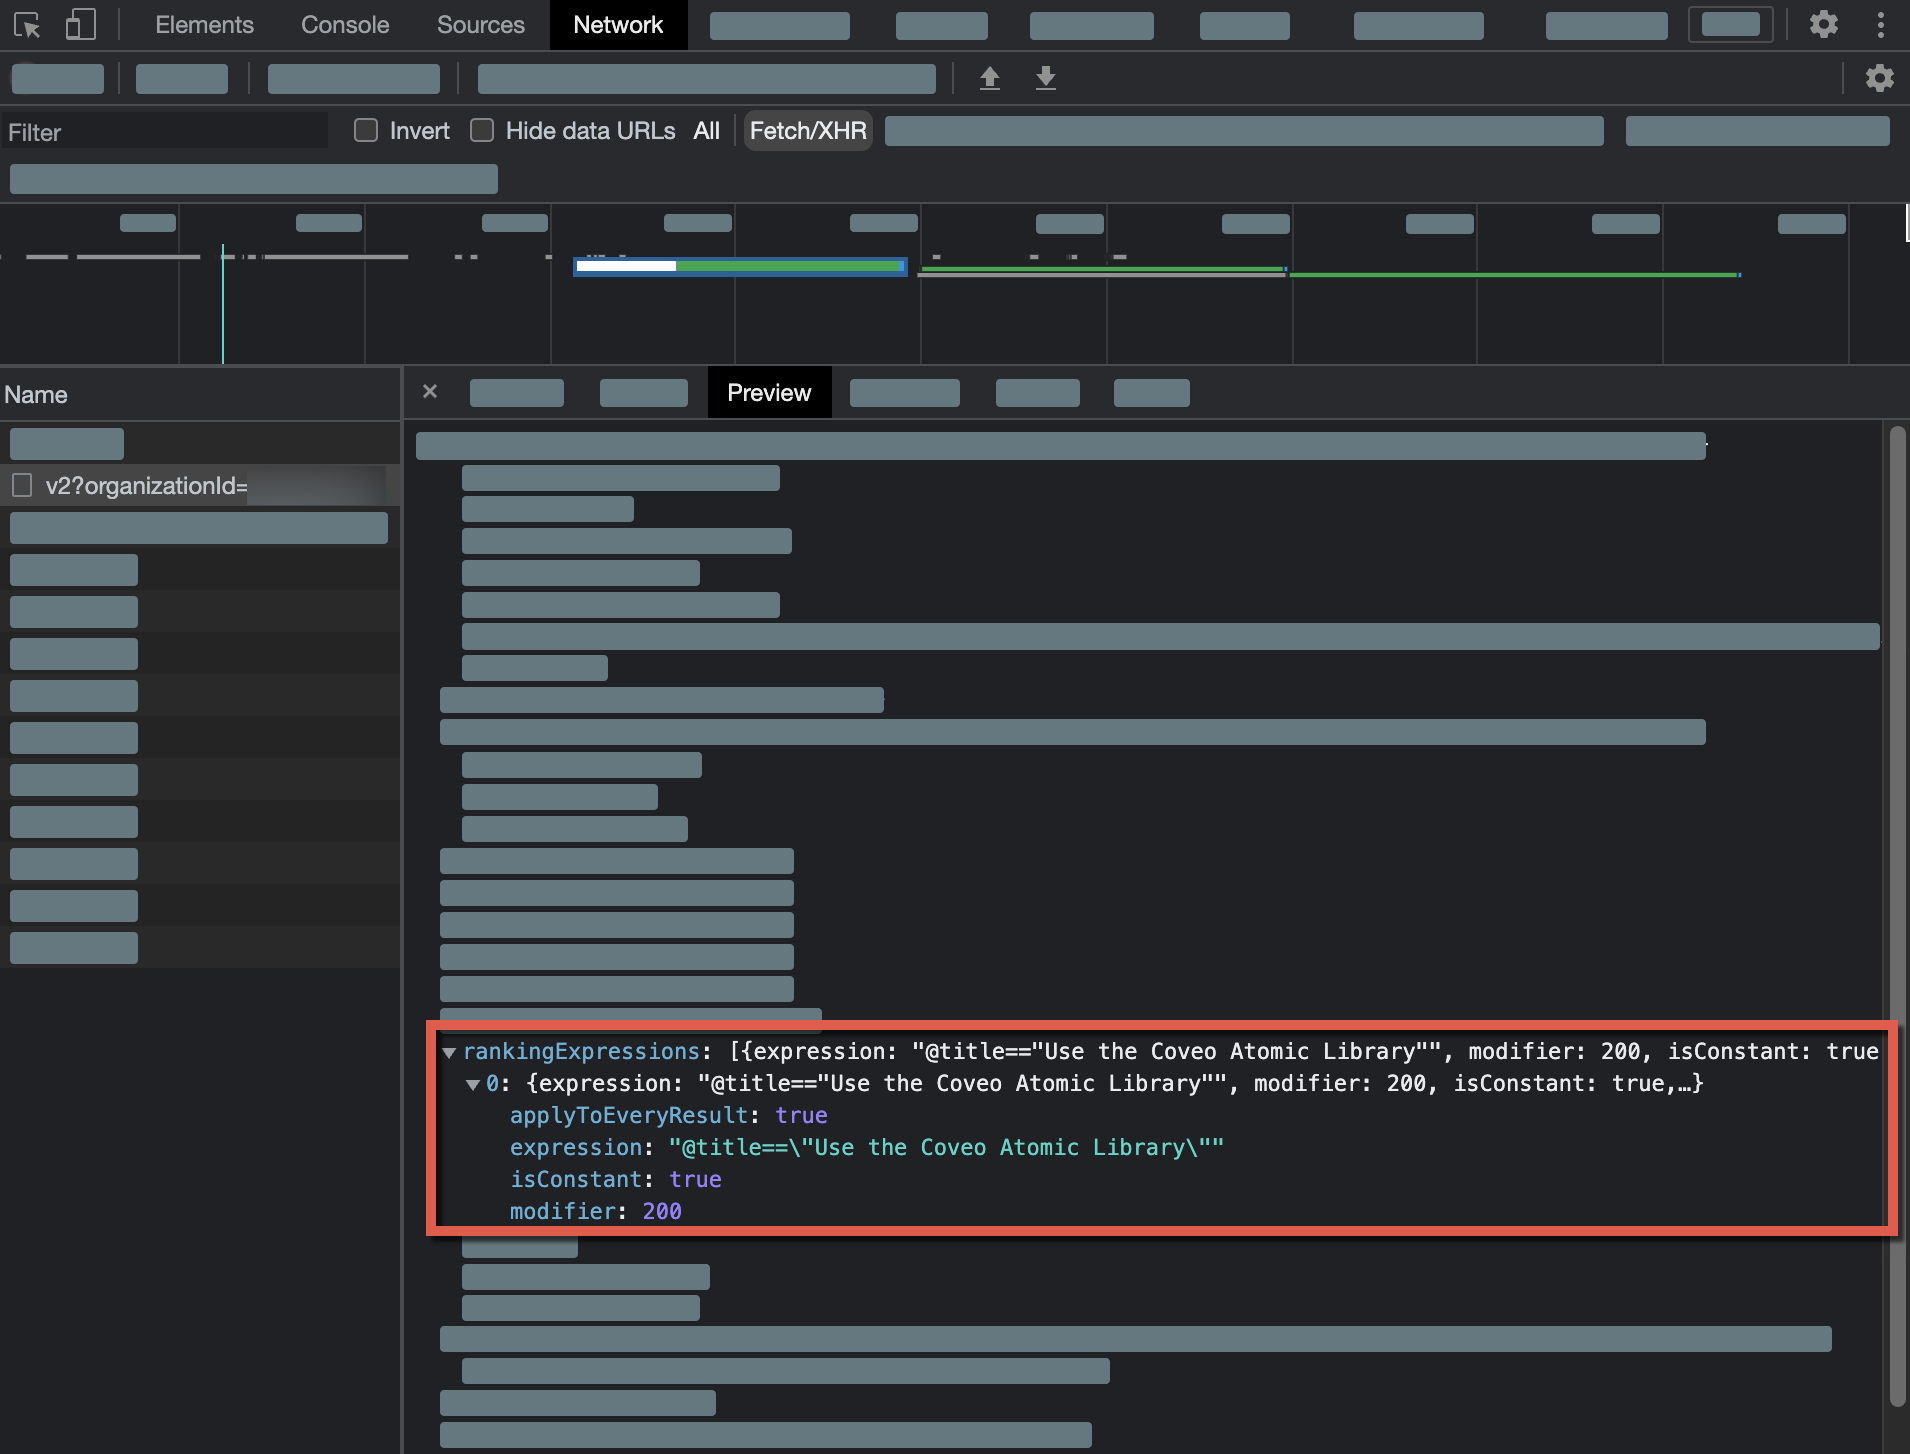
-
Access the Relevance Inspector:
-
If your search interface leverages the Atomic library, select and hold Alt (Windows) or Option (Mac) and double-click any search interface element.
-
In the modal that appears, select
Open, and you’ll be redirected to the Coveo Administration Console. You may have to wait for your query to load.
NoteYou can go directly to the Relevance Inspector (platform-ca | platform-eu | platform-au) page of the Coveo Administration Console. If you do, you’ll need to rerun the query in the Relevance Inspector using the query’s
SearchUid. You can find this value on the Preview tab of your network monitoring tool:
-
-
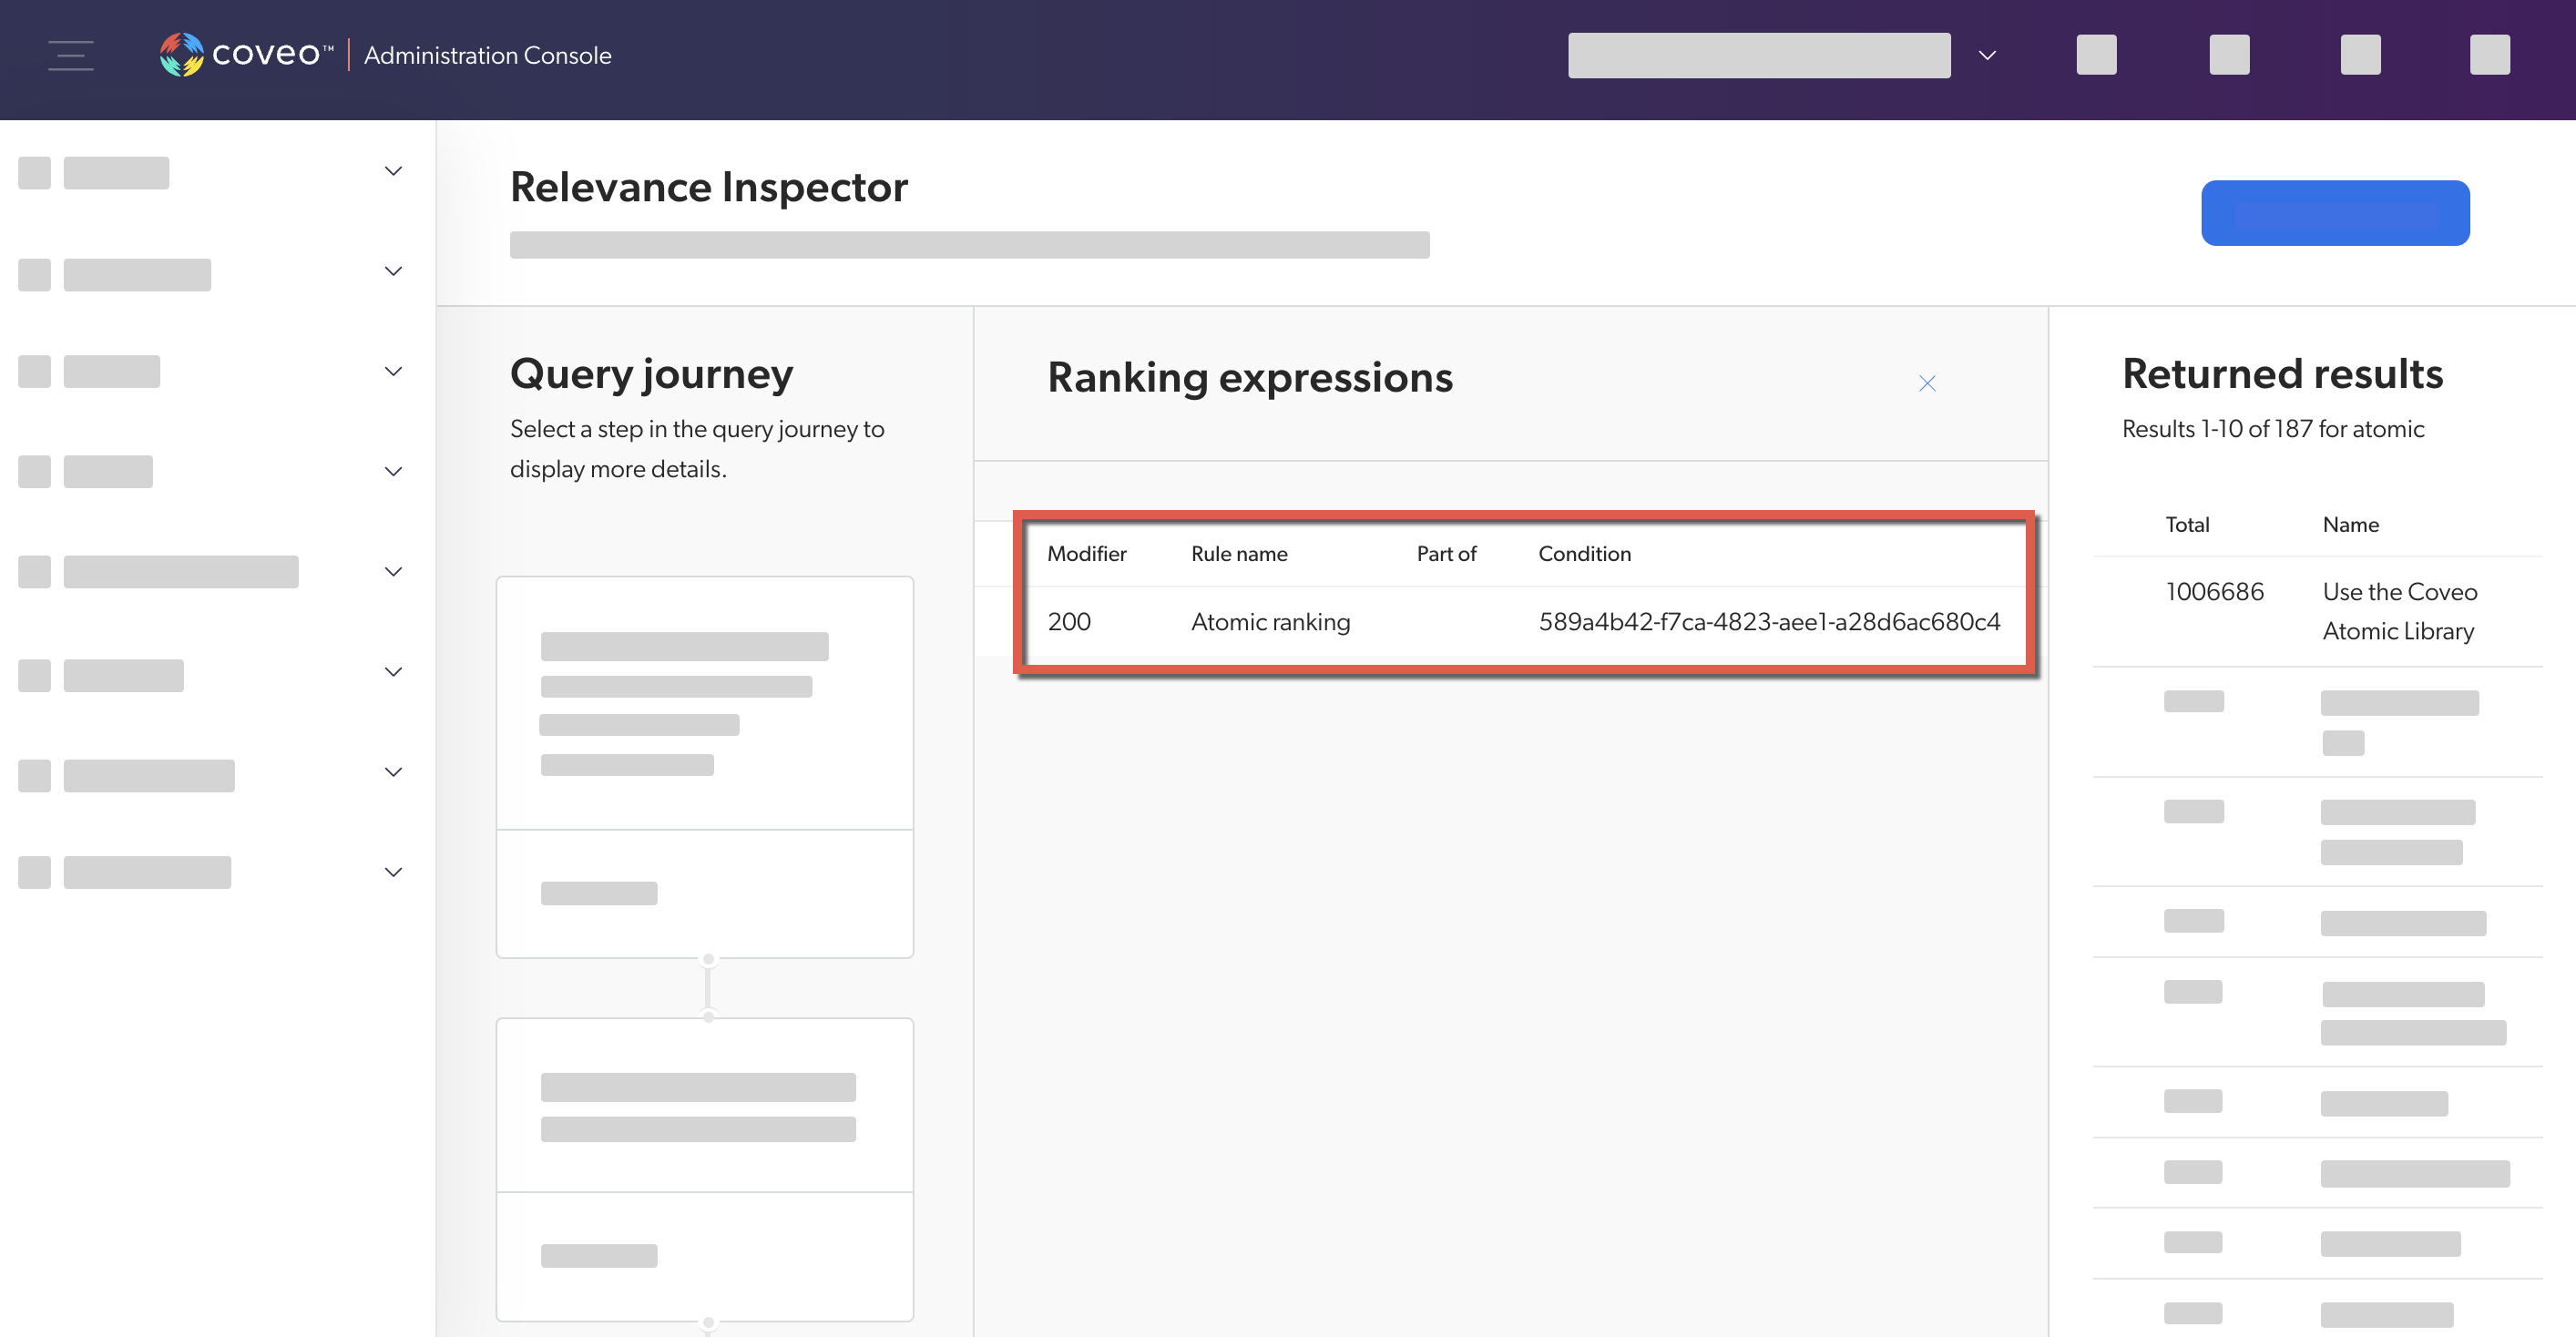
In the Relevance Inspector, the ranking expression rules are displayed under Query pipeline rules (the third step in the Query journey). Click See details for more information about the rule that was applied.
Featured results
Query pipeline featured result rules let you display content at the top of the results list when specific conditions are met.
If a query pipeline contains featured result rules, review its configuration and test several entries in a search interface to ensure that the rules work as expected.
Review featured result rules configuration
-
In the Query Pipelines (platform-ca | platform-eu | platform-au) page of the Administration Console, select the query pipeline for which you want to review featured result rules configuration. Then, in the Action bar, click Edit components.
-
Select the Result ranking tab, and then click a featured result rule.
-
In the Action bar, click Edit.
-
Validate the featured result rule’s configuration and associated condition.
Test featured result rules in a search interface
-
Access the search interface in which you want to test a featured result rule.
-
In the search box, perform a query that would trigger a featured result rule.
-
Enable debugging mode by appending
&debug=trueto the current URL.
-
Check whether the first item in the result list is the one that the rule must boost.
-
In the network monitoring tool, under the Name column, select the latest request to the Search API. The request path should contain
/rest/search/v2. -
Select the Preview tab.
-
Find and expand the
resultsproperty. -
Find the property that corresponds to the item that the rule must boost.
-
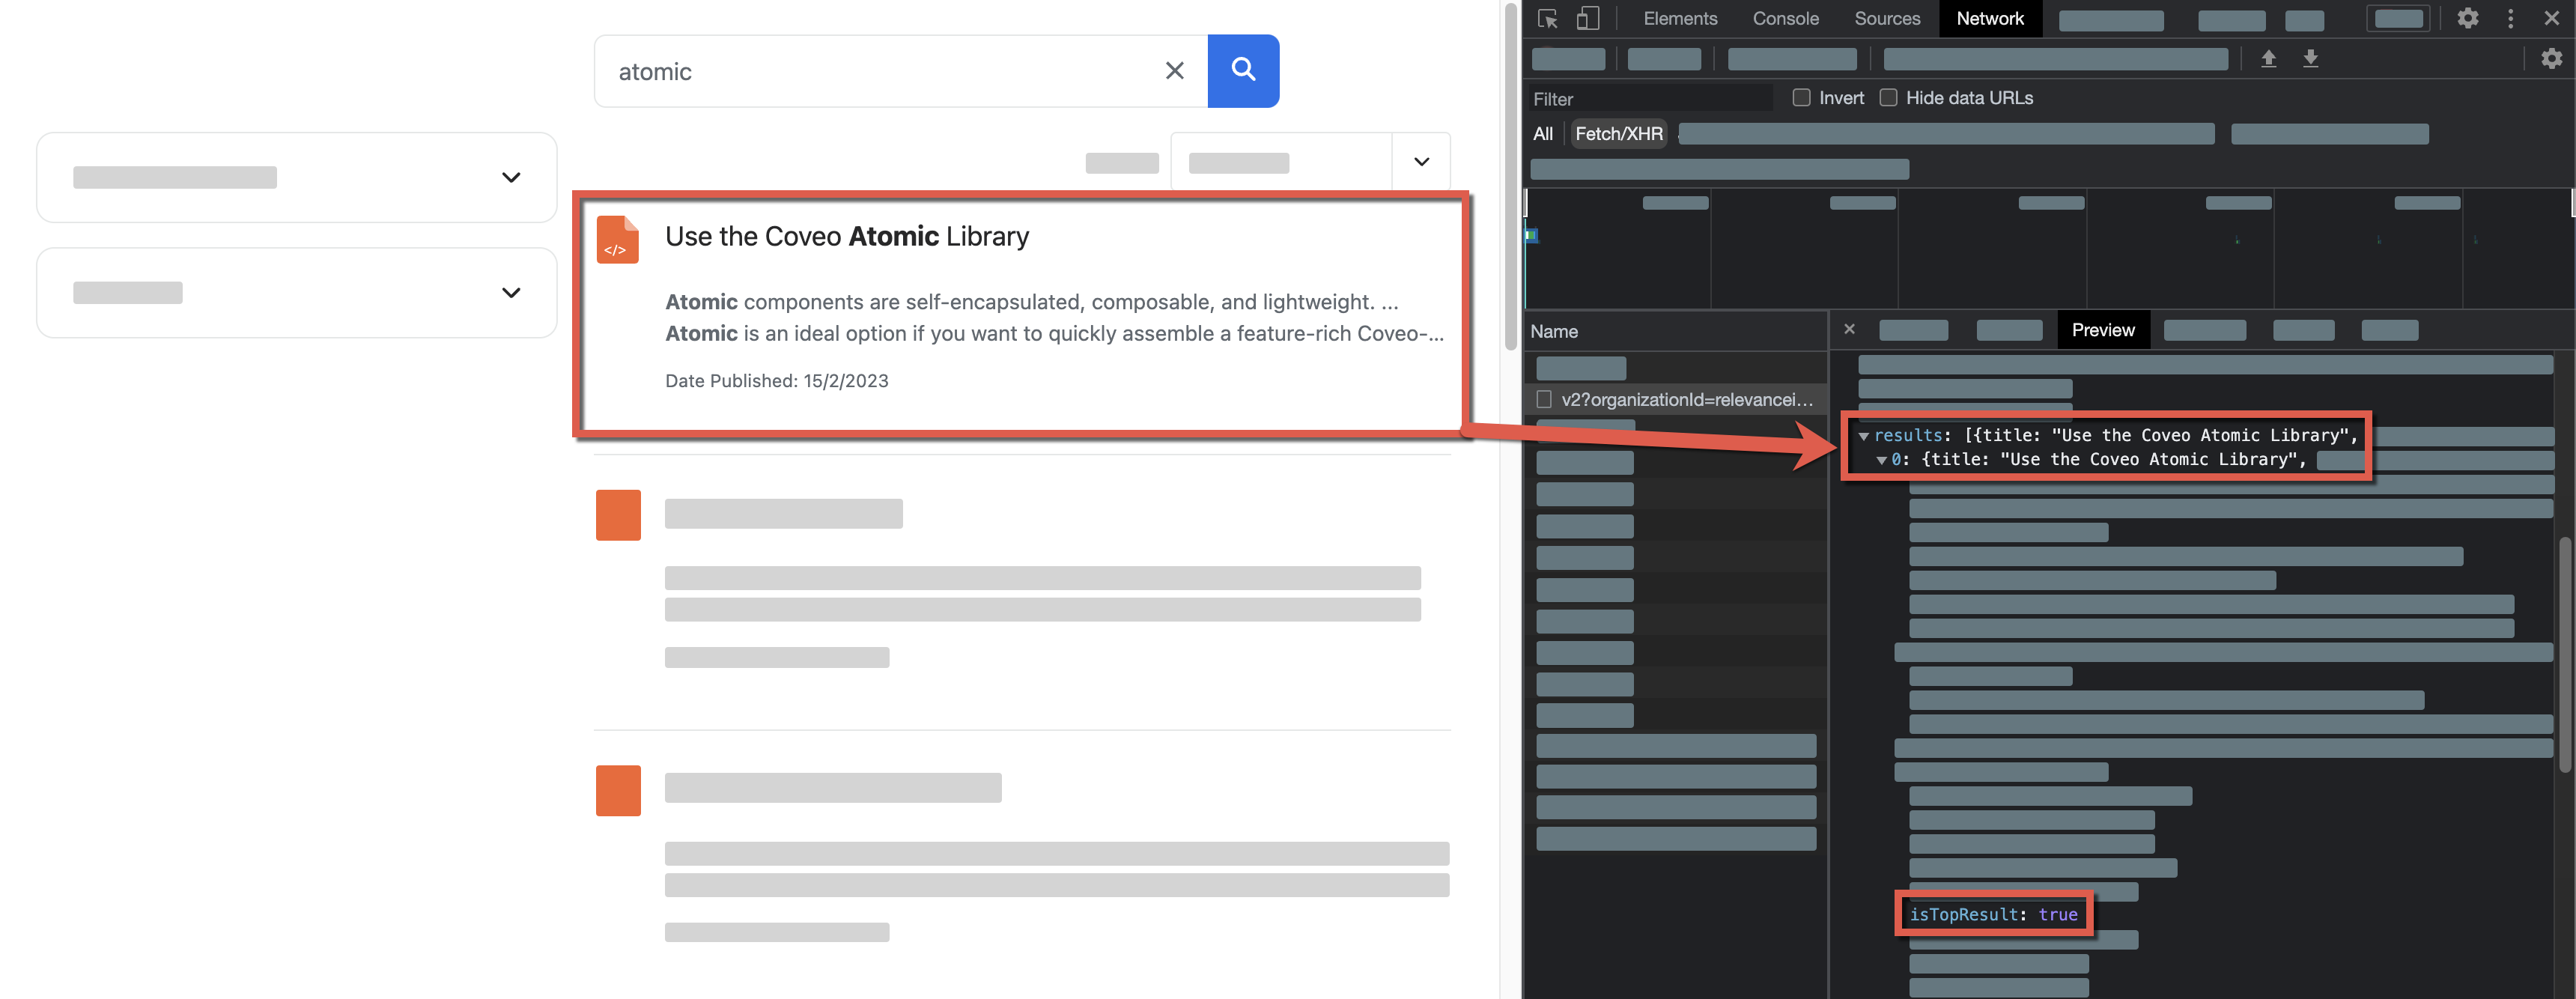
Validate that the item has the
isTopResultproperty with thetruevalue.In the following capture, the Use the Coveo Atomic Library item is boosted by a featured result rule:
-
Access the Relevance Inspector:
-
If your search interface leverages the Atomic library, select and hold Alt (Windows) or Option (Mac) and double-click any search interface element.
-
In the modal that appears, select
Open, and you’ll be redirected to the Coveo Administration Console. You may have to wait for your query to load.
NoteYou can go directly to the Relevance Inspector (platform-ca | platform-eu | platform-au) page of the Coveo Administration Console. If you do, you’ll need to rerun the query in the Relevance Inspector using the query’s
SearchUid. You can find this value on the Preview tab of your network monitoring tool:
-
-
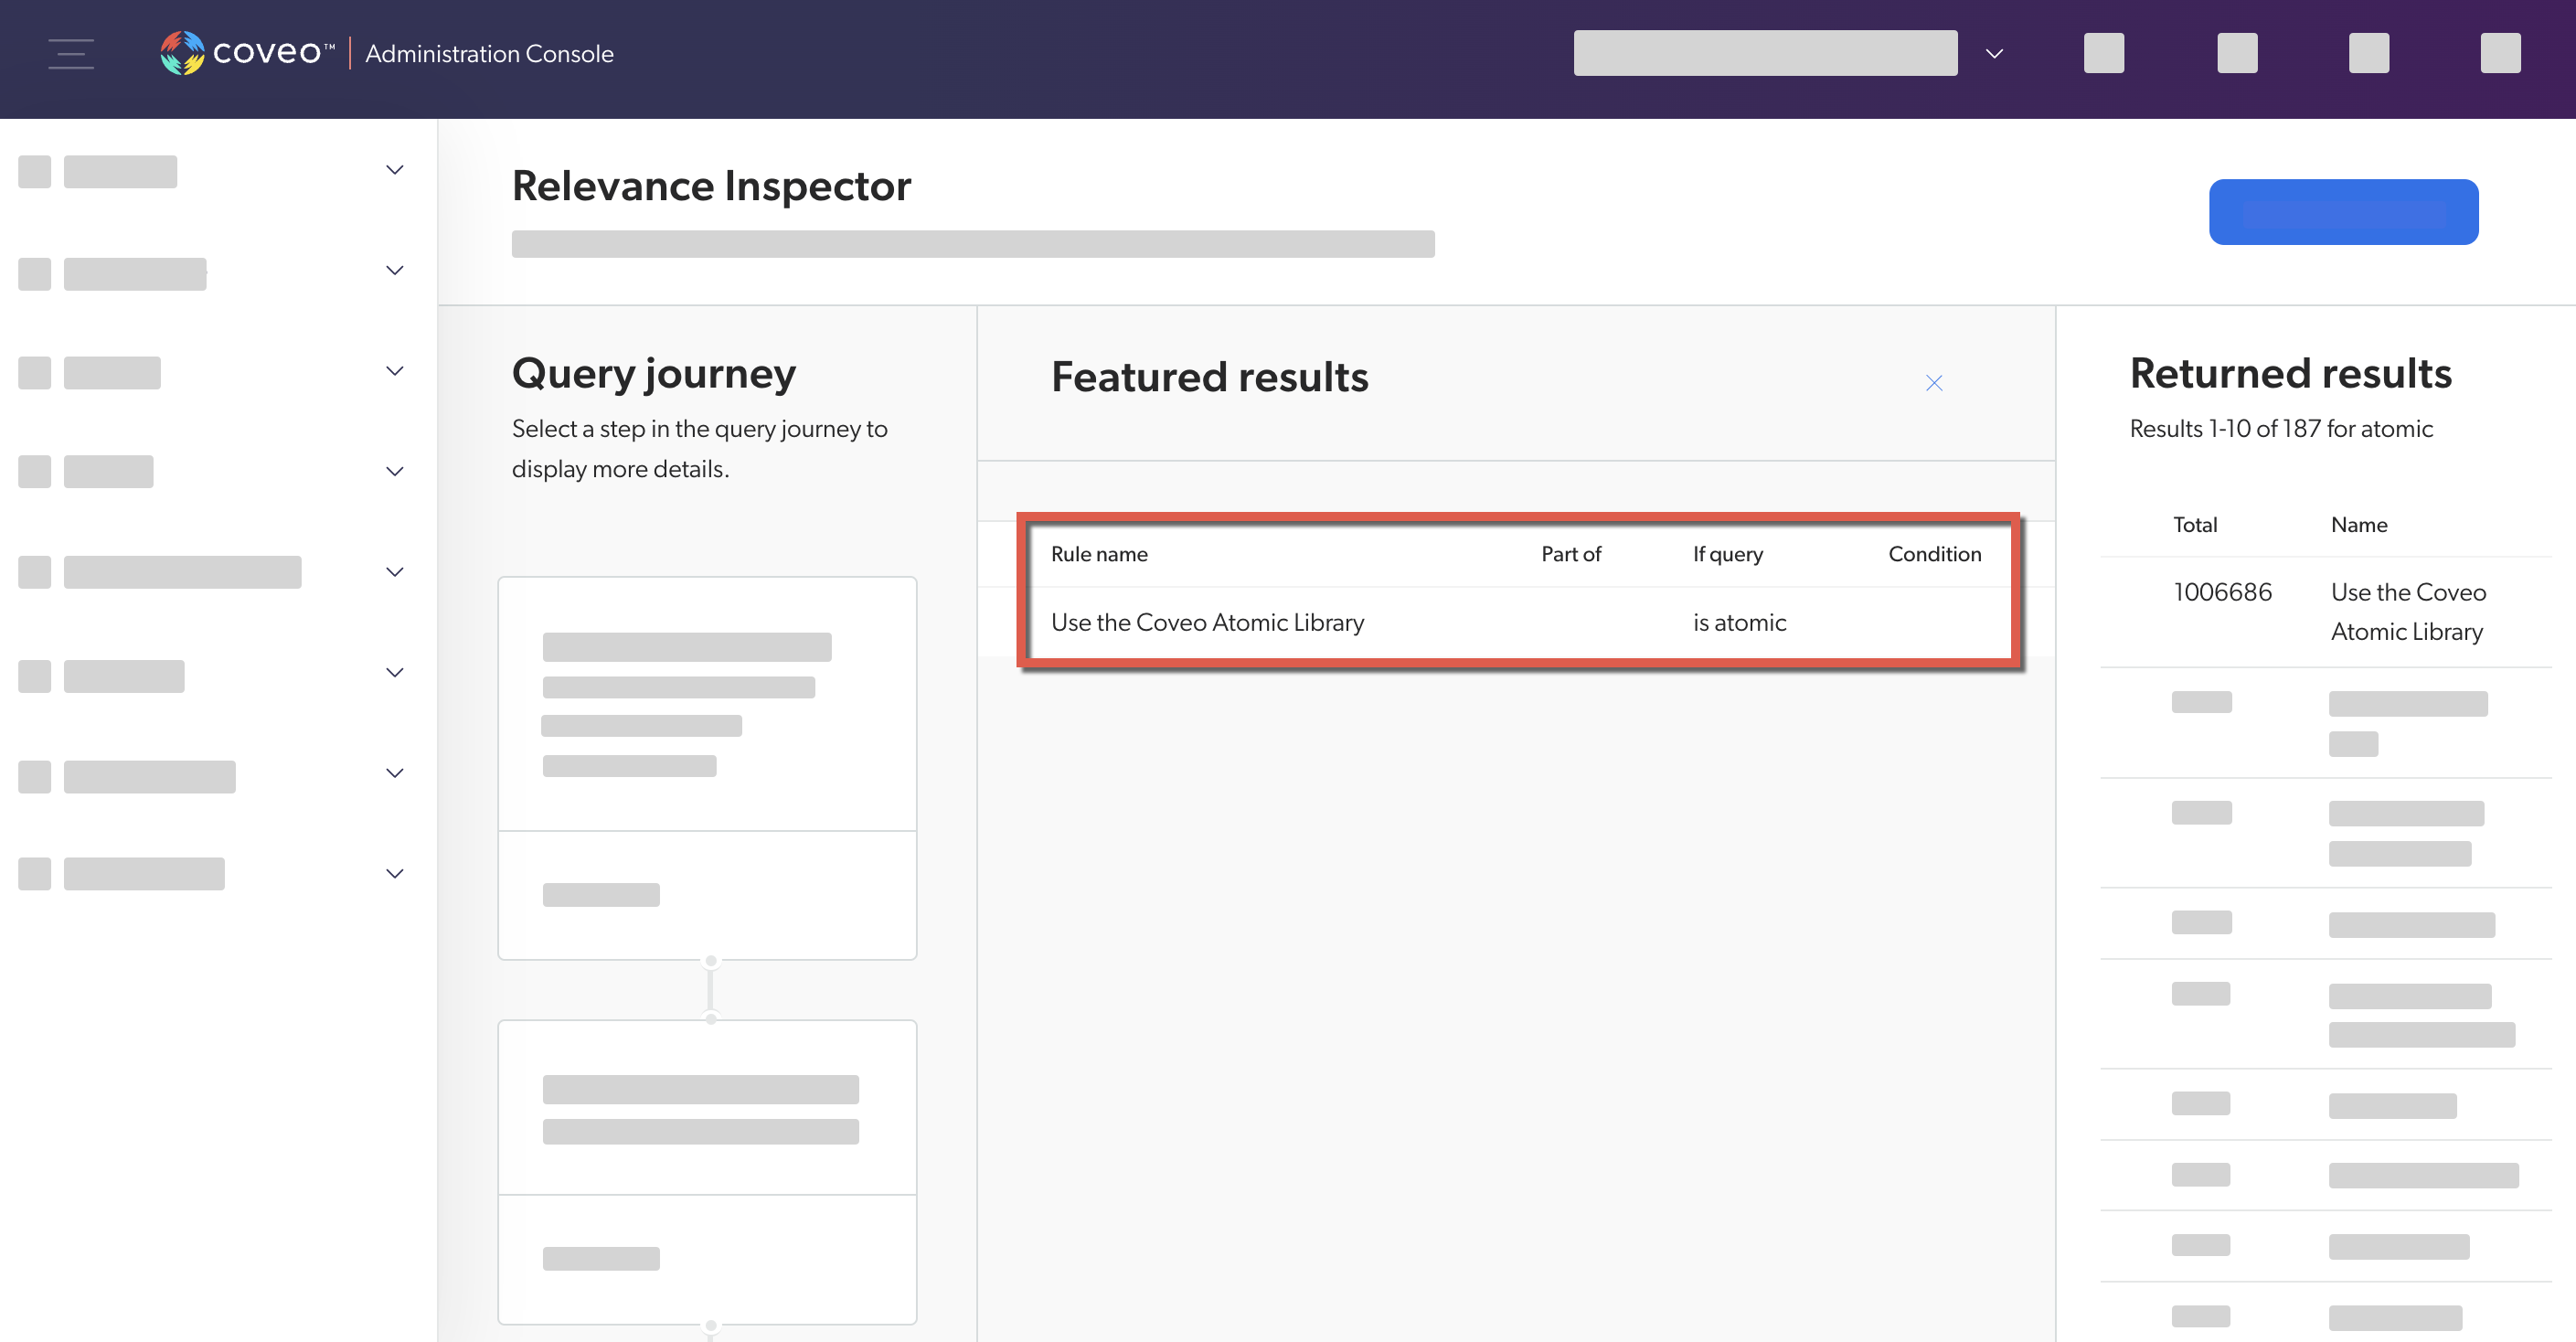
In the Relevance Inspector, the featured result rules are displayed under Query pipeline rules (the third step in the Query journey). Click See details for more information about the rule that was applied.
Triggers
Query pipeline triggers define actions to execute in a search interface.
If a query pipeline contains trigger rules, review its configuration and test several entries in a search interface to ensure that the rules work as expected.
Review trigger rules configuration
-
In the Query Pipelines (platform-ca | platform-eu | platform-au) page of the Administration Console, select the query pipeline for which you want to review trigger rules configuration. Then, in the Action bar, click Edit components.
-
Select the Advanced tab, and then select Triggers.
-
Validate the trigger rules’ configuration and associated conditions.
Test trigger rules in a search interface
The Coveo Platform offers different types of trigger actions. The procedure to test them differs depending on the type of action the trigger rule leverages:
Notify
A Notify trigger rule displays a message in the search interface.
-
Access the search interface in which you want to test a trigger rule.
-
In the search interface, reproduce the conditions that would launch a trigger rule (for example, performing a query).
-
Enable debugging mode by appending
&debug=trueto the current URL.
-
Verify that the message is displayed as expected in the search interface.
-
In the network monitoring tool, under the Name column, select the latest request to the Search API. The request path should contain
/rest/search/v2. -
Select the Preview tab, and then find and expand the
triggersproperty. -
Validate the values of the
triggersproperty.In the following capture, the Notify trigger displays the text
You searched for "atomic".: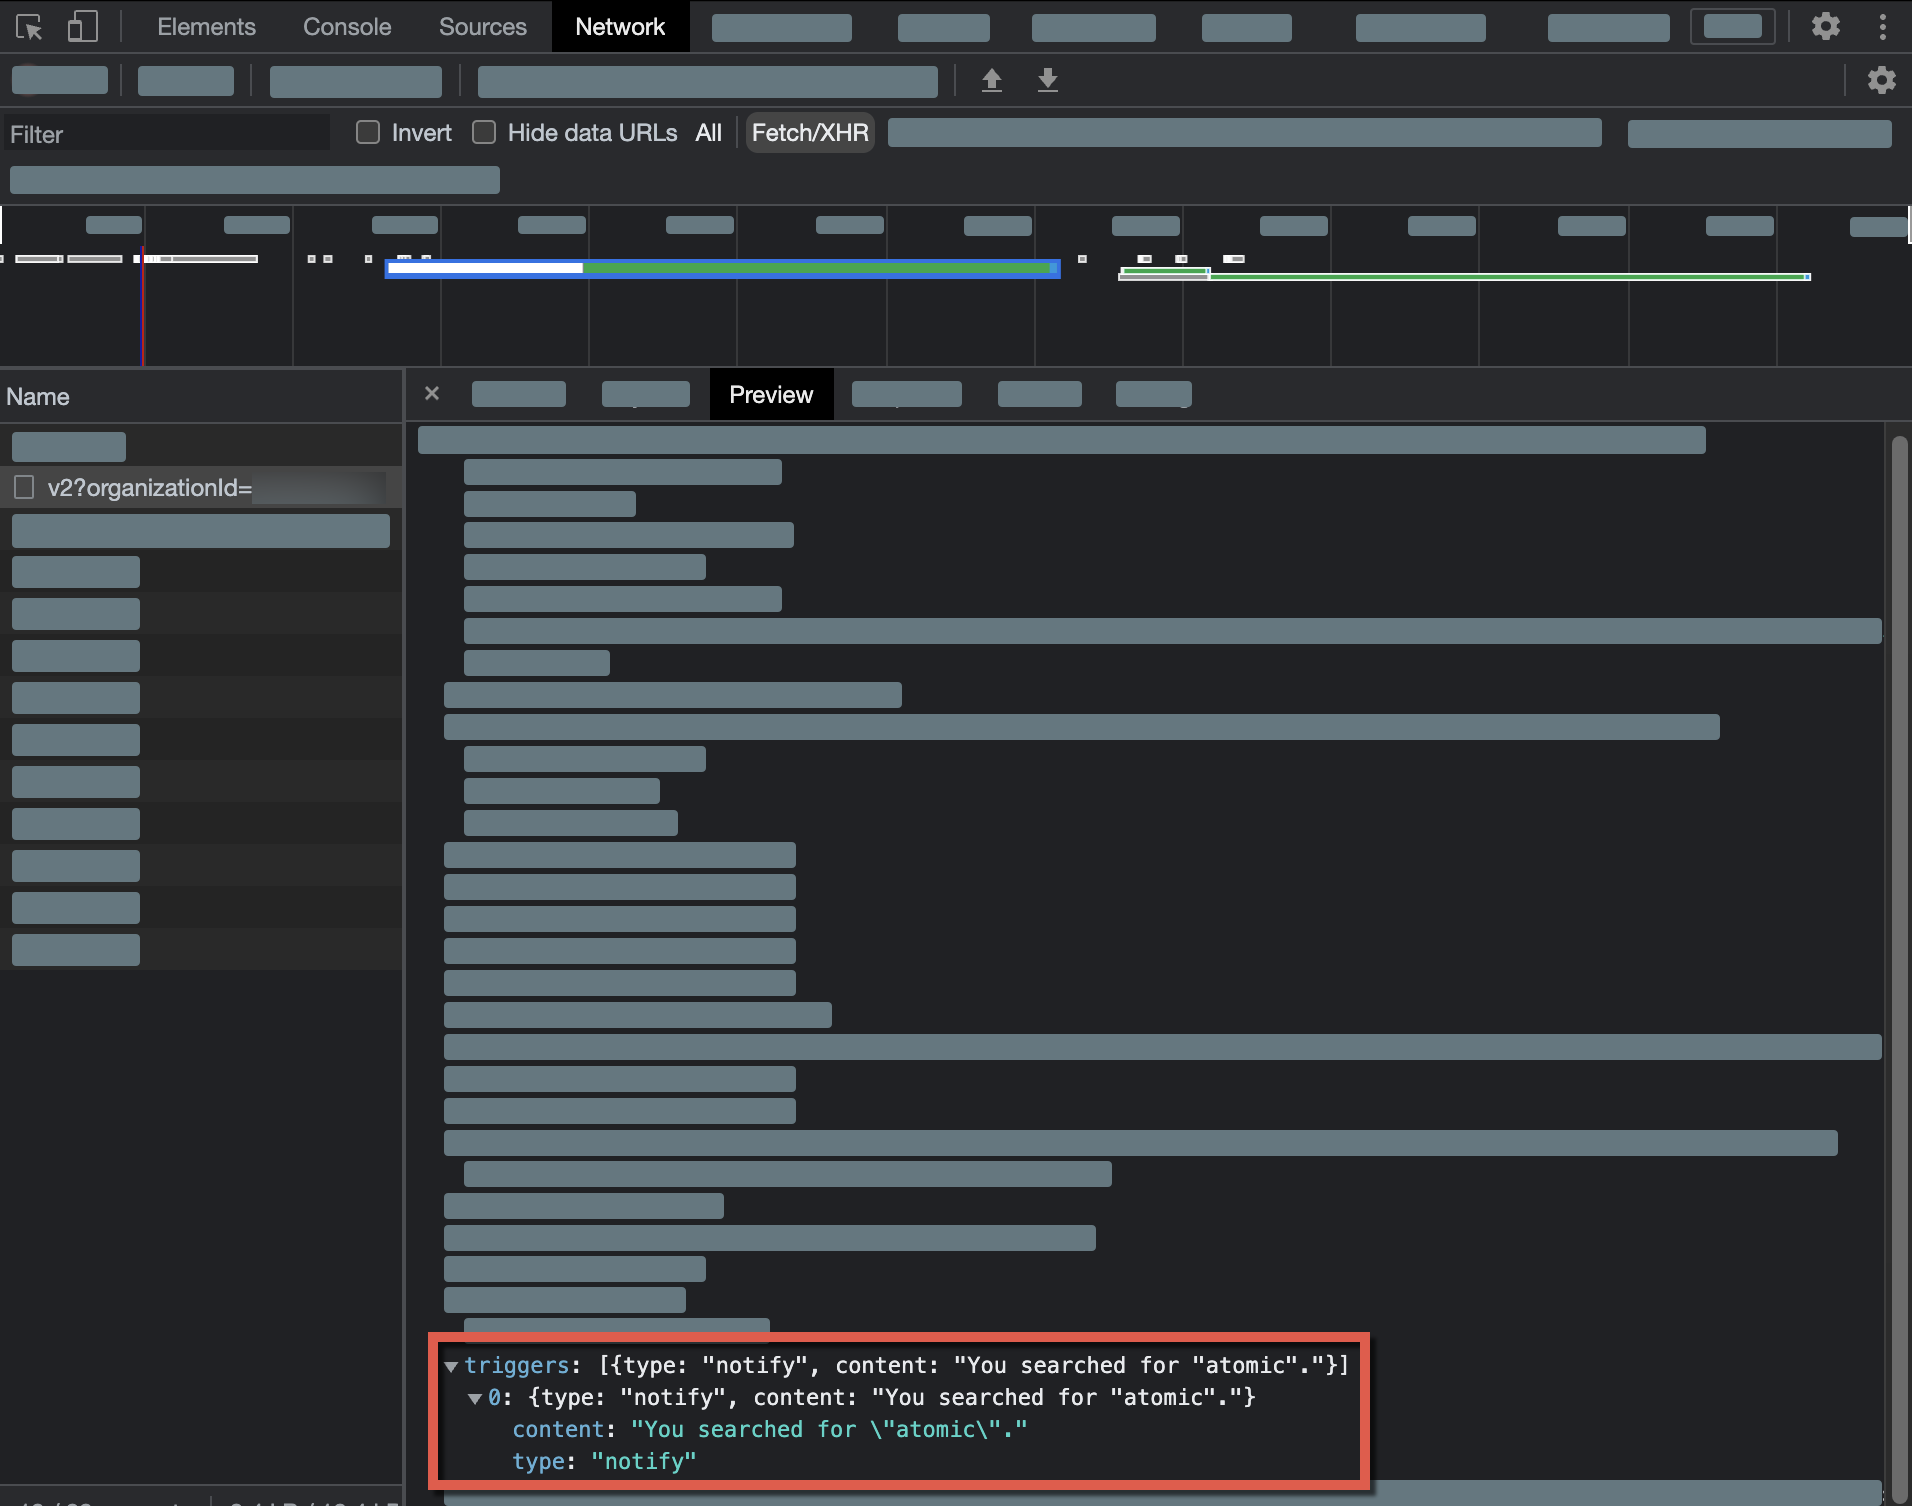
-
Access the Relevance Inspector:
-
If your search interface leverages the Atomic library, select and hold Alt (Windows) or Option (Mac) and double-click any search interface element.
-
In the modal that appears, select
Open, and you’ll be redirected to the Coveo Administration Console. You may have to wait for your query to load.
NoteYou can go directly to the Relevance Inspector (platform-ca | platform-eu | platform-au) page of the Coveo Administration Console. If you do, you’ll need to rerun the query in the Relevance Inspector using the query’s
SearchUid. You can find this value on the Preview tab of your network monitoring tool:
-
-
In the Relevance Inspector, the trigger rules are displayed under Query pipeline rules (the third step in the Query journey). Click See details for more information about the rule that was applied.

Query
A Query trigger rule forces the search interface to perform a new search using the query specified in the rule.
-
Access the search interface in which you want to test a trigger rule.
-
In the search box, perform a query that would launch a trigger rule.
-
In the network monitoring tool, under the Name column, select the latest request to the Search API. The request path should contain
/rest/search/v2. -
Select the Preview tab, and then find the
basicExpressionproperty. -
Verify that the value of the
basicExpressionproperty matches the query defined in the Query trigger rule. In the following capture, the Query trigger rule performed the queryatomicwhen the user entered the queryquantum: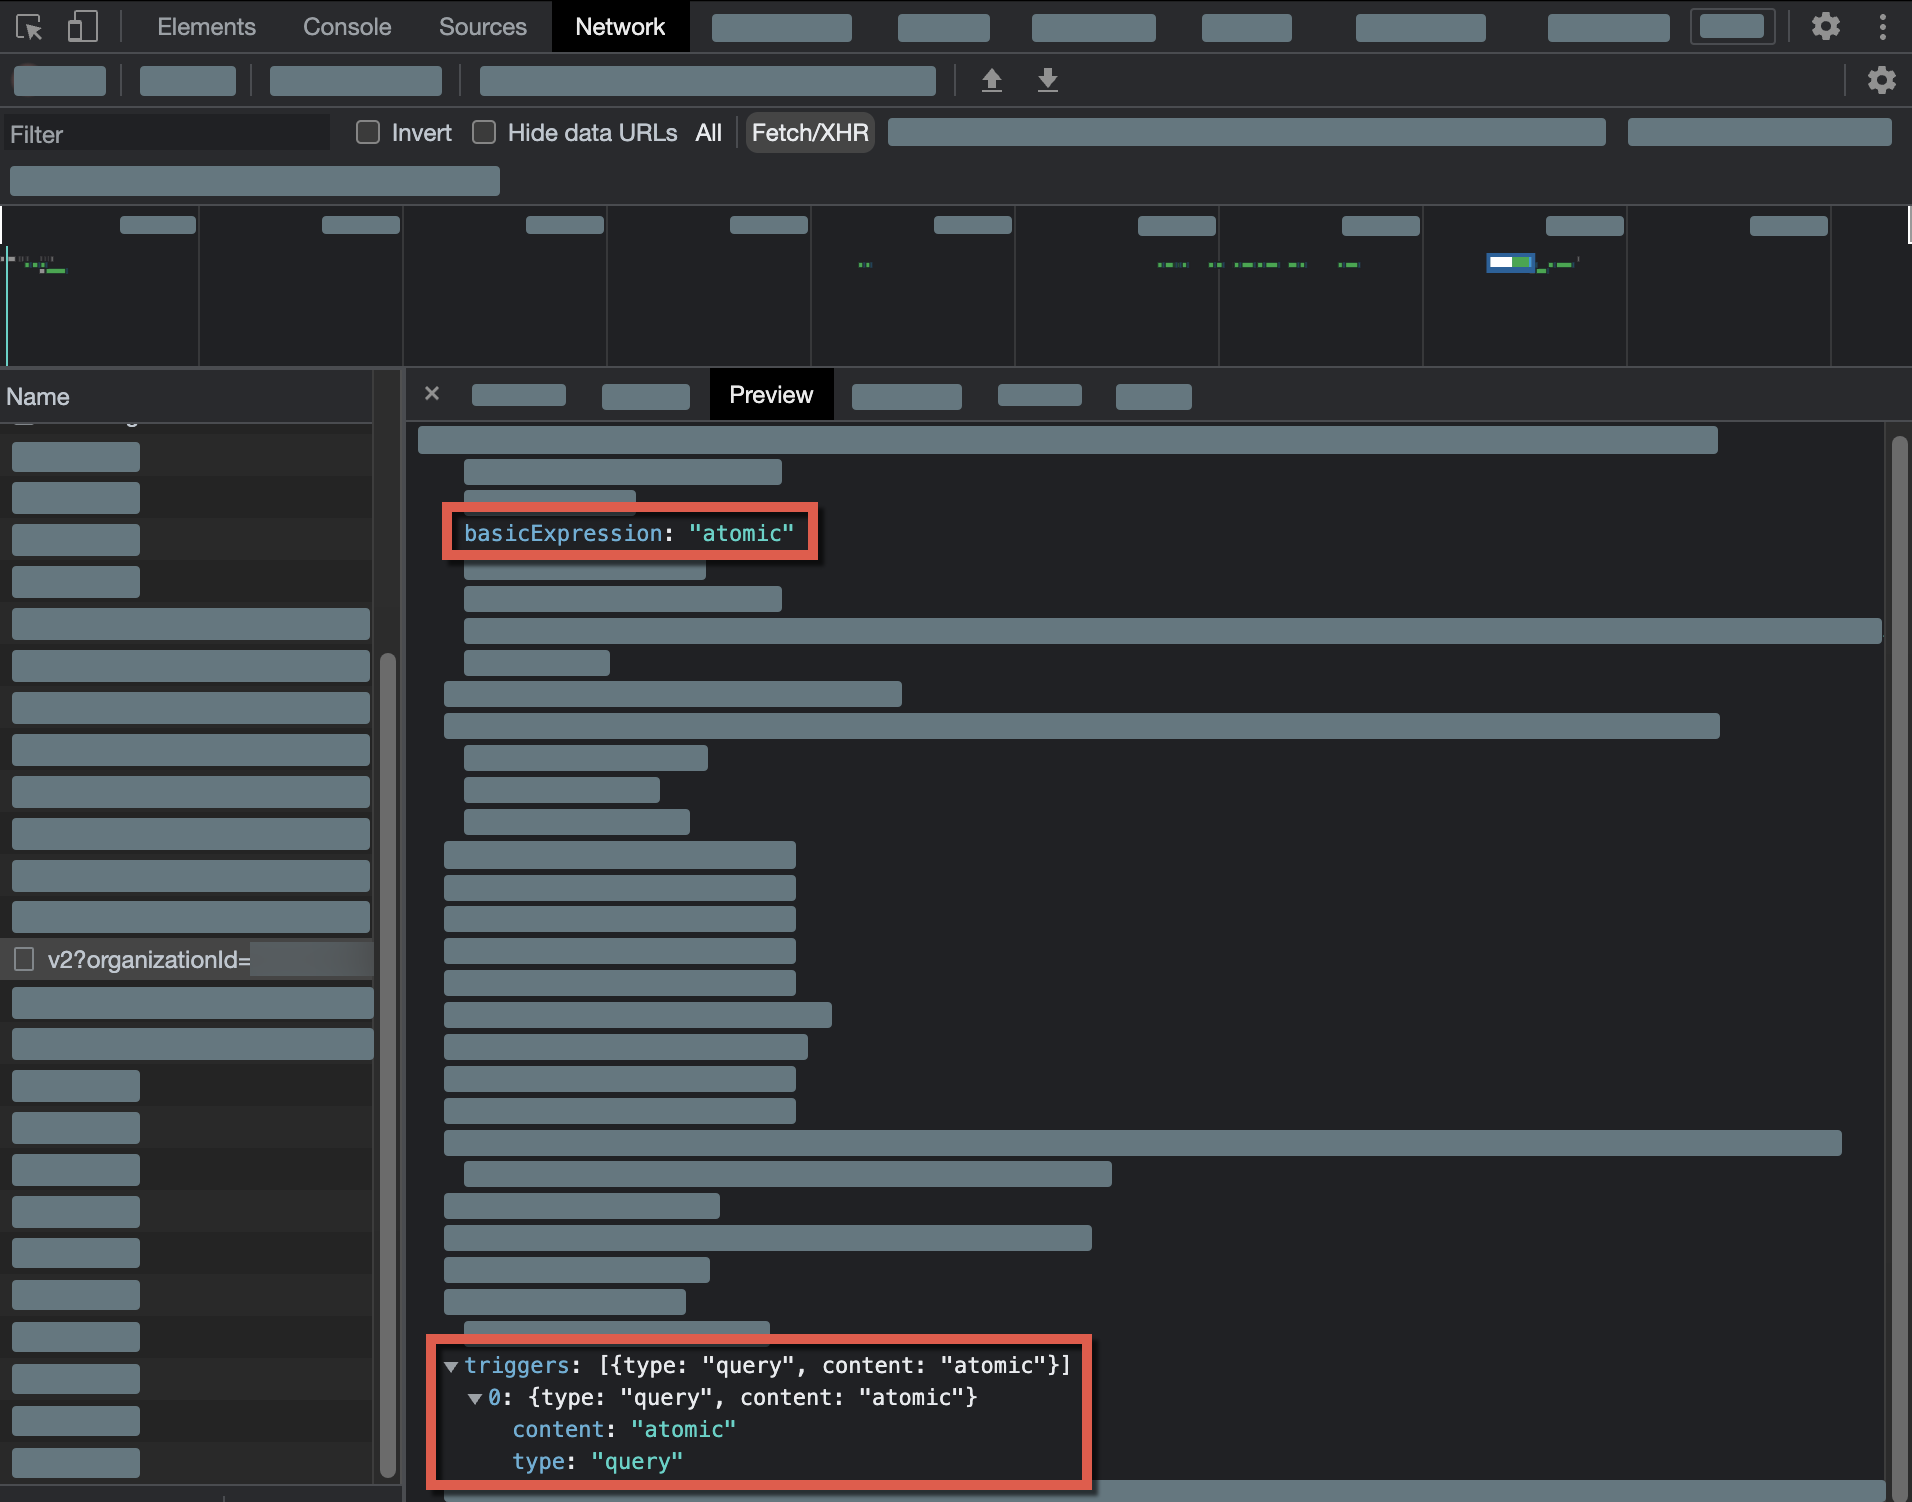
|
|
Note
You can’t validate a Query trigger rule in the Relevance Inspector. |
Execute
An Execute trigger rule lets you specify JavaScript functions to execute in the user’s browser.
-
Access the search interface in which you want to test a trigger rule.
-
In the search interface, reproduce the conditions that would launch a trigger rule (for example, performing a query).
-
Enable debugging mode by appending
&debug=trueto the current URL.
-
In the network monitoring tool, under the Name column, select the latest request to the Search API. The request path should contain
/rest/search/v2. -
Select the Preview tab, and then find and expand the
triggersproperty. -
Validate the values of the
triggersproperty.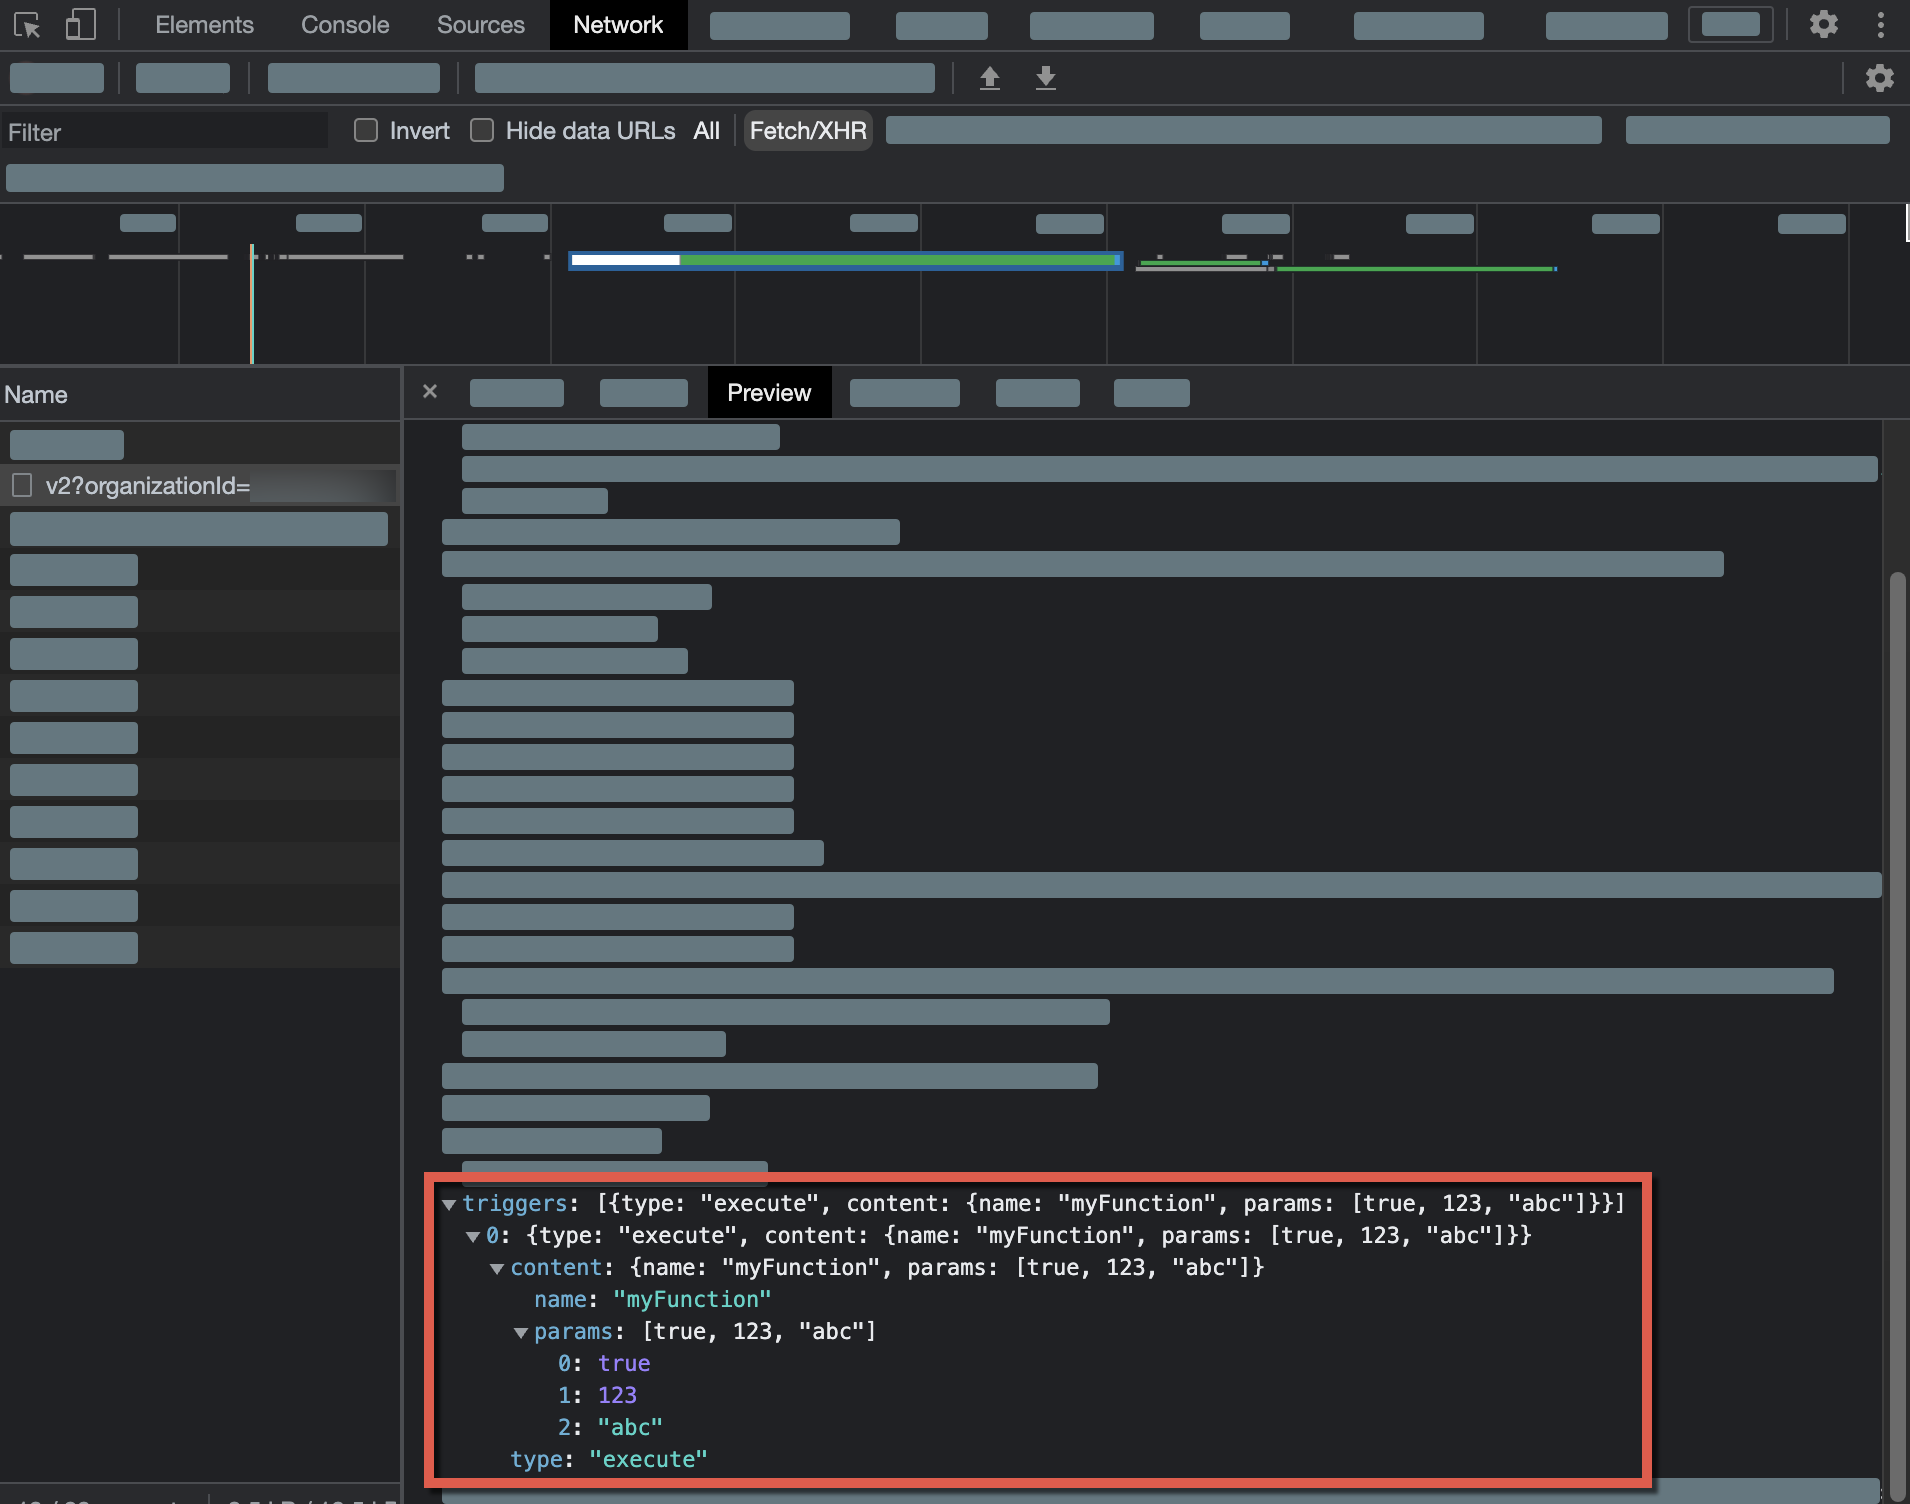
-
Access the Relevance Inspector:
-
If your search interface leverages the Atomic library, select and hold Alt (Windows) or Option (Mac) and double-click any search interface element.
-
In the modal that appears, select
Open, and you’ll be redirected to the Coveo Administration Console. You may have to wait for your query to load.
NoteYou can go directly to the Relevance Inspector (platform-ca | platform-eu | platform-au) page of the Coveo Administration Console. If you do, you’ll need to rerun the query in the Relevance Inspector using the query’s
SearchUid. You can find this value on the Preview tab of your network monitoring tool:
-
-
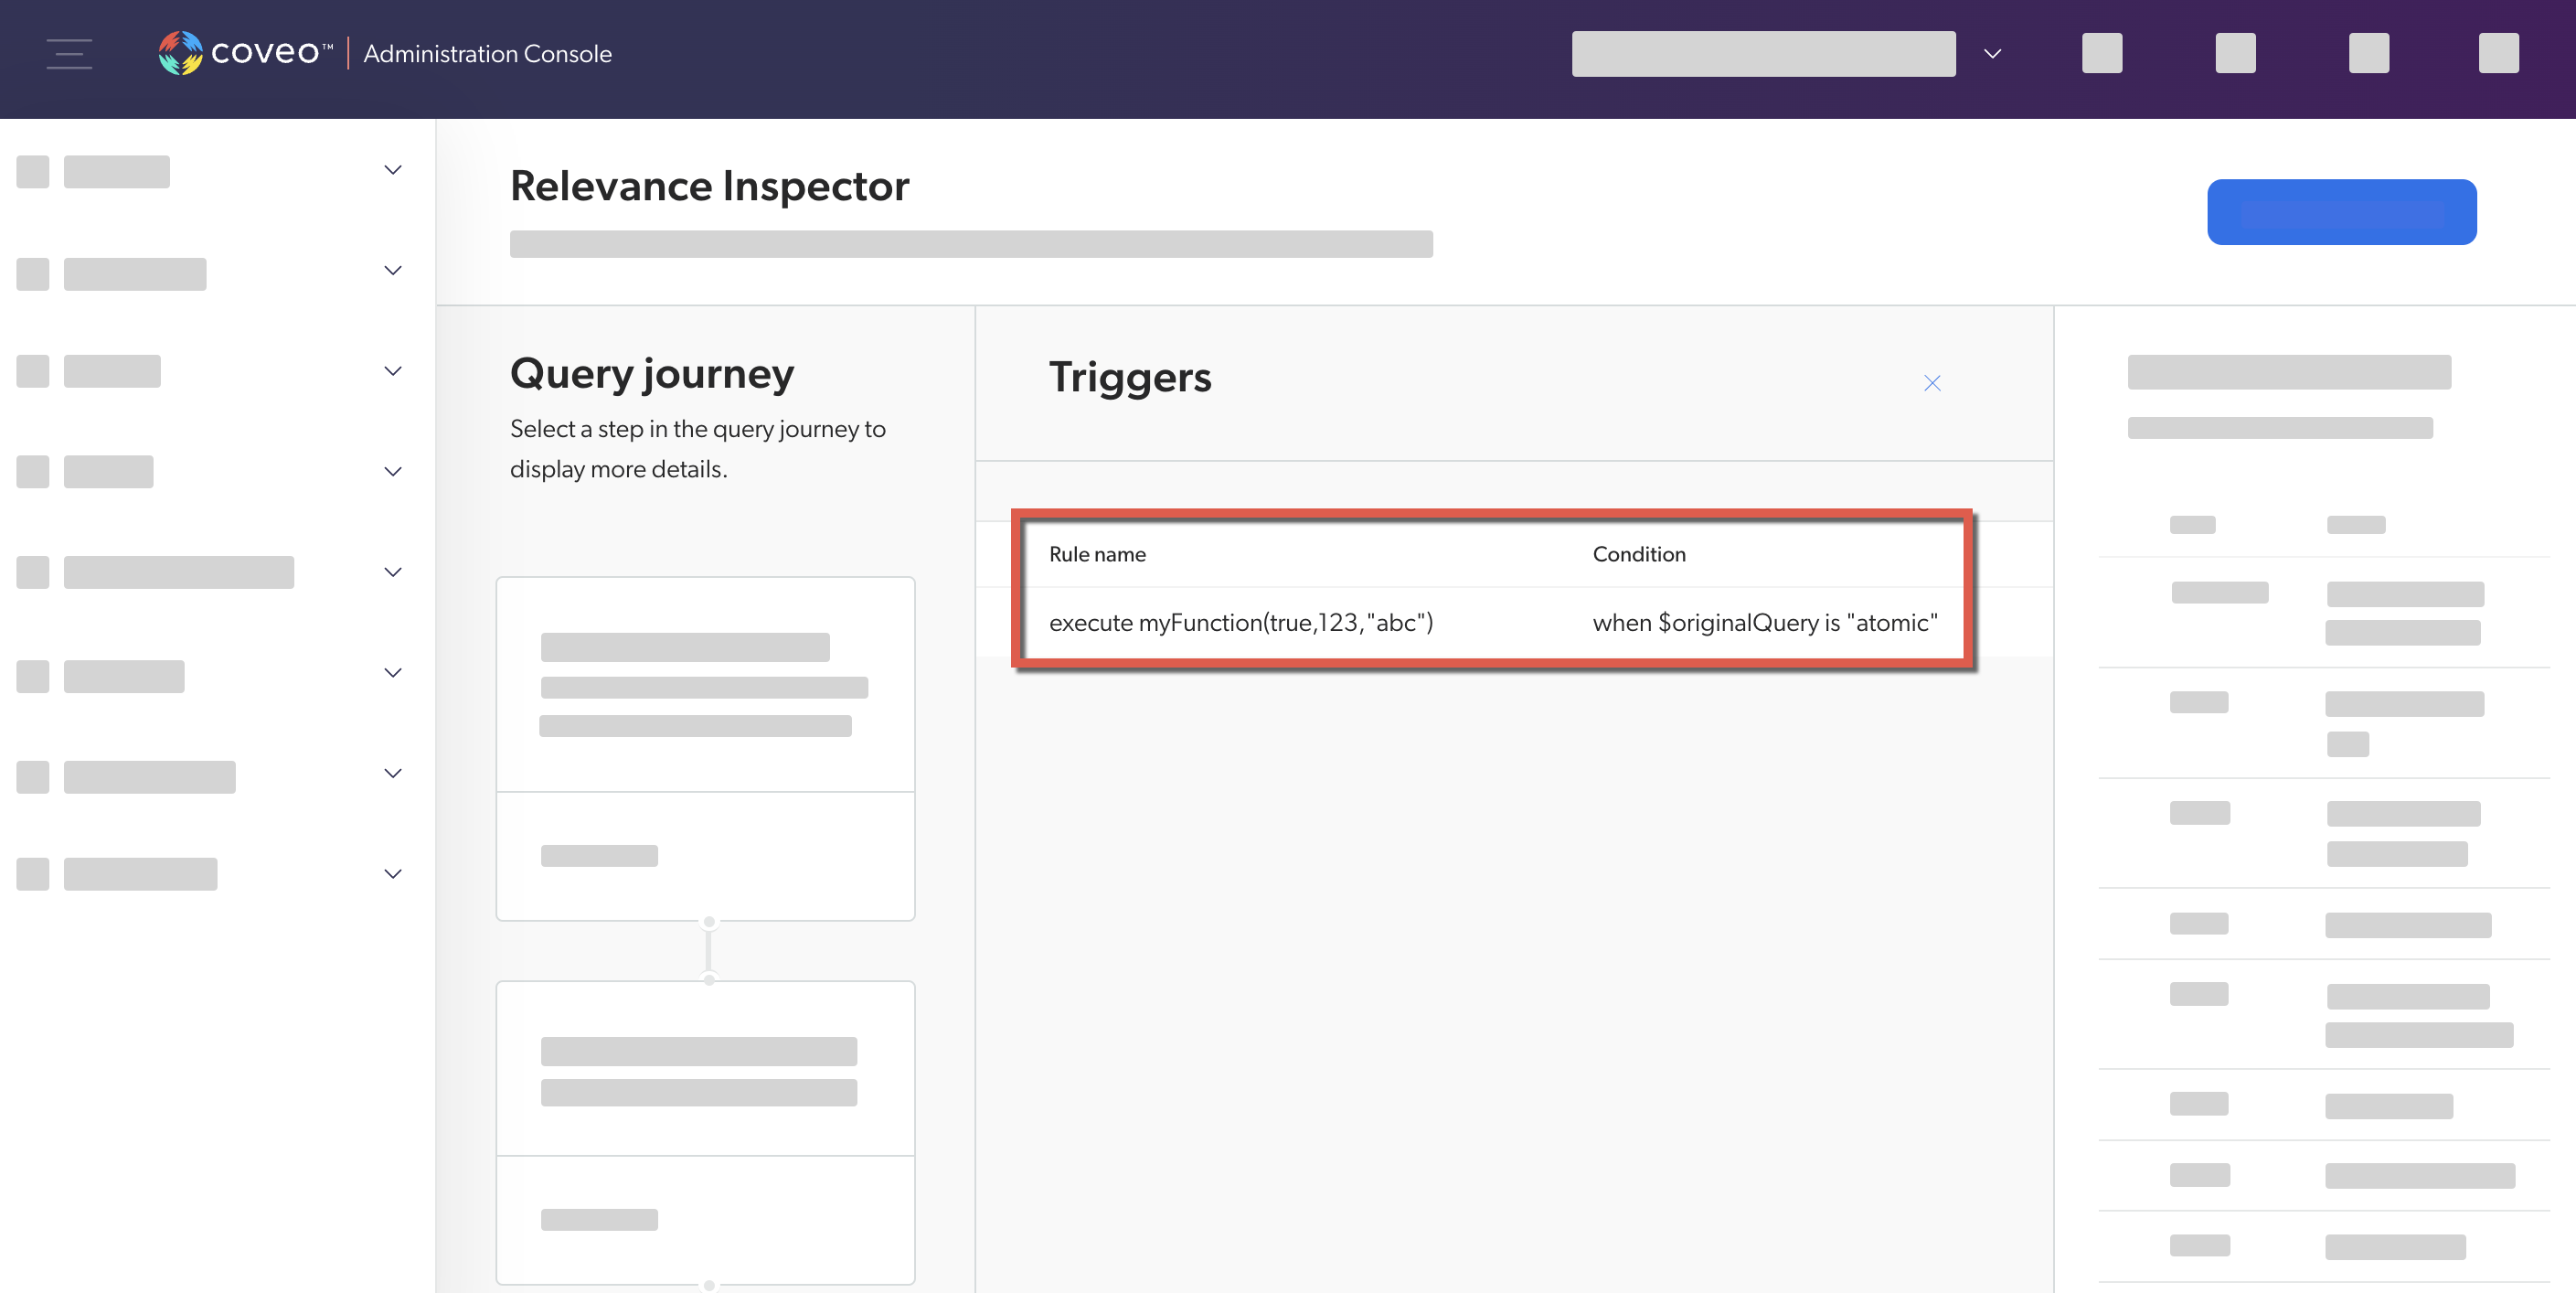
In the Relevance Inspector, the trigger rules are displayed under Query pipeline rules (the third step in the Query journey). Click See details for more information about the rule that was applied.
Redirect
A Redirect trigger rule redirects the user to a specific URL.
-
Access the search interface in which you want to test a trigger rule.
-
In the search interface, reproduce the conditions that would launch a trigger rule (for example, performing a query).
-
Validate that you are redirected to the expected URL.
-
In the network monitoring tool, under the Name column, select the latest request to the Search API. The request path should contain
/rest/search/v2. -
Select the Preview tab, and then find and expand the
triggersproperty. -
Validate the values of the
triggersproperty.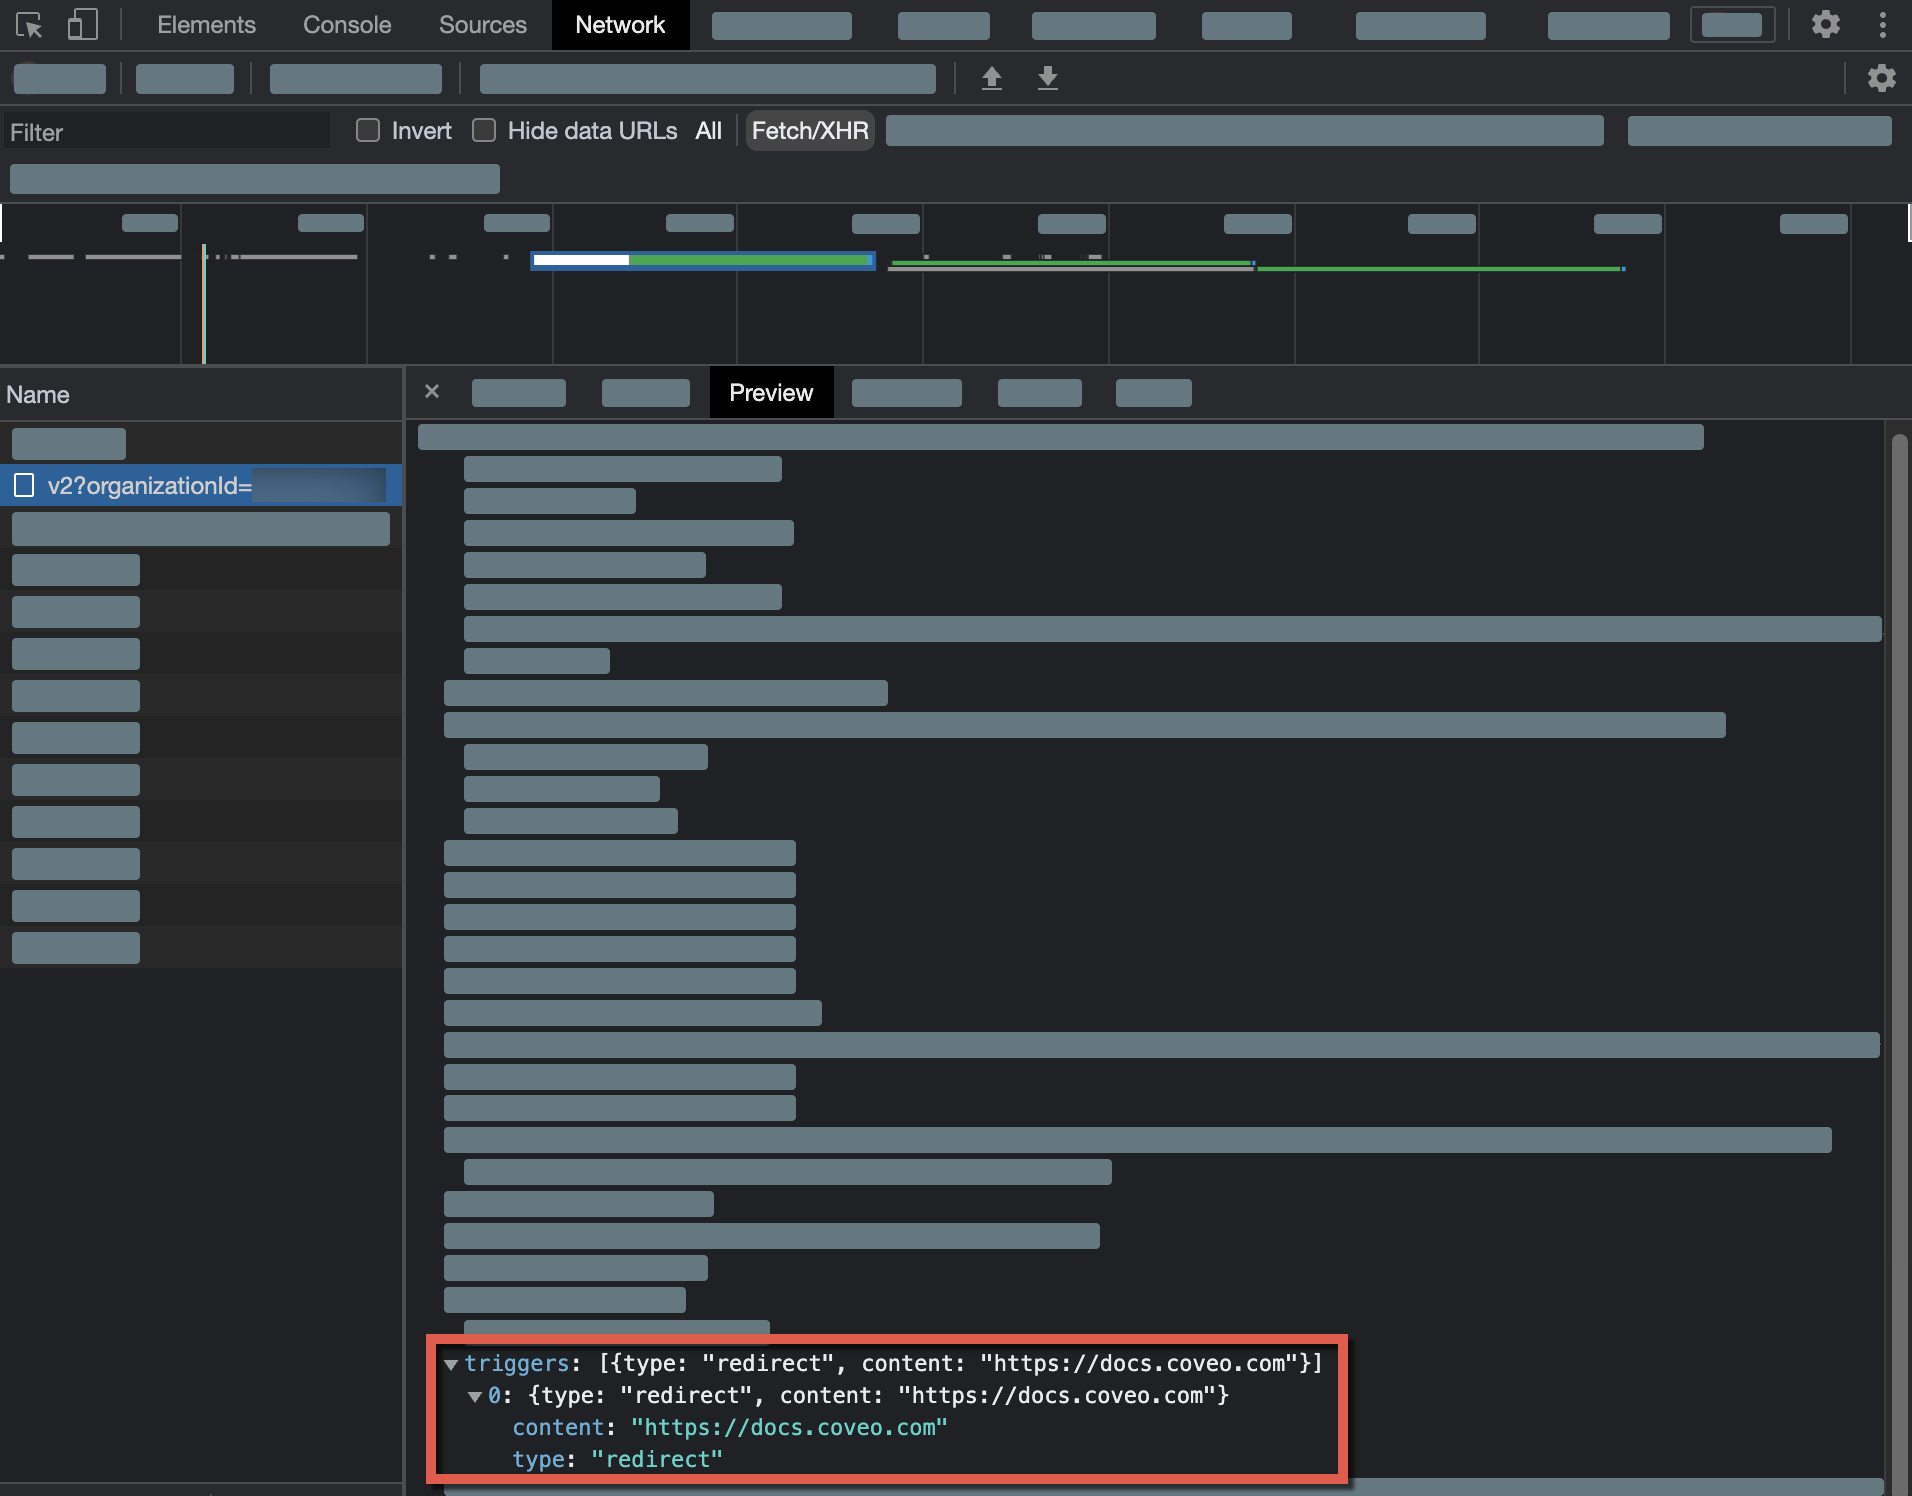
-
Access the Relevance Inspector:
-
If your search interface leverages the Atomic library, select and hold Alt (Windows) or Option (Mac) and double-click any search interface element.
-
In the modal that appears, select
Open, and you’ll be redirected to the Coveo Administration Console. You may have to wait for your query to load.
NoteYou can go directly to the Relevance Inspector (platform-ca | platform-eu | platform-au) page of the Coveo Administration Console. If you do, you’ll need to rerun the query in the Relevance Inspector using the query’s
SearchUid. You can find this value on the Preview tab of your network monitoring tool:
-
-
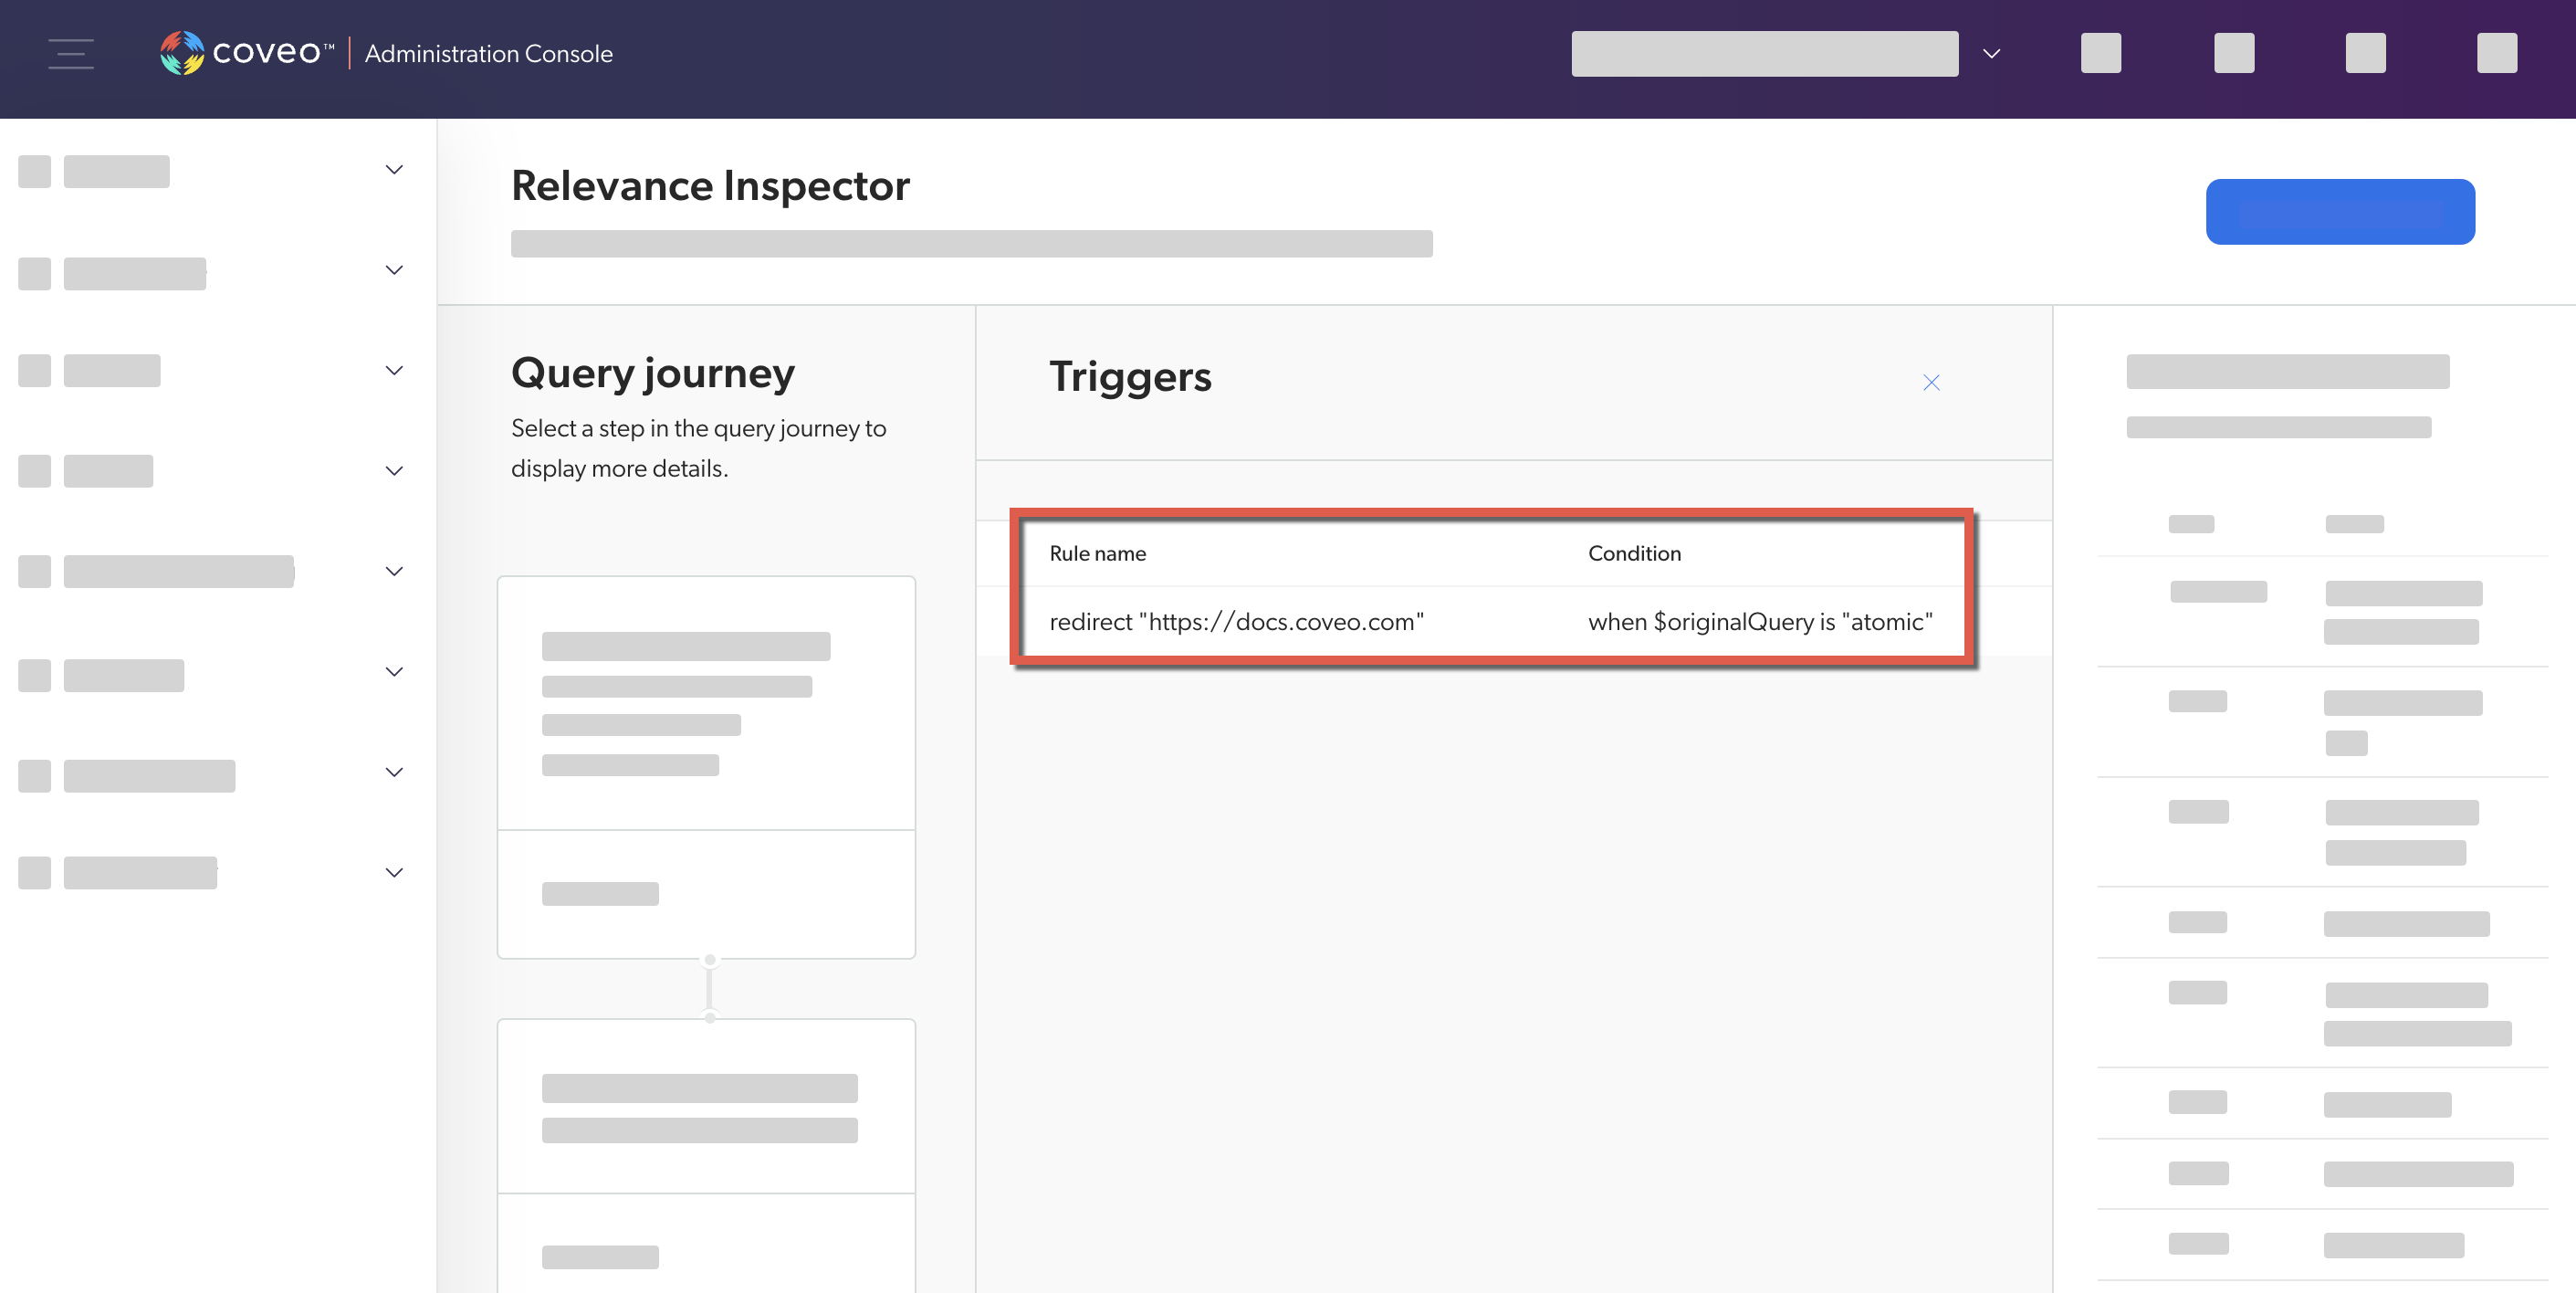
In the Relevance Inspector, the trigger rules are displayed under Query pipeline rules (the third step in the Query journey). Click See details for more information about the rule that was applied.
Query parameter rules
Query parameter rules can override query parameter values for every query that matches a condition.
If a query pipeline contains query parameter rules, review its configuration and test several entries in a search interface to ensure that the rules work as expected.
Review query parameter rules configuration
-
In the Query Pipelines (platform-ca | platform-eu | platform-au) page of the Administration Console, select the query pipeline for which you want to review query parameter rules configuration. Then, in the Action bar, click Edit components.
-
Select the Advanced tab, and then select Query parameters.
-
Validate the query parameter rules’ configuration and associated conditions.
Test query parameter rules in a search interface
-
Access the search interface in which you want to test a query parameter rule.
-
In the search interface, reproduce the conditions that would trigger a query parameter rule (for example, performing a query).
-
Enable debugging mode by appending
&debug=trueto the current URL.
-
In the network monitoring tool, under the Name column, select the latest request to the Search API. The request path should contain
/rest/search/v2. -
Select the Preview tab.
-
Find and expand the
executionReportproperty, and then expand thechildrensub-property. -
Expand the
ApplyQueryParamOverrideFeatureproperty. If you see a value for theappliedsub-property, this means that a query parameter rule was applied for this query. -
Expand the
appliedsub-property to see the definition of the rule that was applied.In the following capture, the rule overrides the
enableQuerySyntaxquery parameter: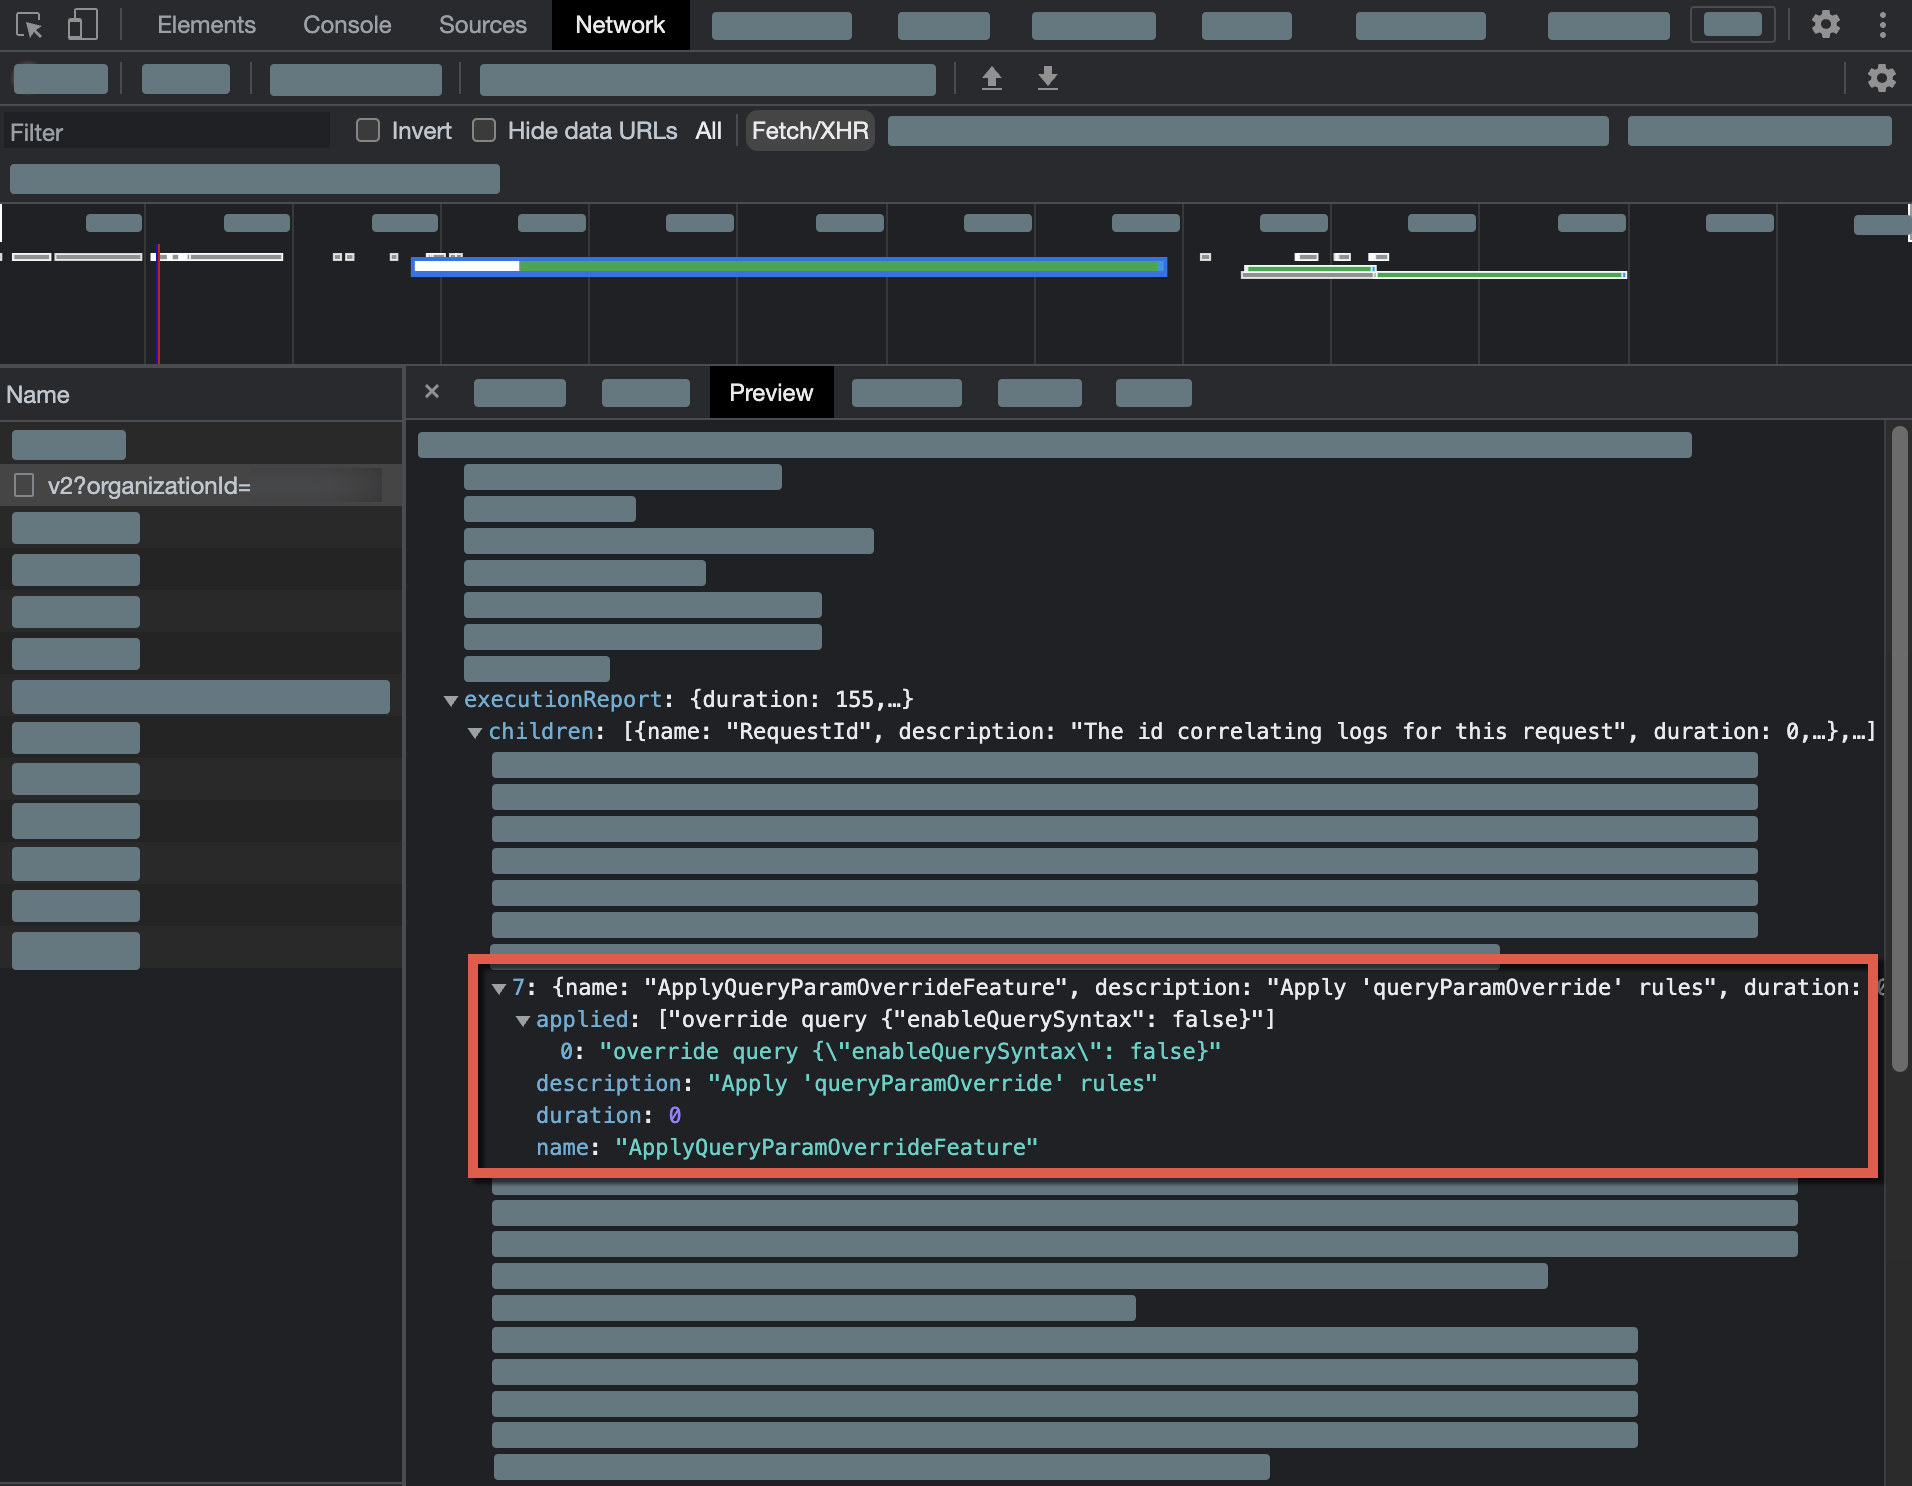
-
Access the Relevance Inspector:
-
If your search interface leverages the Atomic library, select and hold Alt (Windows) or Option (Mac) and double-click any search interface element.
-
In the modal that appears, select
Open, and you’ll be redirected to the Coveo Administration Console. You may have to wait for your query to load.
NoteYou can go directly to the Relevance Inspector (platform-ca | platform-eu | platform-au) page of the Coveo Administration Console. If you do, you’ll need to rerun the query in the Relevance Inspector using the query’s
SearchUid. You can find this value on the Preview tab of your network monitoring tool:
-
-
In the Relevance Inspector, the query parameter rules are displayed under Query pipeline rules (the third step in the Query journey). Click See details for more information about the rule that was applied.

Filters
Query pipeline filter rules define the scope of the search results displayed to your users.
If a query pipeline contains filter rules, review its configuration and test several entries in a search interface to ensure that the rules work as expected.
|
|
Filters, by themselves, don’t prevent the exposure of filtered content. We strongly advise against creating a source whose content is accessible to everyone and using a pipeline filter to exclude sensitive information. In the following cases, sensitive content from a source whose content is accessible to everyone could be exposed:
You can ensure security by enforcing the search hub at the search token level (see Search token authentication). Moreover, search hubs defined on the client-side that are used as conditions in pipelines don’t safeguard the security of the filtered content. |
Review filter rules configuration
-
In the Query Pipelines (platform-ca | platform-eu | platform-au) page of the Administration Console, select the query pipeline for which you want to review filter rules configuration. Then, in the Action bar, click Edit components.
-
Select the Advanced tab, and then select Filters.
-
Validate the filter rules’ configuration and associated conditions.
Test filter rules in a search interface
-
Access the search interface in which you want to test a filter rule.
-
In the search interface, reproduce the conditions that would trigger a filter rule (for example, performing a query).
-
Enable debugging mode by appending
&debug=trueto the current URL.
-
In the network monitoring tool, under the Name column, select the latest request to the Search API. The request path should contain
/rest/search/v2. -
Select the Preview tab.
-
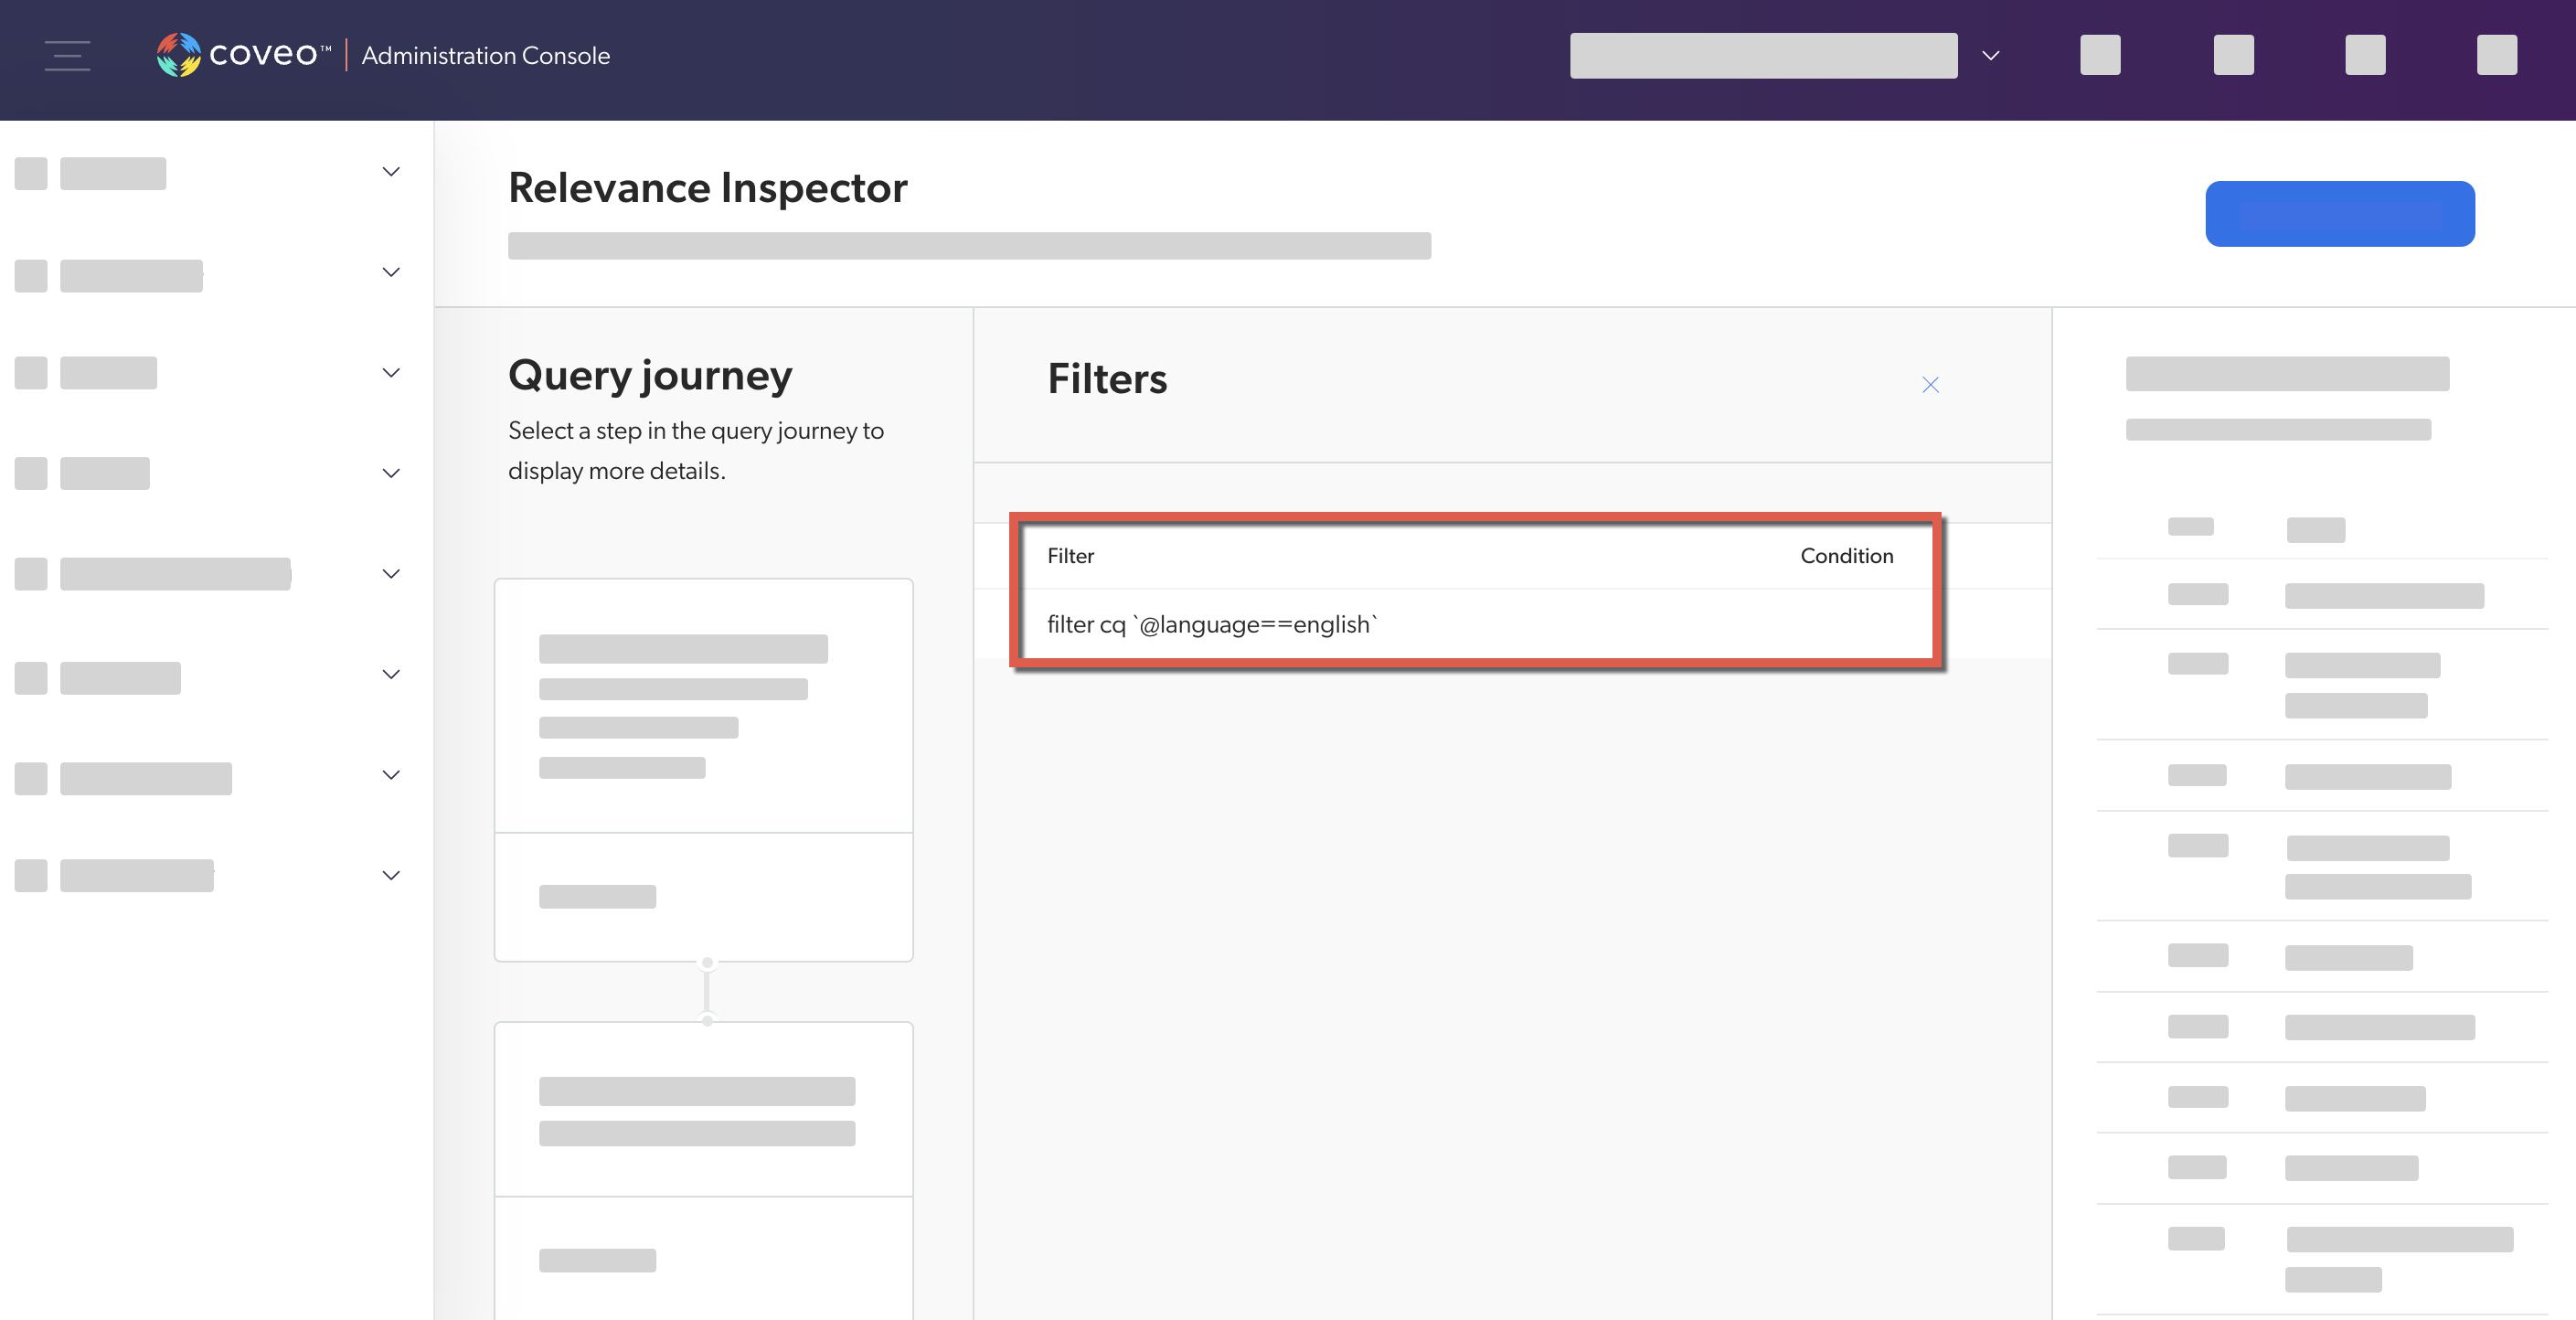
Filter rules can take effect on the basic query expression (
q), advanced query expression (aq), constant query expression (cq), disjunction query expression (dq), or large query expression (lq). Verify that the expression associated to this property matches the rule.In the following capture, the filter rule affects
cqso that the search interface only displays items for which the value of thelanguagefield isenglish: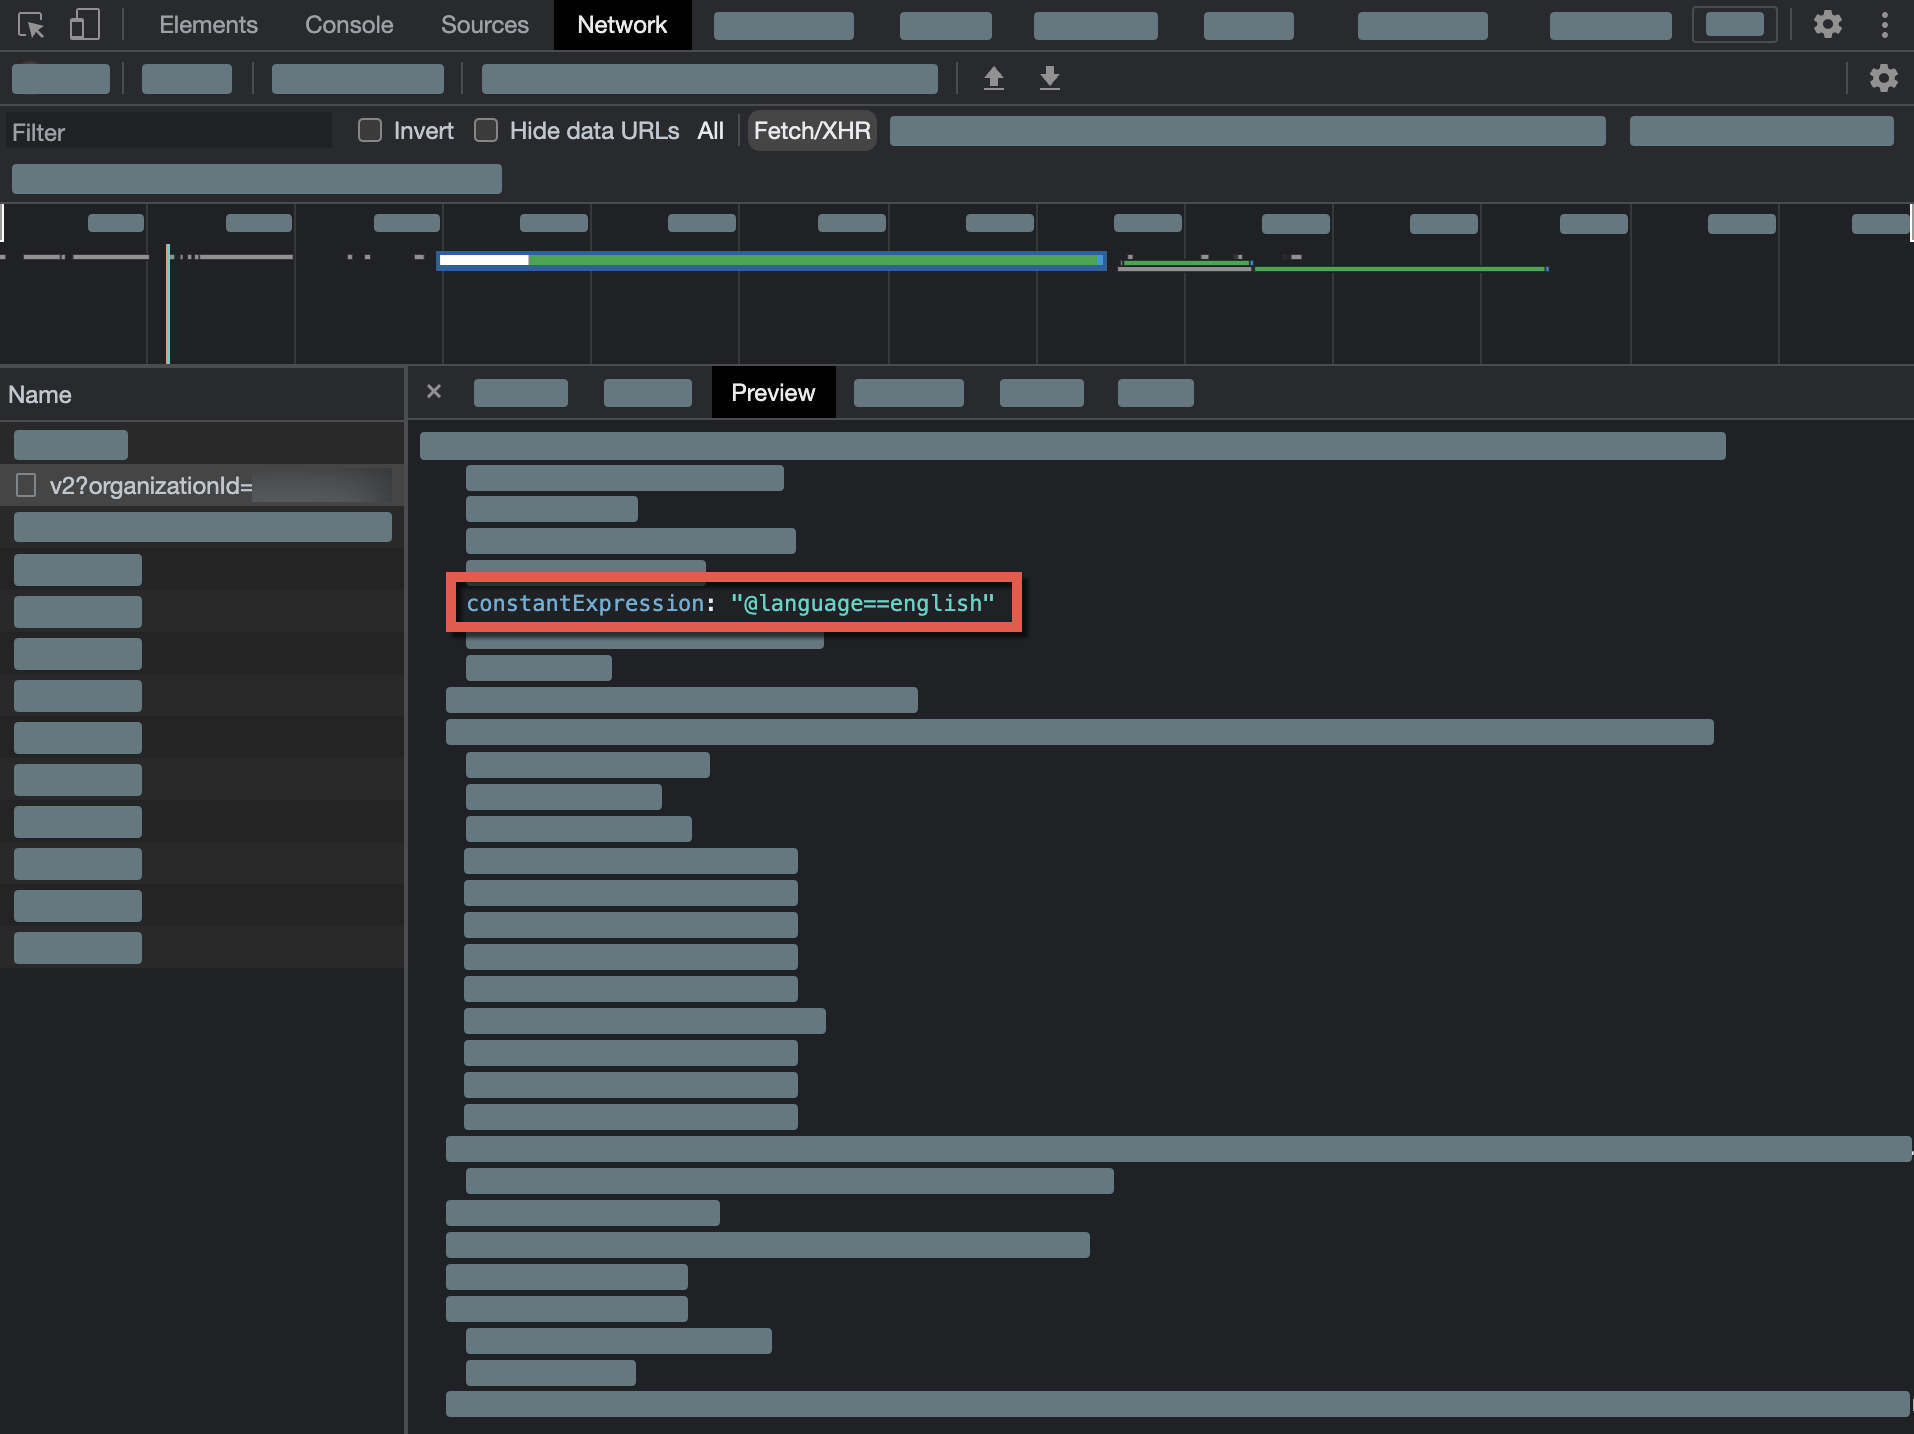
-
Access the Relevance Inspector:
-
If your search interface leverages the Atomic library, select and hold Alt (Windows) or Option (Mac) and double-click any search interface element.
-
In the modal that appears, select
Open, and you’ll be redirected to the Coveo Administration Console. You may have to wait for your query to load.
NoteYou can go directly to the Relevance Inspector (platform-ca | platform-eu | platform-au) page of the Coveo Administration Console. If you do, you’ll need to rerun the query in the Relevance Inspector using the query’s
SearchUid. You can find this value on the Preview tab of your network monitoring tool:
-
-
In the Relevance Inspector, the filter rules are displayed under Query pipeline rules (the third step in the Query journey). Click See details for more information about the rule that was applied.