Validate usage analytics metadata
Validate usage analytics metadata
When logging Coveo Analytics events, you should ensure that you send the right data to Coveo Analytics and Coveo Machine Learning (Coveo ML).
This is particularly important in the following scenarios:
-
Your implementation doesn’t rely on any Coveo search UI library (Atomic, Headless, or Quantic).
-
Your implementation relies on one of these libraries, but it includes custom code that can modify standard UA events.
-
Your implementation relies on one of these libraries, and you’re pushing custom user context.
|
|
This guide provides guidelines to analyze, review, and test different aspects of a Coveo-powered implementation. It shouldn’t be considered an official, definitive guide to testing an implementation before it goes live, but rather a guide showcasing the basic components that Coveo implementations typically include. Every Coveo implementation is different and may require custom configuration. Therefore, you may notice discrepancies between the components and features listed in this guide and those you’re using in your actual implementation. If you encounter issues, or have any questions related to this article, contact Coveo Support for help. |
Access your browser’s network monitoring tool
-
Open your web browser’s developer tools.
 Note
NoteThis article uses the Google Chrome developer tools. For browser-specific information, see:
-
Select the Network tab.
Usage analytics event properties
The following table indicates the properties that are sent to Coveo Analytics and Coveo ML, depending on the logged event type.
| Event category | Body properties |
|---|---|
Search events |
|
Click events |
|
View events |
|
Custom events |
Validate usage analytics event property values
-
Access your Coveo-powered search interface.
-
In the search box, perform a query.
-
Enable debugging mode by appending
&debug=trueto the current URL.
-
In the network monitoring tool, under the Name column, select a request to the Search API. Depending on the category of the event that you want to inspect, the request path should contain one of the following:
-
/rest/ua/v15/analytics/search -
/rest/ua/v15/analytics/click -
/rest/ua/v15/analytics/view -
/rest/ua/v15/analytics/custom
-
-
You can see the values for each logged property on the Payload tab.
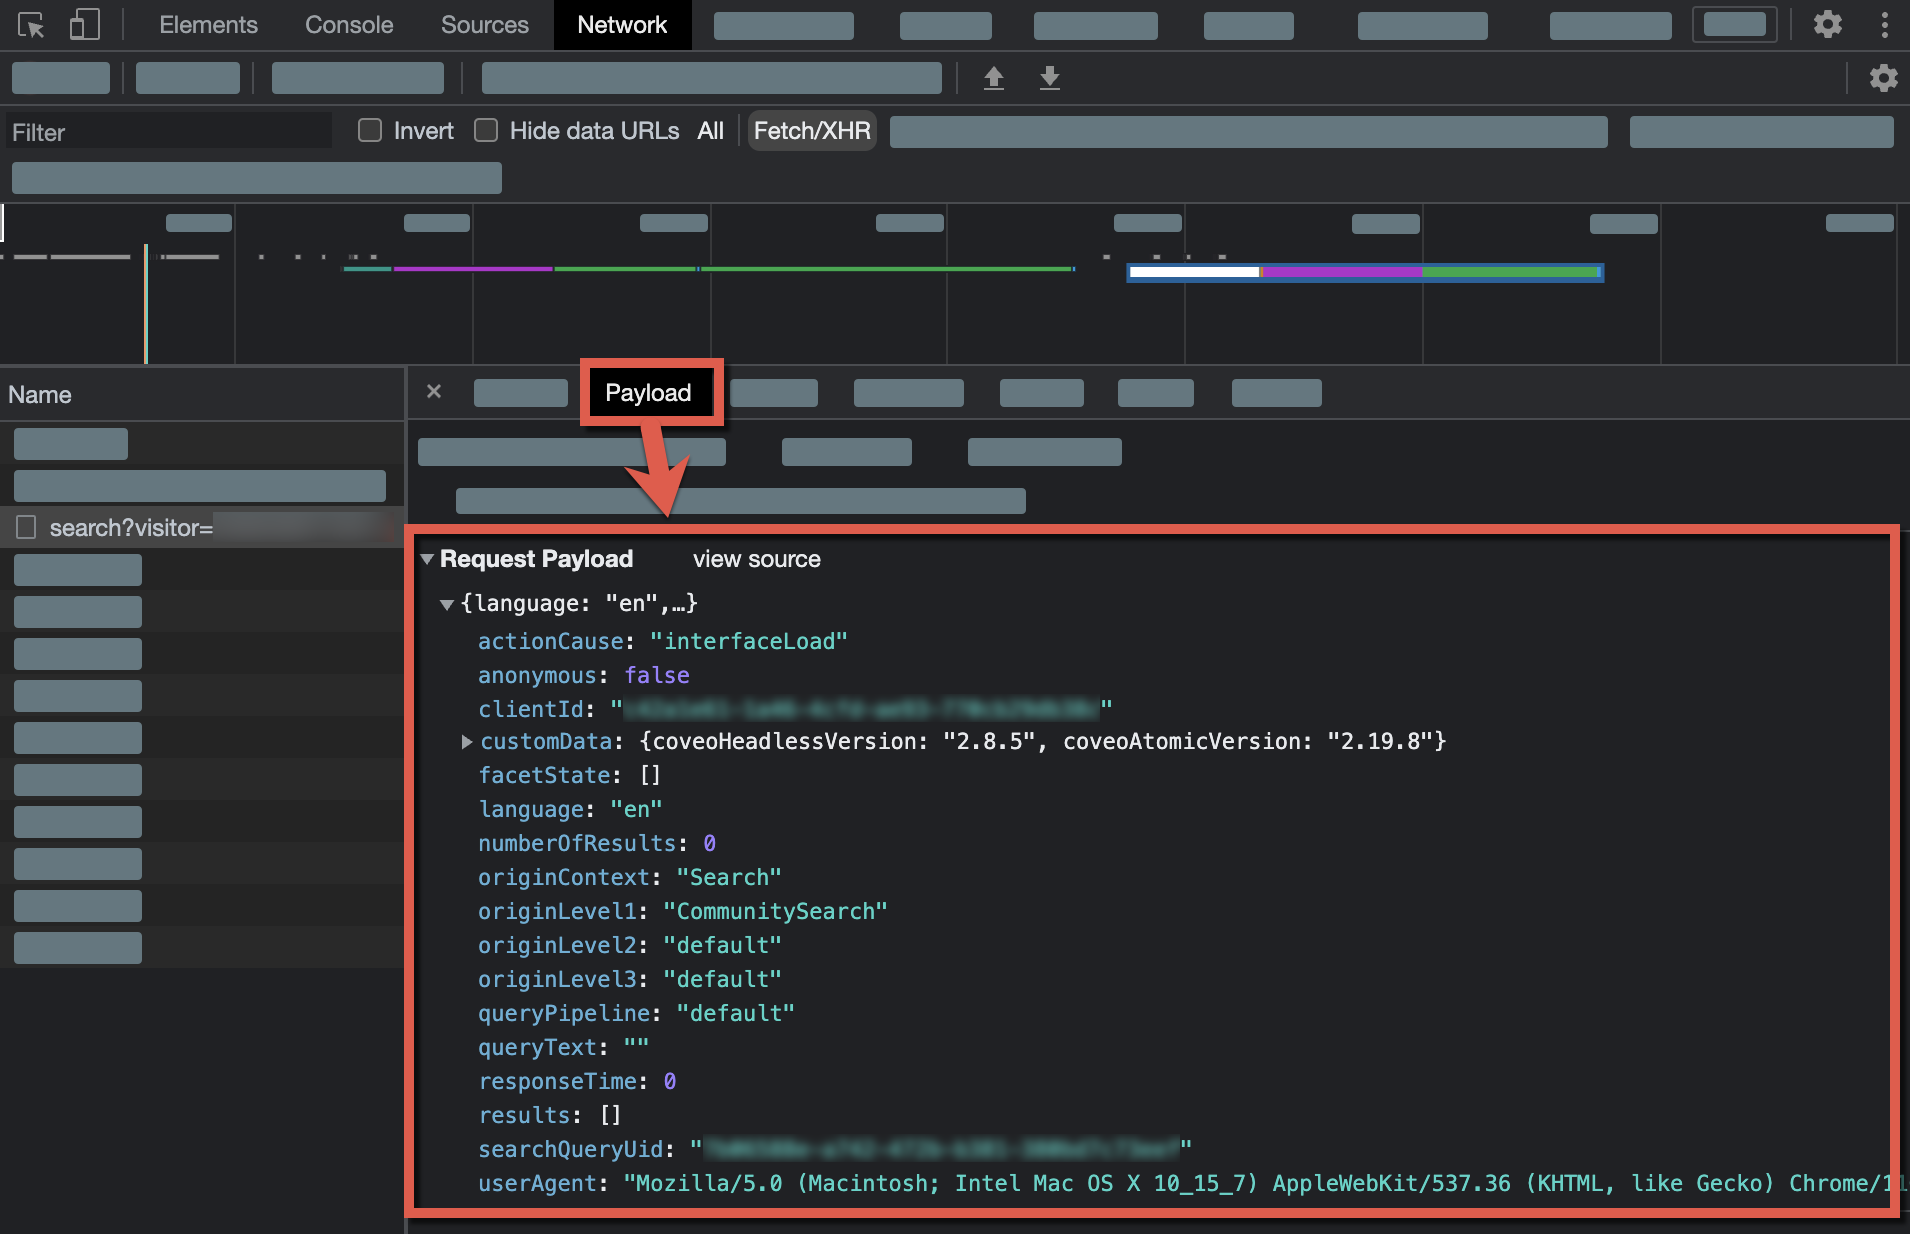
Some of these values must match those which were passed in the corresponding request to the Search API. You should make sure that the right values are being sent.
|
|
You should validate the |
-
Click the corresponding request to the Search API. The request path should contain
/rest/search/v2. -
Select the Preview tab.
-
Find and expand the
executionReportproperty, and then expand thechildrensub-property. -
Expand the last
ResolveContextproperty, and then expand theresultsub-property.
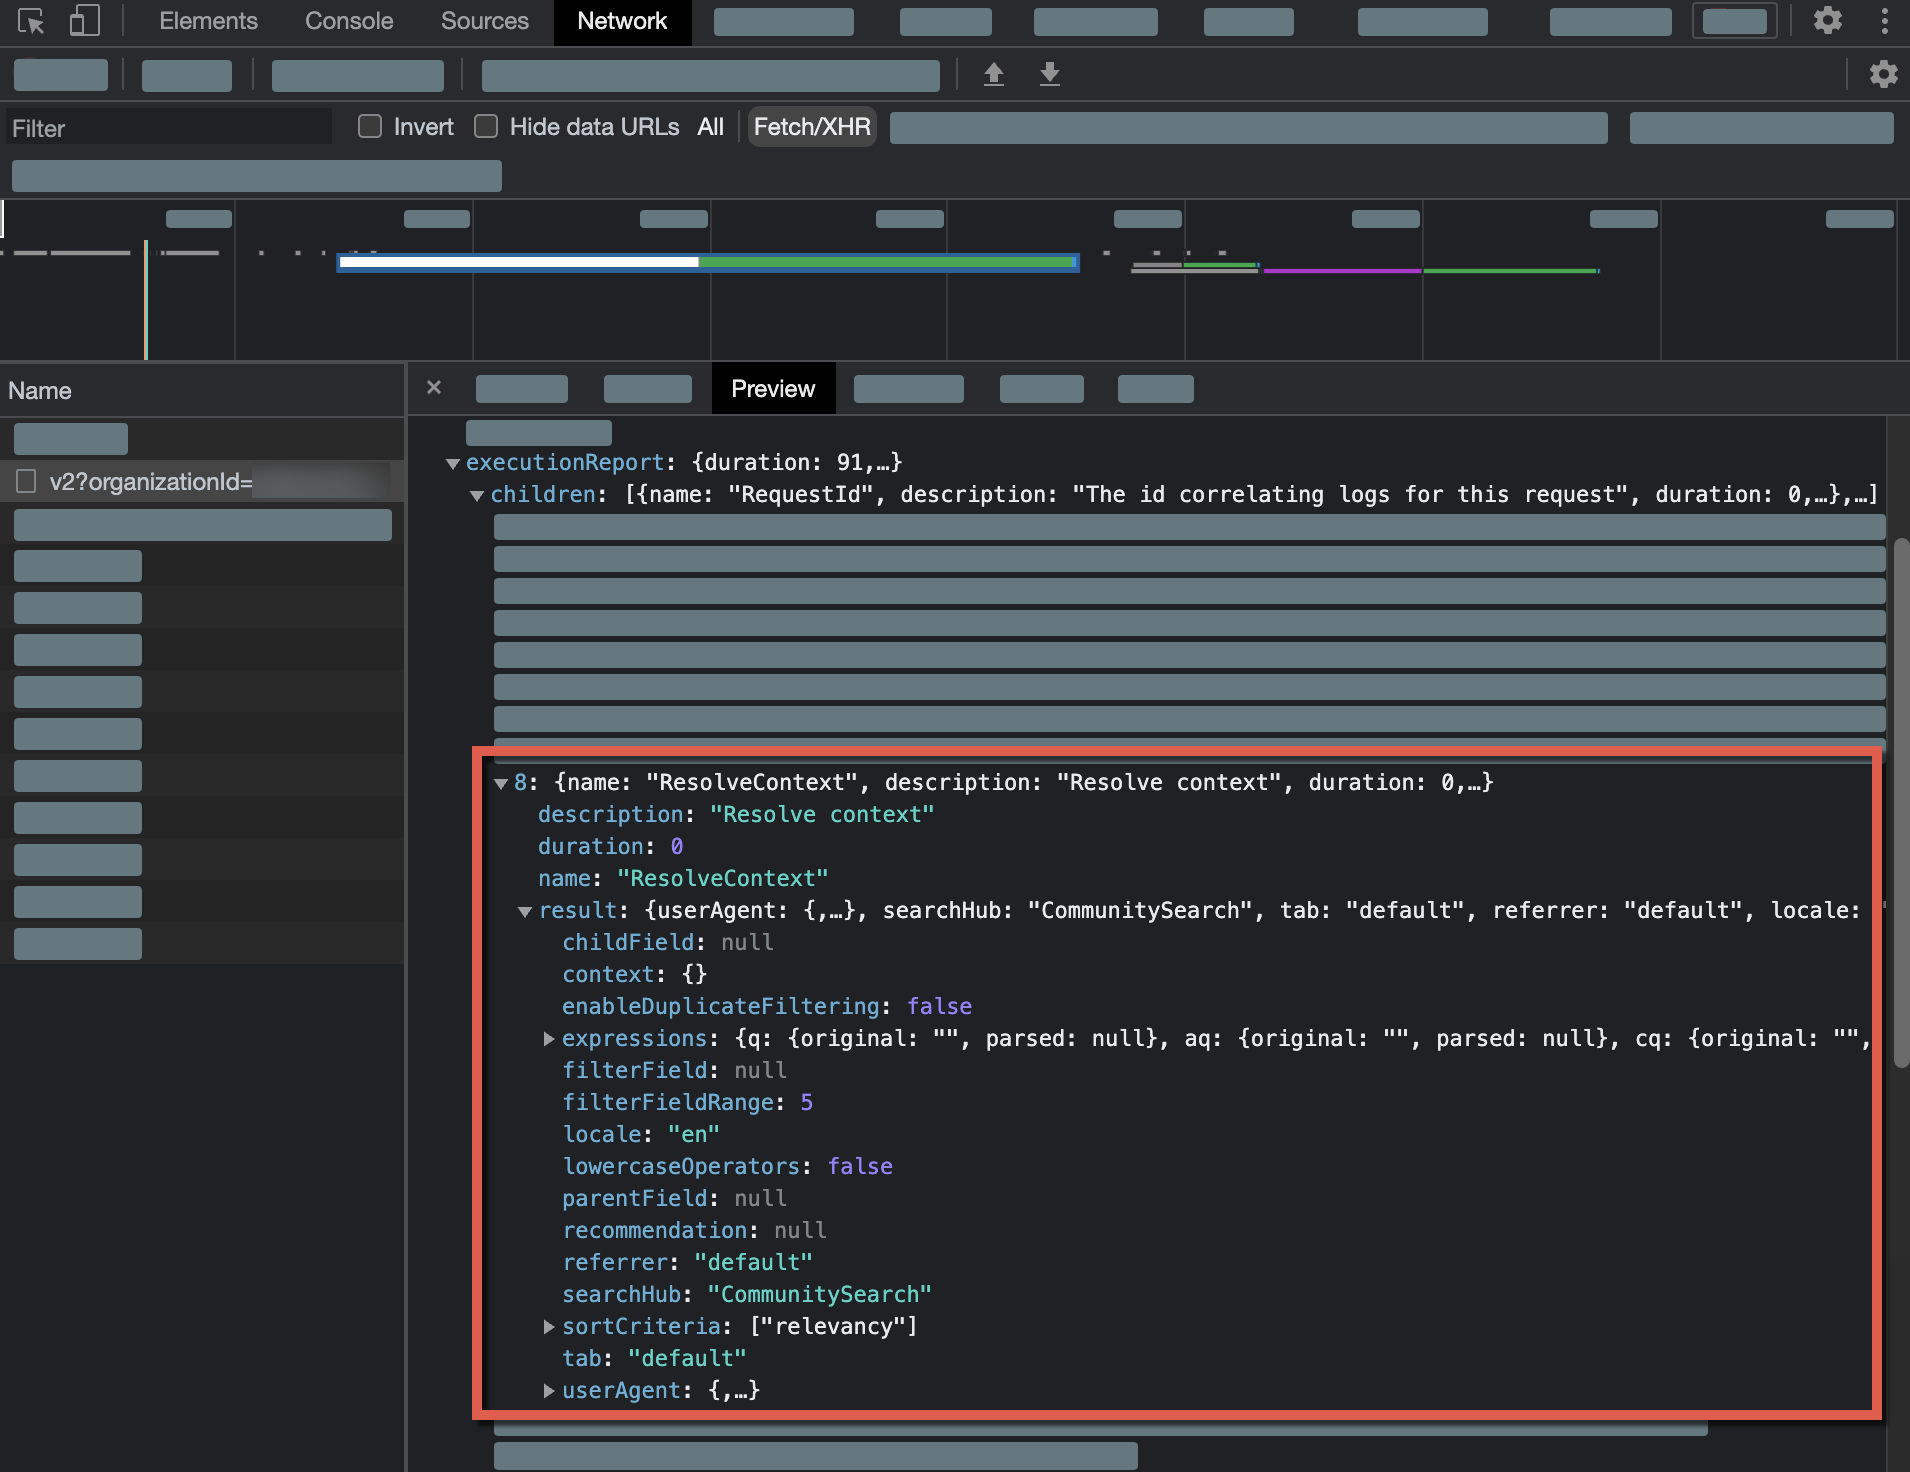
You can now compare these values to those found in the UA event request payload.
Coveo ML uses search hub and tab values to separate its models. If the search hub or tab values of your queries and UA events don’t correspond, Coveo ML won’t be able to suggest relevant content.
The following table shows the equivalent Search API and Usage Analytics API properties:
| Query value | Usage analytics event value |
|---|---|
|
|
|
|
If these equivalent properties have different values, Coveo ML won’t consider the query and UA events to be related. This will prevent Coveo ML rules from applying.
|
|
Note
You can find the 
|