Generate Hosted Insight Panel reports
Generate Hosted Insight Panel reports
Members with the required privileges can use the Analytics section of the Coveo Administration Console to create custom Coveo Analytics dashboards.
This article describes how to generate a custom Support Agents dashboard to report on the performance of your Hosted Insight Panel. It also provides an overview of the available metric cards.
|
|
Notes
|
Support Agents dashboard
This dashboard provides an overview of your agent and Insight Panel performances. The report also analyzes the level of adoption of your panel by measuring the number of agents performing key actions such as using the Full Search page and attaching search results to cases.

|
|
Note
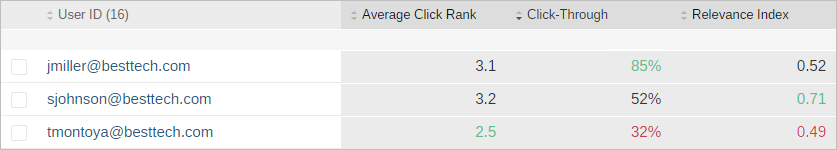
Relevance metrics (Average Click Rank, Search Event Clickthrough, and Relevance Index) values (if any) have a color that represents if the value is good (green), neutral (black), or poor (red) depending on predefined thresholds. The predefined thresholds for each metric are the following:
|
Step 1: Add a custom dimension
If your Coveo organization doesn’t already have a custom dimension (usually named c_caseid) that uniquely identifies your support cases, you must add one.
Otherwise, some metric cards in the Support Agents dashboard won’t load.
-
On the Dimensions (platform-ca | platform-eu | platform-au) page, click Add dimension.
-
In the Add a dimension panel, specify the following information:
-
In the Display name field, enter
Case IDas the dimension’s display name. -
Leave the Semi-structured dimension checkbox unselected.
-
Click the API name field and enter
caseid. -
Under Type, select Text, Boolean, Date, and Number.
-
Under Related events, select Search, Click, and Custom event.
-
-
Click Add dimension.
Step 2: Add a Support Agents dashboard
-
On the Reports (platform-ca | platform-eu | platform-au) page, click Add, and then select Dashboard from template.
-
In the Select a Template panel, select the Support Agents Adoption template.
-
Click Select Template.
-
In the Add Support Agents Adoption Report panel:
-
In the first input, enter the Total number of agents in your organization, or the number of agents allowed by your Coveo license. You can find this information on the License & Usage (platform-ca | platform-eu | platform-au) page.
-
Under Select custom dimension name (unique case identifier), click the dropdown menu, and then select the custom dimension (usually c_caseid) that uniquely identifies your support cases (see Step 1: Add a custom dimension).
-
Under Select agent side panel (Origin level 1), click the dropdown menu, and then select the search hub value that was automatically generated when you created the Hosted Insight Panel configuration.
-
Under Select agent full search page (Origin level 1), click the dropdown menu, and then select the search hub value of the Full Search page that can be accessed from the Hosted Insight Panel.
-
Click Add report.
-
-
(Optional) In the upper-left corner of the report, rename the dashboard.
-
(Optional) Below the title, enter a new description for the dashboard.
-
(Optional) In the upper-right corner, specify a date range for the reporting period.
-
Click Save.
The report is now available on the Reports (platform-ca | platform-eu | platform-au) page.
|
|
Note
For information on managing dashboard reports, see Review and manage dashboards. |
Cards and metrics
This section describes the metric cards that are available in the Agent Metrics and Agent Adoption tabs of the Support Agents dashboard. All metrics take the specified reporting period into account.
Agent metrics
The following table lists the available metric cards on the Agent Metrics tab of the Support Agents dashboard.
| Card | Description |
|---|---|
# of Cases |
Total number of cases created. |
Average Cases per Agent |
Average number of cases handled by an agent. |
Average Manual Search Events per Case |
Average number of manual search events performed per case. |
# of Agents |
Total number of agents in your organization or total number of agents allowed by your Coveo license. You can find this information on the License & Usage (platform-ca | platform-eu | platform-au) page. |
Average Attach to Case per Case |
Average number of attach to case actions performed per case. |
# of Manual Search Events |
Total number of manual search events performed. |
Average Manual Search Events per Agent |
Average number of manual search events performed by an agent. |
Average Attach to Case per Agent |
Average number of attach to case actions performed by an agent. |
Agent Adoption
The following table lists the available metric cards on the Agent Adoption tab of the Support Agents dashboard.
| Card | Description |
|---|---|
# of Agents Performing Manual Search Events |
Total number of agents who performed manual search events. |
Adoption Rate |
Rate of adoption for the Hosted Insight Panel. |
# of Agents Using Facets |
Total number of agents who used facets in the Hosted Insight Panel. |
Percentage of Agents Using Manual Search Events |
Percentage of agents who performed manual search events. |
# of Agents Using Context |
Total number of agents who used custom context. |
Percentage of Agents Using Facets |
Percentage of agents who used facets in the Hosted Insight Panel. |
# of Agents |
Total number of agents in your organization or total number of agents allowed by your Coveo license. You can find this information on the License & Usage (platform-ca | platform-eu | platform-au) page. |
Percentage of Agents Using Context |
Percentage of agents who used custom context. |
# of Agents Using Tab |
Total number of agents who used tabs in the Hosted Insight Panel. |
Percentage of Agents Using Tab |
Percentage of agents who used tabs in the Hosted Insight Panel. |
# of Agents Using Full Search |
Total number of agents who used the Full Search page that’s associated with the Hosted Insight Panel. |
Percentage of Agents Using Full Search |
Percentage of agents who used the Full Search page that’s associated with the Hosted Insight Panel. |
# of Agents Attaching Search Results to Case |
Total number of agents who attached search results to cases. |
Percentage of Agents Attaching Search Results to Cases |
Percentage of agents who attached search results to cases. |
Required privileges
The following table indicates the required privileges to view and edit dashboards from the Reports (platform-ca | platform-eu | platform-au) page and associated panels (see Manage privileges and Privilege reference).
|
|
Note
Access to dashboards or part of their content may be further restricted as a function of the member (see Manage access to reports and Manage permission filters). |
| Action | Service | Domain | Required access level |
|---|---|---|---|
View dashboards |
Analytics |
Analytics data |
View |
Reports |
View |
||
Organization |
Organization |
View |
|
Edit dashboards |
Analytics |
Administrate |
Allowed |
Analytics data |
View |
||
Reports |
Edit |
||
Organization |
Organization |
View |