Generate Case Assist reports
Generate Case Assist reports
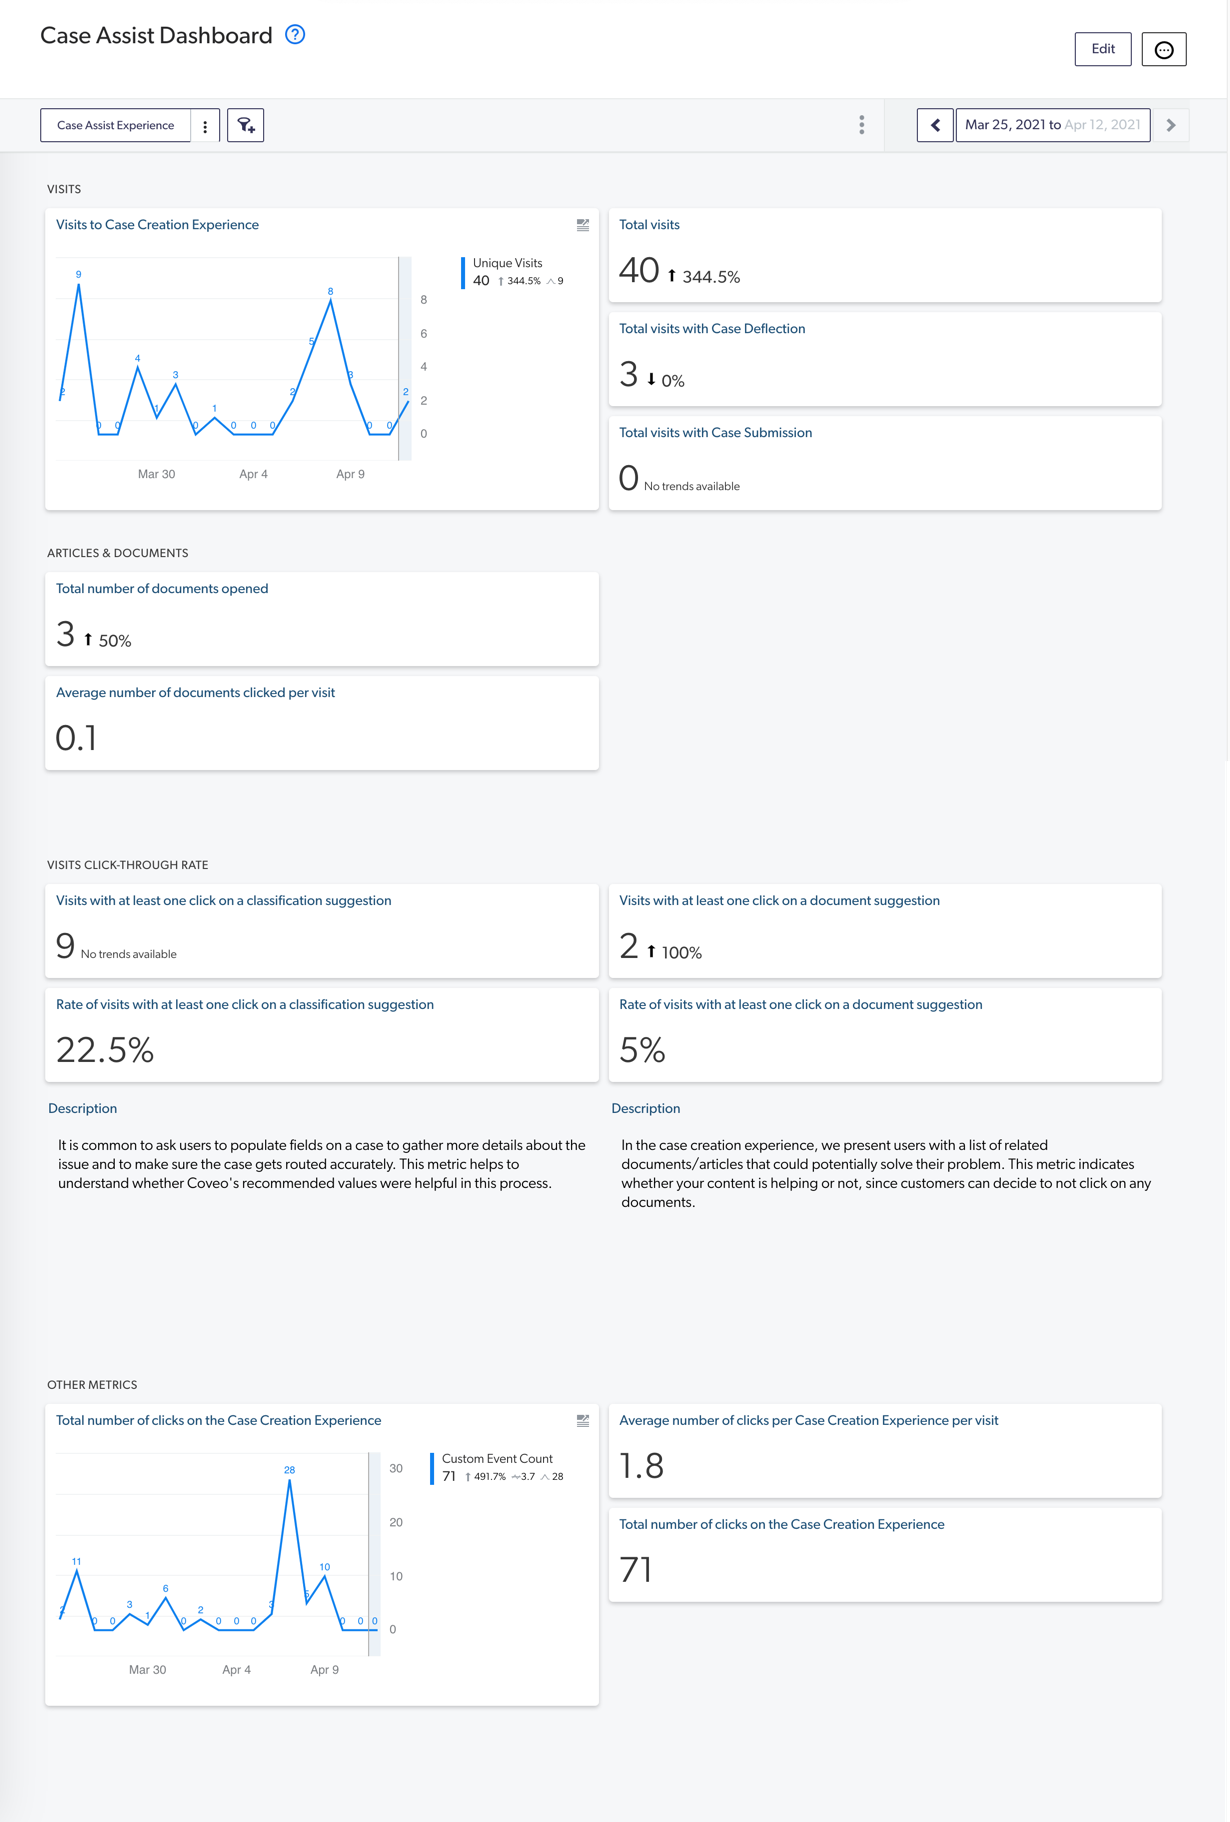
The Reports (platform-ca | platform-eu | platform-au) page of the Coveo Administration Console lets members with the required privileges generate Coveo Usage Analytics (Coveo UA) reports. This article describes the steps you must follow to generate a Case Assist dashboard based on the standard Case Assist events.
|
|
Note
For more information on Coveo UA, see Get Started with Coveo Usage Analytics. |
Step 1: Add a custom dimension
Case Assist uses the Coveo Collect endpoint to send Collect events to Coveo. Although Collect events are converted to regular usage analytics (UA) events, the structure for Collect events is different. In order to create dimensions on data embedded inside these events, you must create a dimension that follows a path to the data.
|
|
Leading practice
For the list of dimensions that are most commonly used in Case Assist reports, see the Common Dimensions Quick Reference. |
-
On the Dimensions (platform-ca | platform-eu | platform-au) page, in the upper-right corner, click Add dimension.
-
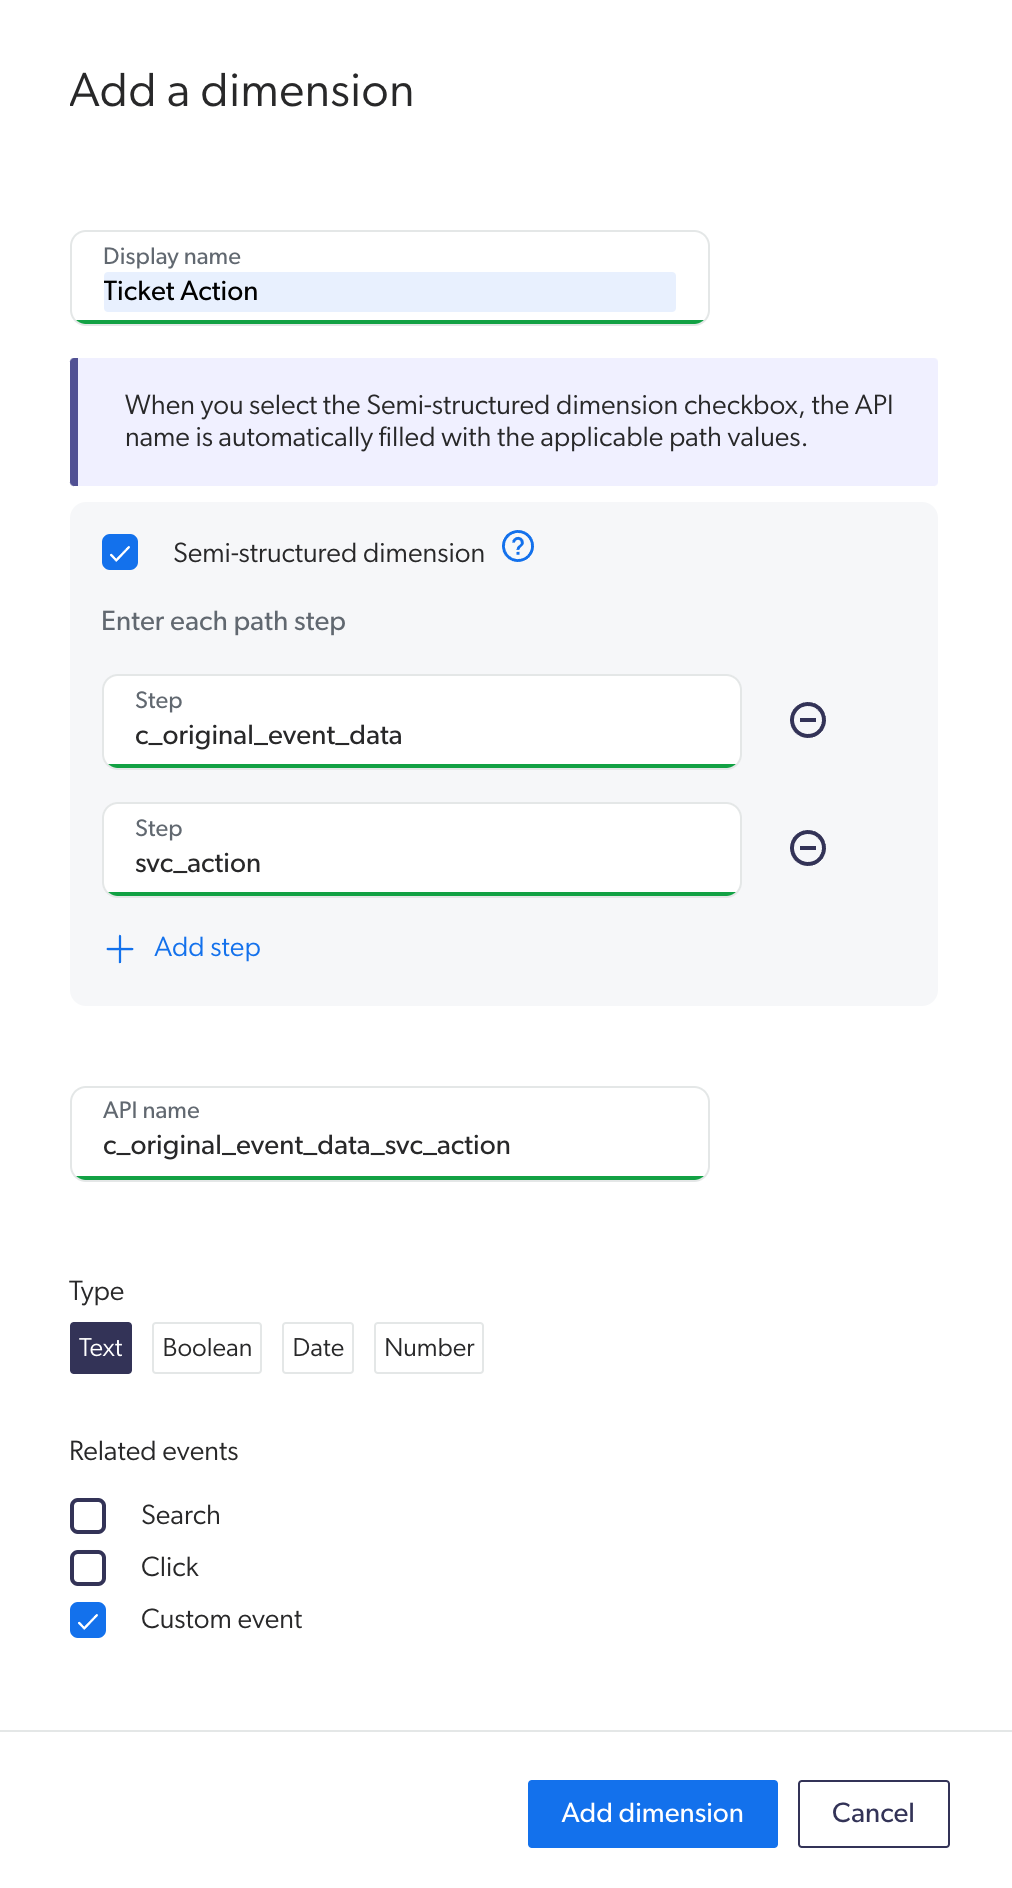
On the Add a dimension panel, specify the following information:
-
In the Display name field, enter
Ticket Actionas the dimension’s display name. -
Select the Semi-structured dimension checkbox.
-
In the Step field, enter
c_original_event_data. -
Click Add step.
-
In the second Step field, enter
svc_action.NoteThe API name is automatically generated when you enter the path step information. We recommend keeping the API name and not modifying it manually.
-
-
Under Type, select Text.
-
Under Related events, select the Custom event checkbox.
For example:
-
-
Click Add dimension.
Step 2: Add a named filter
You must also add a named filter to refine the scope of the Case Assist events that will be displayed by the Case Assist dashboard.
-
On the Named Filters (platform-ca | platform-eu | platform-au) page, in the upper-right corner, click Add named filter.
-
On the Add a named Filter panel, specify the following information:
-
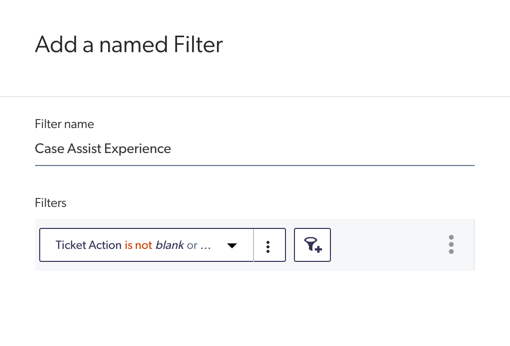
In the Filter name field, enter
Case Assist Experience. -
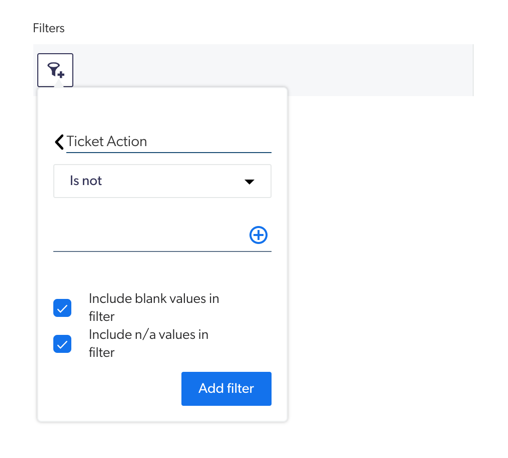
Click
 and enter
 Ticket Actionin the filter’s Search field. -
Under DIMENSION, select Ticket Action Custom event.
-
Under Ticket Action, select Is not from the dropdown menu and then select the Include blank values in filter and Include n/a values in filter checkboxes.
For example:
-
Click Add filter.
The Add a named Filter panel appears as follows:
-
-
Click Add Filter again to complete this procedure.
Step 3: Create a standard Case Assist dashboard
-
Copy the Case Assist JSON report configuration to the clipboard.
-
On the Reports (platform-ca | platform-eu | platform-au) page, in the upper-right corner, click Add and then select Blank dashboard.
NoteLeave the Enter a title field empty. This field will be generated automatically when you import the JSON report configuration.
-
In the upper-right corner of the dashboard, click
 and then select Paste JSON configuration.
 -
In the Import a Report Configuration window, paste the JSON report configuration.
-
Click Import and Save.
The Case Assist dashboard report is displayed.
-
In the upper-right corner of the report, click the box containing the current date range.
-
On the Report Period panel, specify a date range for your dashboard report, and then click Apply.
|
|
Leading practice
You can add more cards to this dashboard by creating other dimensions and following the UA documentation. |
Reference
This section provides the JSON configuration that’s required to generate a Case Assist Dashboard report.
JSON report configuration
{
 "displayName": "Case Assist Dashboard",
 "type": "DASHBOARD",
 "configuration": {
  "description": "",
  "dateRange": {
   "range": "days",
   "length": 19,
   "offset": -18
  },
  "compareRange": {
   "range": "weeks",
   "length": 1,
   "offset": -2
  },
  "tabs": [
   {
    "id": "C35D",
    "title": "Tab 1",
    "sections": [
     {
      "title": "VISITS",
      "position": {
       "col": "1",
       "row": "1",
       "sizex": "6",
       "sizey": "4",
       "minSizex": 2
      },
      "cards": [
       {
        "id": "3756",
        "href": "",
        "title": "Visits to Case Creation Experience",
        "filters": "",
        "metrics": [
         "UniqueVisit"
        ],
        "cardType": "Chart",
        "interval": "AUTO",
        "position": {
         "col": 1,
         "row": 1,
         "sizex": 2,
         "sizey": 3,
         "minSizex": 1,
         "minSizey": 2
        },
        "showPeak": true,
        "eventType": "join",
        "showTrend": true,
        "headerHref": "",
        "metricsSort": [
         "UniqueVisit"
        ],
        "showAverage": true,
        "showMetrics": true,
        "legendTitles": {},
        "dataDisplayMode": "line",
        "bindOnLastSearch": true,
        "editMode": false
       },
       {
        "id": "9909",
        "href": "",
        "title": "Total visits with Case Deflection",
        "metric": "UniqueVisit",
        "filters": "(custom_events.c_svc_action=='ticket_cancel')",
        "cardType": "QuickMetric",
        "position": {
         "col": 3,
         "row": 2,
         "sizex": 2,
         "sizey": 1,
         "minSizex": 1,
         "minSizey": 1
        },
        "eventType": "join",
        "showTrend": true,
        "valueType": "total",
        "headerHref": "",
        "exceedsLicense": false,
        "bindOnLastSearch": false,
        "editMode": false
       },
       {
        "id": "7866",
        "href": "",
        "title": "Total visits with Case Submission",
        "metric": "UniqueVisit",
        "filters": "(custom_events.c_svc_action=='ticket_create')",
        "cardType": "QuickMetric",
        "position": {
         "col": 3,
         "row": 3,
         "sizex": 2,
         "sizey": 1,
         "minSizex": 1,
         "minSizey": 1
        },
        "eventType": "join",
        "showTrend": true,
        "valueType": "total",
        "headerHref": "",
        "exceedsLicense": false,
        "bindOnLastSearch": false,
        "editMode": false
       },
       {
        "id": "7DB3",
        "href": "",
        "title": "Total visits",
        "metric": "UniqueVisit",
        "filters": "",
        "cardType": "QuickMetric",
        "position": {
         "col": 3,
         "row": 1,
         "sizex": 2,
         "sizey": 1,
         "minSizex": 1,
         "minSizey": 1
        },
        "eventType": "join",
        "showTrend": true,
        "valueType": "total",
        "headerHref": "",
        "exceedsLicense": false,
        "bindOnLastSearch": true,
        "editMode": false
       }
      ],
      "editMode": false
     },
     {
      "title": "ARTICLES & DOCUMENTS",
      "position": {
       "col": "1",
       "row": "5",
       "sizex": "6",
       "sizey": "3",
       "minSizex": 2
      },
      "cards": [
       {
        "id": "CD02",
        "href": "",
        "title": "Total number of documents opened",
        "metric": "CustomEvent",
        "filters": "(custom_events.c_svc_action=='suggestion_click')",
        "cardType": "QuickMetric",
        "position": {
         "col": 1,
         "row": 1,
         "sizex": 2,
         "sizey": 1,
         "minSizex": 1,
         "minSizey": 1
        },
        "eventType": "join",
        "showTrend": true,
        "valueType": "total",
        "headerHref": "",
        "exceedsLicense": false,
        "bindOnLastSearch": false,
        "editMode": false
       },
       {
        "id": "755D",
        "href": "",
        "title": "Average number of documents clicked per visit",
        "format": "default",
        "metricA": "CD02",
        "metricB": "7DB3",
        "cardType": "CalculatedMetric",
        "operator": "÷",
        "position": {
         "col": 1,
         "row": 2,
         "sizex": 2,
         "sizey": 1,
         "minSizex": 1,
         "minSizey": 1
        },
        "eventType": "join",
        "headerHref": "",
        "editMode": false
       }
      ],
      "editMode": false
     },
     {
      "title": "VISITS CLICKTHROUGH RATE",
      "position": {
       "col": "1",
       "row": "8",
       "sizex": "6",
       "sizey": "5",
       "minSizex": 2
      },
      "cards": [
       {
        "id": "F30D",
        "href": "",
        "title": "Visits with at least one click on a classification suggestion",
        "metric": "UniqueVisit",
        "filters": "(custom_events.c_svc_action=='ticket_classification_click')",
        "cardType": "QuickMetric",
        "position": {
         "col": 1,
         "row": 1,
         "sizex": 2,
         "sizey": 1,
         "minSizex": 1,
         "minSizey": 1
        },
        "eventType": "join",
        "showTrend": true,
        "valueType": "total",
        "headerHref": "",
        "exceedsLicense": false,
        "bindOnLastSearch": false,
        "editMode": false
       },
       {
        "id": "A9FF",
        "href": "",
        "title": "Rate of visits with at least one click on a classification suggestion",
        "format": "percentage",
        "metricA": "F30D",
        "metricB": "7DB3",
        "cardType": "CalculatedMetric",
        "operator": "÷",
        "position": {
         "col": 1,
         "row": 2,
         "sizex": 2,
         "sizey": 1,
         "minSizex": 1,
         "minSizey": 1
        },
        "eventType": "join",
        "headerHref": "",
        "editMode": false
       },
       {
        "id": "8739",
        "href": "",
        "title": "Visits with at least one click on a document suggestion",
        "metric": "UniqueVisit",
        "filters": "(custom_events.c_svc_action=='suggestion_click')",
        "cardType": "QuickMetric",
        "position": {
         "col": 3,
         "row": 1,
         "sizex": 2,
         "sizey": 1,
         "minSizex": 1,
         "minSizey": 1
        },
        "eventType": "join",
        "showTrend": true,
        "valueType": "total",
        "headerHref": "",
        "exceedsLicense": false,
        "bindOnLastSearch": false,
        "editMode": false
       },
       {
        "id": "5666",
        "href": "",
        "title": "Rate of visits with at least one click on a document suggestion",
        "format": "percentage",
        "metricA": "8739",
        "metricB": "7DB3",
        "cardType": "CalculatedMetric",
        "operator": "÷",
        "position": {
         "col": 3,
         "row": 2,
         "sizex": 2,
         "sizey": 1,
         "minSizex": 1,
         "minSizey": 1
        },
        "eventType": "join",
        "headerHref": "",
        "editMode": false
       },
       {
        "id": "DC45",
        "href": "",
        "style": "info",
        "title": "Description",
        "value": "It is common to ask users to populate fields on a case to gather more details about the issue and to make sure the case gets routed accurately. This metric helps to understand whether Coveo's recommended values were helpful in this process.\n",
        "cardType": "NoteCard",
        "position": {
         "col": 1,
         "row": 3,
         "sizex": 2,
         "sizey": 2,
         "minSizex": 1,
         "minSizey": 1
        },
        "eventType": "join",
        "headerHref": "",
        "isMarkdown": true,
        "editMode": false
       },
       {
        "id": "A5FC",
        "href": "",
        "style": "info",
        "title": "Description",
        "value": "In the case creation experience, we present users with a list of related documents/articles that could potentially solve their problem. This metric indicates whether your content is helping or not, since customers can decide to not click any documents.",
        "cardType": "NoteCard",
        "position": {
         "col": 3,
         "row": 3,
         "sizex": 2,
         "sizey": 2,
         "minSizex": 1,
         "minSizey": 1
        },
        "eventType": "join",
        "headerHref": "",
        "isMarkdown": true,
        "editMode": false
       }
      ],
      "editMode": false
     },
     {
      "title": "OTHER metrics",
      "position": {
       "col": "1",
       "row": "13",
       "sizex": "6",
       "sizey": "4",
       "minSizex": 2
      },
      "cards": [
       {
        "id": "EDAD",
        "href": "",
        "title": "Total number of clicks on the Case Creation Experience",
        "metric": "CustomEvent",
        "filters": "(custom_events.c_svc_action IN [\"suggestion_click\",\"ticket_next_stage\",\"ticket_classification_click\",\"ticket_create\"])",
        "cardType": "QuickMetric",
        "position": {
         "col": 3,
         "row": 2,
         "sizex": 2,
         "sizey": 1,
         "minSizex": 1,
         "minSizey": 1
        },
        "eventType": "join",
        "showTrend": false,
        "valueType": "total",
        "headerHref": "",
        "exceedsLicense": false,
        "bindOnLastSearch": false,
        "editMode": false
       },
       {
        "id": "3635",
        "href": "",
        "title": "Total number of clicks on the Case Creation Experience",
        "filters": "(custom_events.c_svc_action IN [\"suggestion_click\",\"ticket_next_stage\",\"ticket_classification_click\",\"ticket_create\"])",
        "metrics": [
         "CustomEvent"
        ],
        "cardType": "Chart",
        "interval": "AUTO",
        "position": {
         "col": 1,
         "row": 1,
         "sizex": 2,
         "sizey": 3,
         "minSizex": 1,
         "minSizey": 2
        },
        "showPeak": true,
        "eventType": "join",
        "showTrend": true,
        "headerHref": "",
        "metricsSort": [
         "CustomEvent"
        ],
        "showAverage": true,
        "showMetrics": true,
        "legendTitles": {},
        "dataDisplayMode": "line",
        "bindOnLastSearch": false,
        "editMode": false
       },
       {
        "id": "3BD4",
        "href": "",
        "title": "Average number of clicks per Case Creation Experience per visit",
        "format": "default",
        "metricA": "EDAD",
        "metricB": "7DB3",
        "cardType": "CalculatedMetric",
        "operator": "÷",
        "position": {
         "col": 3,
         "row": 1,
         "sizex": 2,
         "sizey": 1,
         "minSizex": 1,
         "minSizey": 1
        },
        "eventType": "join",
        "headerHref": "",
        "editMode": false
       }
      ],
      "editMode": false
     }
    ],
    "active": true,
    "editMode": false
   }
  ],
  "filters": "$CASE_ASSIST_EXPERIENCE",
  "version": 6
 },
 "allAnalyticsViewer": false,
 "filters": []
}
Common dimensions quick reference
This table lists the most common dimensions used in Case Assist reporting. It also provides the paths that are necessary to access the data embedded inside these events.
|
|
Note
To create a dimension for your custom data, see Retrieve custom data. |
| Dimension | Path hierarchy |
|---|---|
Classification Confidence |
|
Classification Value |
|
|
|
Document Position |
|
Document Title |
|
Document URL |
|
Field Name |
|
Ticket Action |
|
Ticket ID |
|
Ticket Subject |
|
Retrieve custom data
Creating custom dimensions for Coveo Collect events requires defining the path to that dimension in the event data. You can determine the path for a given event by downloading a data export from the Visit Browser.
-
On the Visit Browser (platform-ca | platform-eu | platform-au) page, under Show visits containing, select the filter you created in Step 2 (that is,
Case Assist Experience). -
Access the Report Period dialog by clicking the current date range and selecting the date range you want to review (see Review search usage data by date interval).
-
Open the data export CSV file in a spreadsheet application.
-
Locate the customData column and select a cell to access the event data for a specific visit.
-
Copy the event data into an integrated development environment (IDE) or a trusted JSON formatter to format it.
Once you format the JSON data, an output similar to the following is generated.
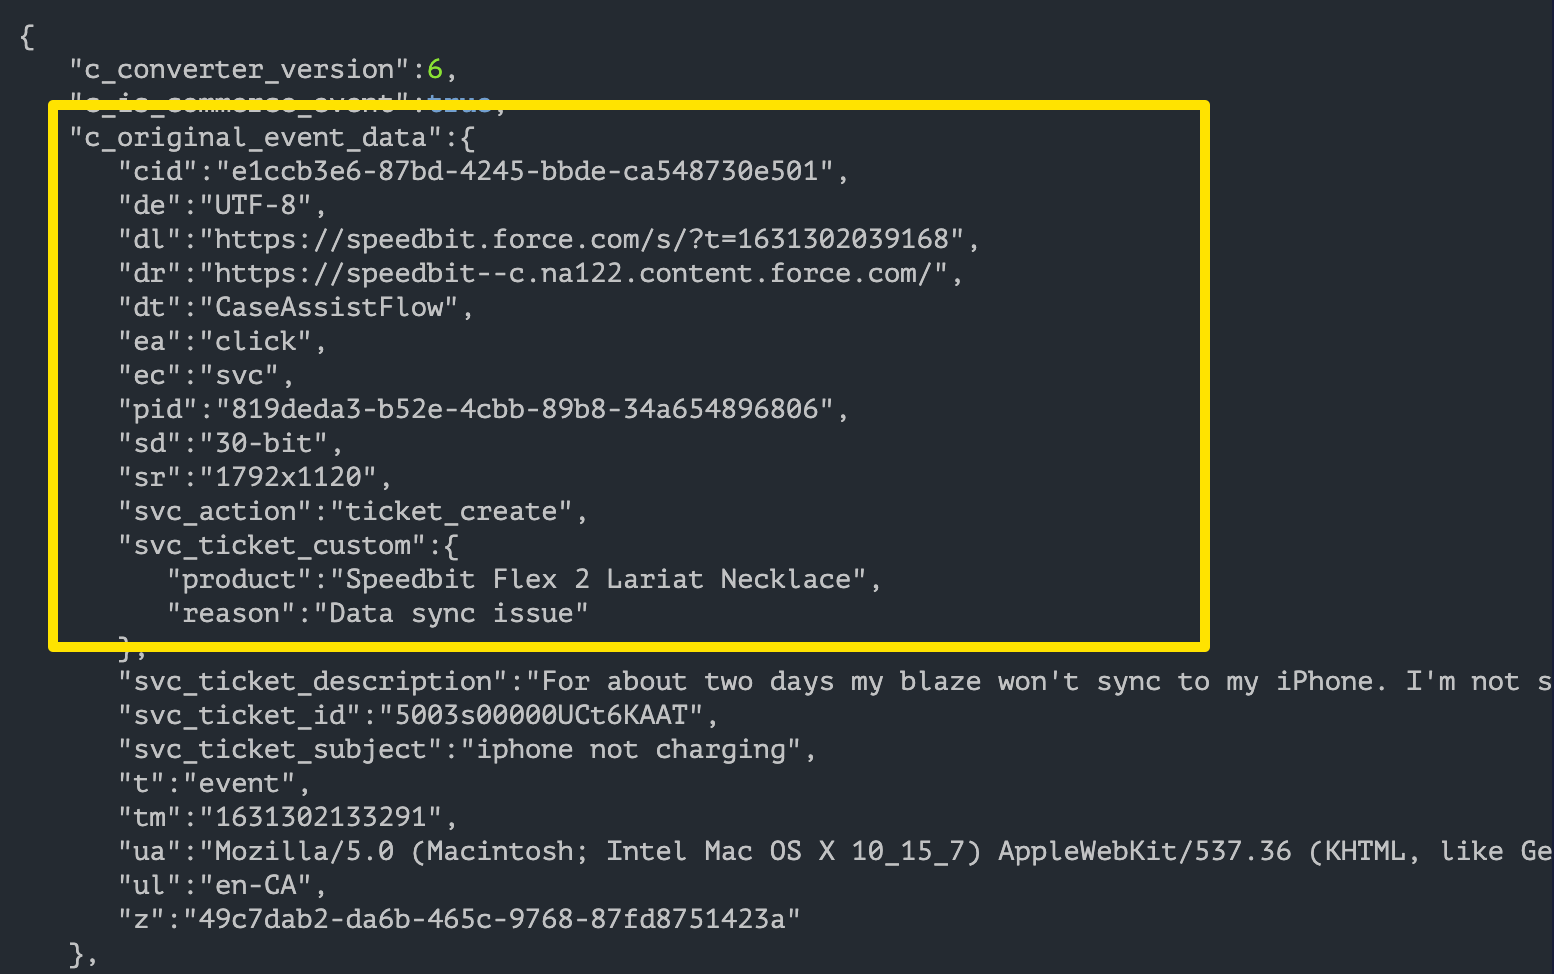
Notice the structure of the
c_original_event_dataevent. Every indentation represents the path level required to reach the requested data.For example, in order to create a dimension for the reason data, you would need to specify the following path entries when adding a custom dimension:
-
c_original_event_data -
svc_ticket_custom -
reason
-