Examine usage analytics data
Examine usage analytics data
The Coveo Analytics service provides essential feedback when designing and improving your search solution. It lets you visualize the Coveo Analytics data of your search solution by generating meaningful dashboards and explorers. This feedback helps you learn whether your solution is relevant, where it needs improvement, where business opportunities might lie, and more.
Set up Usage Analytics
For the UA service to be effective, your search interfaces need to log the appropriate events. These become dimensions and metrics, which are available in reports.
Coveo Machine Learning (Coveo ML) features also require UA data to function.
Log events
When you create a search interface using the Coveo Atomic library, the components will log search and click events for you. You can further customize event logging to meet your needs.
To power a Coveo ML Content Recommendation (CR) model, you must also send view events for the target items.
Track events
You can use your browser console to track the events that are logged by your search interface.
For example, you submit a query from a search interface, causing a search event to be logged. In your web browser, open the developer tools to inspect the corresponding HTTP request.
You’ll see something like the following:
Header
POST https://analytics.cloud.coveo.com/rest/ua/v15/analytics/search?visitor=28s6g49d-f81s-1435-2r5x153dle72 HTTP/1.1
Content-Type: application/json
Cookie: visitor=28s6g49d-f81s-1435-2r5x153dle72
Authorization: Bearer **********-****-****-****-************Payload
[
  {
    "anonymous": false,
    "language": "en",
    "originLevel1": "CommunitySearchPage",
    "originLevel2": "All",
    "actionCause": "searchFromLink",
    "queryText": "coveo",
    "responseTime": 145,
    "searchQueryUid": "7bfc652a-9dea-4811-b3f9-6d24345c37ce",
    "userAgent": "Mozilla/5.0 (Macintosh; Intel Mac OS X 10_15_7) AppleWebKit/537.36 (KHTML, like Gecko) Chrome/109.0.0.0 Safari/537.36"
  }
]
Dimensions and metrics
The UA service extracts the information logged in events into dimensions and metrics that you can use in reports.
To exploit custom metadata in your reports, create corresponding dimensions.
Explore the default Summary dashboard
The Summary dashboard in the Coveo Administration Console is a predefined general overview of all of the basic information captured in usage analytics. It’s a good out-of-the-box starting point to analyze your data.
Activity tab
The Activity tab is where you can see the number of queries, clicks, visits, and users captured over a given period of time. It provides a general idea of what happened and who used your Coveo-powered search interfaces.
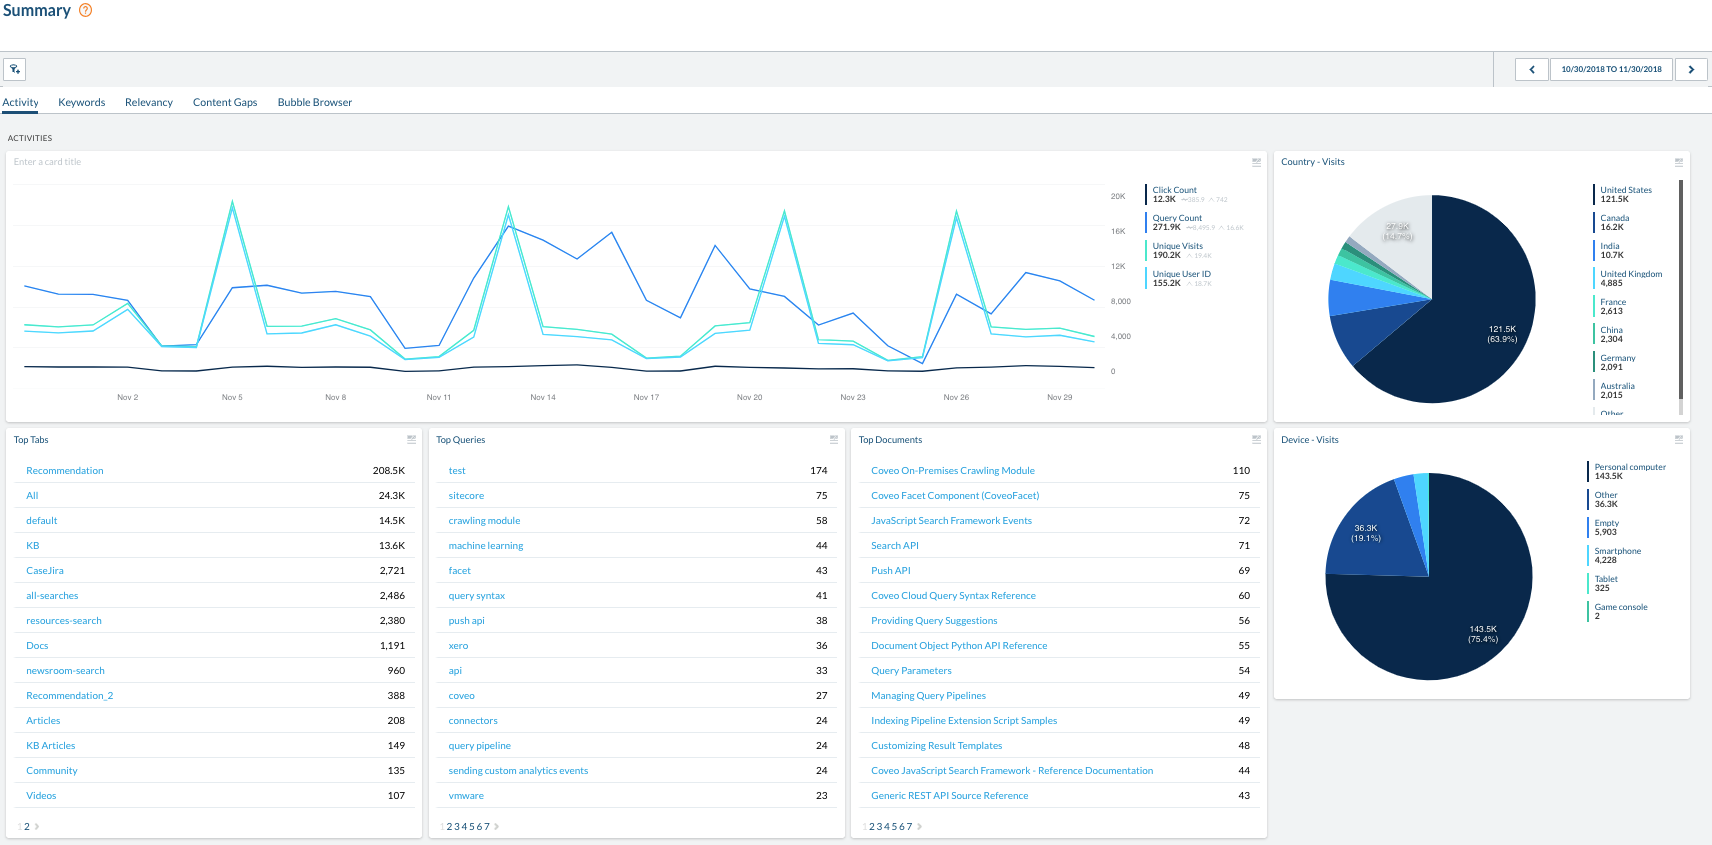
The date range selector is at the top right of the Activity tab. Click it to choose the period of time that you want to analyze.
The line graph displays query, click, visit, and user counts for the selected frequency and date range. Right next to the graph, you can see the total, average, and peak counts for the same metrics.
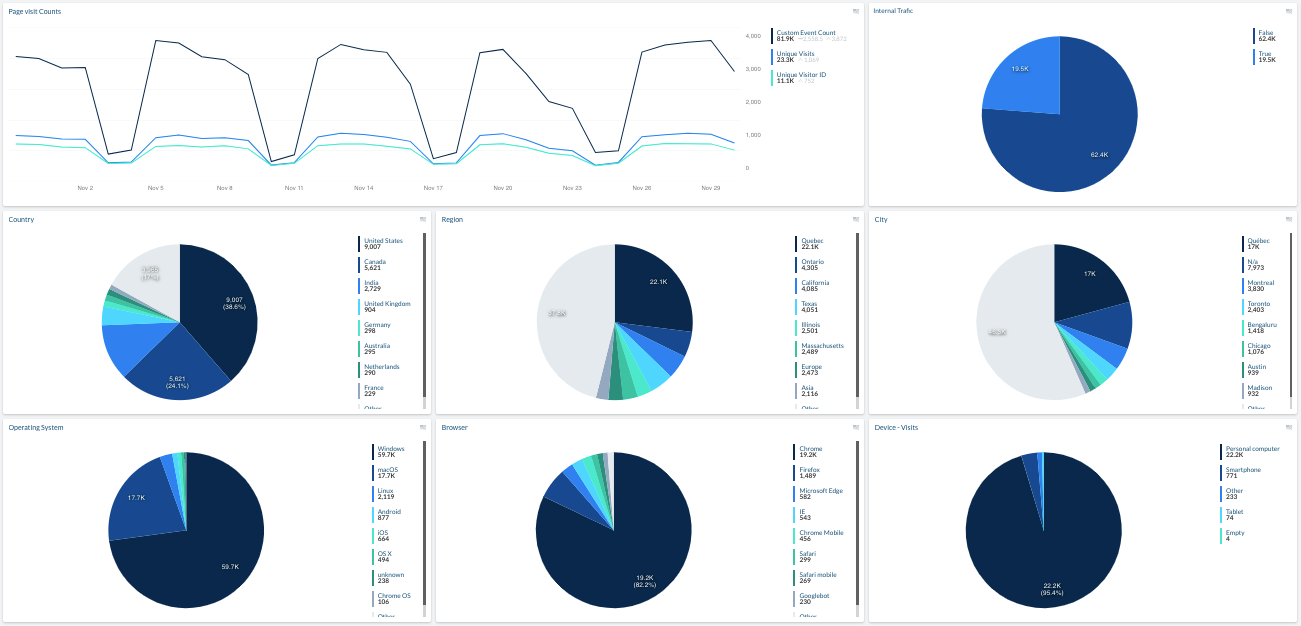
The pie charts display the visits by country and device.
The tables list the most popular tabs, queries, and items.
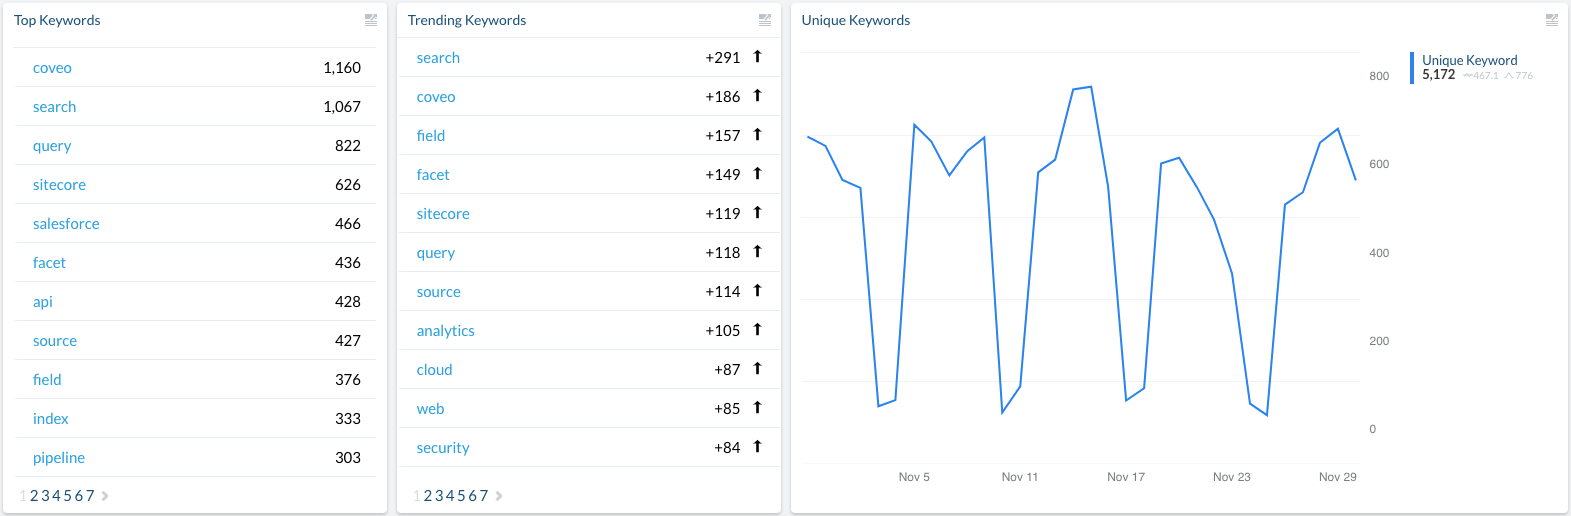
Keywords tab
The Keywords tab lists the keywords that are most often used in queries as well as trending keywords. It also plots out a graph of the number of unique keywords used over time.
As with all of the reports in the dashboard, you can drill down on specific keywords, change the analysis time frame using the date range selector, and add new parameters to each table or graph to meet your needs.
Relevancy tab
The Relevancy tab graphs the Average Click Rank (ACR) and Search Event Clickthrough over time, and also lists the queries with the lowest relevance.
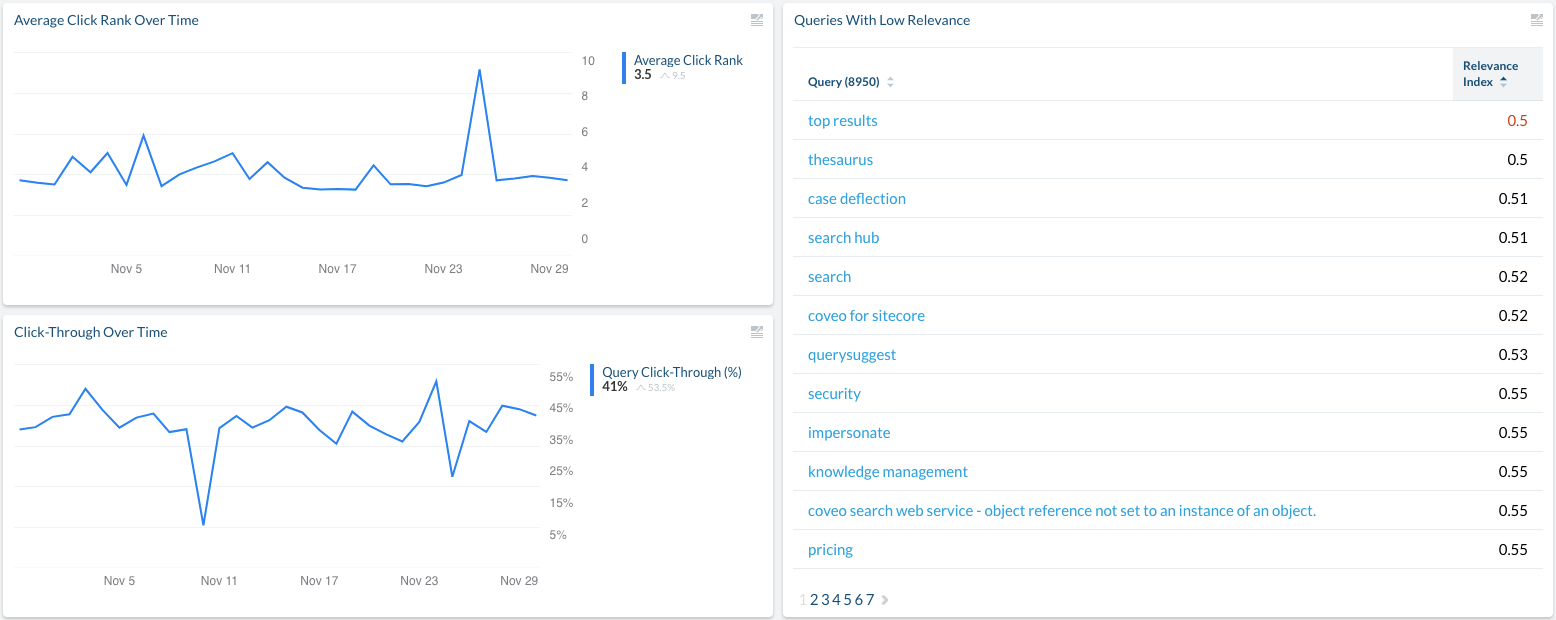
The click rank metric is the average position of the clicked item in the result list.
The lower the value, the better.
Any value over 10 should be investigated.
The clickthrough graph shows the ratio of queries which are followed by a click from the user.
The higher the value, the better.
Typically, queries displaying optimal results have a clickthrough ratio above 0.66.
Any value under 0.50 should be investigated, and in particular those which also have a high search event count (that is, users frequently enter this query, but don’t click anything afterward).
The Relevance Index is a derived metric based on the clickthrough ratio, ACR, and frequency of the query.
The higher the score, the better.
The leading practice is to investigate anything at or below 0.50.
Content Gaps tab
The Content Gaps tab analyzes the queries entered by users to identify the top occurrences with no results, no clicks, or poor ranking of clicked content. This analysis helps to identify queries that don’t return relevant results and, from there, pinpoint potential content gaps. Knowing which topics are the most searched by users also helps in prioritizing content creation.
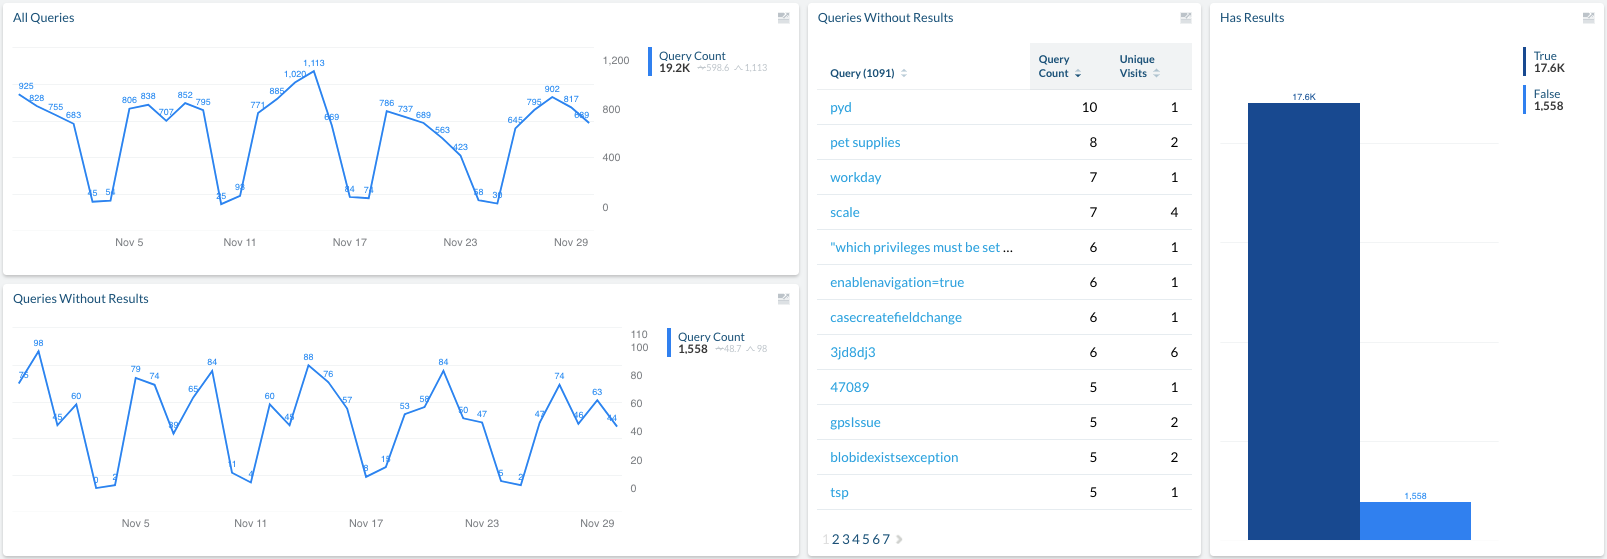
The Content Gaps tab displays time series graphs that show the number of total queries submitted and the number of queries that returned no results. The goal is for the number of queries with no results to decrease over time.
|
|
Note
The number of search events without results may also include queries for which results exist, but which were not returned to the user due to a lack of permissions or over-filtering. |
Create custom dashboards
If the Summary dashboard doesn’t meet all of your needs, you can build custom dashboards in which you can leverage you own custom dimensions.
What’s next?
The Set up a query pipeline article outlines the various ways you can set up query pipelines in your Coveo organization to ensure that specific relevance tuning rules and Coveo ML models only apply to the proper audiences.